32
views
0
recommends
+1 Recommend
0 collections
    0
    shares
      • Record: found
      • Abstract: found
      • Article: found
      Is Open Access

      Using geovisual analytics in Google Earth to understand disease distribution: a case study of campylobacteriosis in the Czech Republic (2008–2012)

      research-article

      Read this article at

      Bookmark
          There is no author summary for this article yet. Authors can add summaries to their articles on ScienceOpen to make them more accessible to a non-specialist audience.

          Abstract

          Background

          Visual analytics aims to connect the processing power of information technologies and the user’s ability of logical thinking and reasoning through the complex visual interaction. Moreover, the most of the data contain the spatial component. Therefore, the need for geovisual tools and methods arises. Either one can develop own system but the dissemination of findings and its usability might be problematic or the widespread and well-known platform can be utilized. The aim of this paper is to prove the applicability of Google Earth™ software as a tool for geovisual analytics that helps to understand the spatio-temporal patterns of the disease distribution.

          Methods

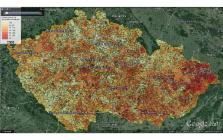
          We combined the complex joint spatio-temporal analysis with comprehensive visualisation. We analysed the spatio-temporal distribution of the campylobacteriosis in the Czech Republic between 2008 and 2012. We applied three main approaches in the study: (1) the geovisual analytics of the surveillance data that were visualised in the form of bubble chart; (2) the geovisual analytics of the disease’s weekly incidence surfaces computed by spatio-temporal kriging and (3) the spatio-temporal scan statistics that was employed in order to identify high or low rates clusters of affected municipalities. The final data are stored in Keyhole Markup Language files and visualised in Google Earth™ in order to apply geovisual analytics.

          Results

          Using geovisual analytics we were able to display and retrieve information from complex dataset efficiently. Instead of searching for patterns in a series of static maps or using numerical statistics, we created the set of interactive visualisations in order to explore and communicate results of analyses to the wider audience. The results of the geovisual analytics identified periodical patterns in the behaviour of the disease as well as fourteen spatio-temporal clusters of increased relative risk.

          Conclusions

          We prove that Google Earth™ software is a usable tool for the geovisual analysis of the disease distribution. Google Earth™ has many indisputable advantages (widespread, freely available, intuitive interface, space-time visualisation capabilities and animations, communication of results), nevertheless it is still needed to combine it with pre-processing tools that prepare the data into a form suitable for the geovisual analytics itself.

          Electronic supplementary material

          The online version of this article (doi:10.1186/1476-072X-14-7) contains supplementary material, which is available to authorized users.

          Related collections

          Most cited references40

          • Record: found
          • Abstract: not found
          • Article: not found

          R: A Language and environmental for statistical computing

            Bookmark
            • Record: found
            • Abstract: found
            • Article: not found

            Geographically masking health data to preserve confidentiality.

            The conventional approach to preserving the confidentiality of health records aggregates all records within a geographical area that has a population large enough to ensure prevention of disclosure. Though this approach normally protects the privacy of individuals, the use of such aggregated data limits the types of research one can conduct and makes it impossible to address many important health problems. In this paper we discuss the design and implementation of geographical masks that not only preserve the security of individual health records, but also support the investigation of questions that can be answered only with some knowledge about the location of health events. We describe several alternative methods of masking individual-level data, evaluate their performance, and discuss both the degree to which we can analyse masked data validly as well as the relative security of each approach, should anyone attempt to recover the identity of an individual from the masked data. We conclude that the geographical masks we describe, when appropriately used, protect the confidentiality of health records while permitting many important geographically-based analyses, but that further research is needed to determine how the power of tests for clustering or the strength of other associative relationships are adversely affected by the characteristics of different masks.
              Bookmark
              • Record: found
              • Abstract: found
              • Article: found
              Is Open Access

              Geovisual analytics to enhance spatial scan statistic interpretation: an analysis of U.S. cervical cancer mortality

              Background Kulldorff's spatial scan statistic and its software implementation – SaTScan – are widely used for detecting and evaluating geographic clusters. However, two issues make using the method and interpreting its results non-trivial: (1) the method lacks cartographic support for understanding the clusters in geographic context and (2) results from the method are sensitive to parameter choices related to cluster scaling (abbreviated as scaling parameters), but the system provides no direct support for making these choices. We employ both established and novel geovisual analytics methods to address these issues and to enhance the interpretation of SaTScan results. We demonstrate our geovisual analytics approach in a case study analysis of cervical cancer mortality in the U.S. Results We address the first issue by providing an interactive visual interface to support the interpretation of SaTScan results. Our research to address the second issue prompted a broader discussion about the sensitivity of SaTScan results to parameter choices. Sensitivity has two components: (1) the method can identify clusters that, while being statistically significant, have heterogeneous contents comprised of both high-risk and low-risk locations and (2) the method can identify clusters that are unstable in location and size as the spatial scan scaling parameter is varied. To investigate cluster result stability, we conducted multiple SaTScan runs with systematically selected parameters. The results, when scanning a large spatial dataset (e.g., U.S. data aggregated by county), demonstrate that no single spatial scan scaling value is known to be optimal to identify clusters that exist at different scales; instead, multiple scans that vary the parameters are necessary. We introduce a novel method of measuring and visualizing reliability that facilitates identification of homogeneous clusters that are stable across analysis scales. Finally, we propose a logical approach to proceed through the analysis of SaTScan results. Conclusion The geovisual analytics approach described in this manuscript facilitates the interpretation of spatial cluster detection methods by providing cartographic representation of SaTScan results and by providing visualization methods and tools that support selection of SaTScan parameters. Our methods distinguish between heterogeneous and homogeneous clusters and assess the stability of clusters across analytic scales. Method We analyzed the cervical cancer mortality data for the United States aggregated by county between 2000 and 2004. We ran SaTScan on the dataset fifty times with different parameter choices. Our geovisual analytics approach couples SaTScan with our visual analytic platform, allowing users to interactively explore and compare SaTScan results produced by different parameter choices. The Standardized Mortality Ratio and reliability scores are visualized for all the counties to identify stable, homogeneous clusters. We evaluated our analysis result by comparing it to that produced by other independent techniques including the Empirical Bayes Smoothing and Kafadar spatial smoother methods. The geovisual analytics approach introduced here is developed and implemented in our Java-based Visual Inquiry Toolkit.
                Bookmark

                Author and article information

                Contributors
                lukas.marek@upol.cz
                pavel.tucek@upol.cz
                vit.paszto@gmail.com
                Journal
                Int J Health Geogr
                Int J Health Geogr
                International Journal of Health Geographics
                BioMed Central (London )
                1476-072X
                28 January 2015
                2015
                : 14
                : 7
                Affiliations
                Department of Geoinformatics, Faculty of Science, Palacky University in Olomouc, 17.listopadu 50, 77146 Olomouc, Czech Republic
                Article
                626
                10.1186/1476-072X-14-7
                4328415
                25628063
                9ffad438-7f25-46c0-8067-f61a6732d58d
                © Marek et al.; licensee BioMed Central. 2015

                This article is published under license to BioMed Central Ltd. This is an Open Access article distributed under the terms of the Creative Commons Attribution License ( http://creativecommons.org/licenses/by/4.0), which permits unrestricted use, distribution, and reproduction in any medium, provided the original work is properly credited. The Creative Commons Public Domain Dedication waiver ( http://creativecommons.org/publicdomain/zero/1.0/) applies to the data made available in this article, unless otherwise stated.

                History
                : 30 November 2014
                : 19 January 2015
                Categories
                Research
                Custom metadata
                © The Author(s) 2015

                Public health
                google earth™,space-time pattern,spatio-temporal interpolation,campylobacteriosis,czech republic,interactive visualisation,clustering

                Comments

                Comment on this article