There is no author summary for this article yet. Authors can add summaries to their articles on ScienceOpen to make them more accessible to a non-specialist audience.
Summary
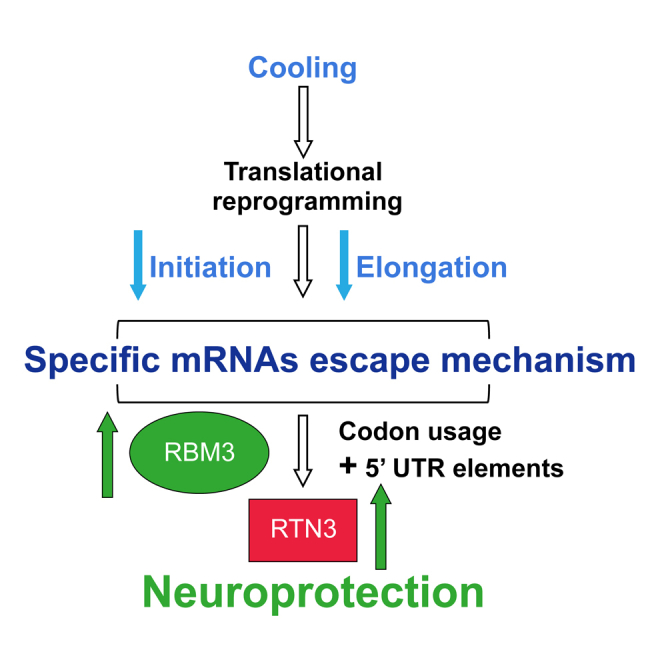
Cooling and hypothermia are profoundly neuroprotective, mediated, at least in part,
by the cold shock protein, RBM3. However, the neuroprotective effector proteins induced
by RBM3 and the mechanisms by which mRNAs encoding cold shock proteins escape cooling-induced
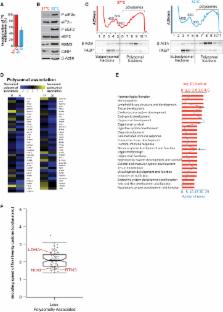
translational repression are unknown. Here, we show that cooling induces reprogramming
of the translatome, including the upregulation of a new cold shock protein, RTN3,
a reticulon protein implicated in synapse formation. We report that this has two mechanistic
components. Thus,
RTN3 both evades cooling-induced translational elongation repression and is also bound
by RBM3, which drives the increased expression of RTN3. In mice, knockdown of RTN3 expression
eliminated cooling-induced neuroprotection. However, lentivirally mediated RTN3 overexpression
prevented synaptic loss and cognitive deficits in a mouse model of neurodegeneration, downstream
and independently of RBM3. We conclude that RTN3 expression is a mediator of RBM3-induced
neuroprotection, controlled by novel mechanisms of escape from translational inhibition
on cooling.
Graphical Abstract
Highlights
•
Cooling-induced reprogramming of the translatome increases synthesis of
RTN3
•
The neuroprotective protein RBM3 binds
RTN3 mRNA and drives its expression
•
RTN3 overexpression prevents synaptic loss in mice with prion disease
•
RTN3 expression is a mediator of RBM3-induced neuroprotection
Abstract
Therapeutic hypothermia is neuroprotective, and the cold shock protein RMB3 plays
a critical role in mediating synaptic repair processes that accompany cooling. Bastide
and Peretti et al. show that cooling selectively reprograms the translatome and identify
RTN3 as a cold-induced protein that acts downstream of RBM3 in the neuroprotection
pathway.
Introduction Human tissues contain common and distinct macromolecular components in varying amounts. Large-scale, high-throughput analyses of mRNA expression in human tissues show tissue-specific gene expression (e.g., [1–3]). Transfer RNA (tRNA) plays a central role in translating the mRNA sequence into the protein sequence. Approximately 450 tRNA genes have been annotated in the human genome [4,5] (http://lowelab.ucsc.edu/GtRNAdb/Hsapi). These tRNA genes are scattered throughout the genome and are present on all but the Y chromosome. Twenty-two additional tRNA genes are present in human mitochondrial DNA [6,7]. Thus, there are approximately 473 human tRNAs that are grouped into 49 isoacceptor families to decode the 21 amino acids specified by the genetic code (20 standard amino acids and selenocysteine). To our knowledge, no systematic studies of tRNA expression among human tissues have been published. The dearth of information on tRNA expression is the result of technical and intellectual obstacles. Accurate quantitation of individual tRNA species is challenging due to the extensive secondary and tertiary structure of tRNA and numerous post-transcriptional modifications [8], both of which interfere with reverse transcription and hybridization of short oligonucleotides. Enthusiasm for tackling this challenge was low because prior to the human genome sequencing project, human tRNAs were considered to be no more diverse than those in unicellular organisms [8,9]. Complete sequencing of the human genome revealed, however, that over 270 different tRNA sequences are present among approximately 450 tRNA genes. Since only 61 possible anticodons are specified by the triplet code, there are many distinct tRNA species with identical anticodons, but they contain sequence differences in the tRNA body. This sequence diversity is not an inevitable result of genetic drift in multicopy genes over the course of evolution but may also be of some functional relevance [10]. In stark contrast to vertebrate genomes, there are only 51 different tRNA sequences among 274 yeast tRNA genes [4,5,11]. Why should the human genome contain such a diverse array of tRNA sequences? A compelling explanation is that controlling expression of individual tRNA species enables another level of translational control for specific gene products. In bacteria and yeast, differences in the relative abundance of tRNA isoacceptors for a given amino acid clearly impact the synthesis of highly expressed proteins [12,13]. Codon bias in tissue-specifically expressed genes have been reported, prompting the insight that such biases may be related to potential tissue-dependent differences in tRNA expression [14]. tRNA is also the dominant ligand for the elongation factor 1α (EF-1α). Given the myriad supratranslational functions of EF-1α [15,16] in cellular physiology, variations in tRNA expression could influence these processes which include bundling of actins and disassembly of microtubules [17,18]. For these reasons, even a rudimentary analysis of tRNA expression in human tissues could reveal novel aspects of human tRNA biology. Here we describe the comparative analysis of tRNA levels in eight human tissues and two human cell lines using a microarray method adapted from our previously developed arrays for bacterial tRNAs [19,20]. Our human tRNA microarray contains 42 probes for nuclear encoded tRNAs and 21 probes for mitochondrial encoded tRNAs. These probes cover tRNAs for all amino acids with enough sequence differences to be uniquely distinguished. Our results show that tRNA levels vary widely among human tissues and coordinate according to the properties of their cognate amino acids. The differences in relative expression of tRNA isoacceptors in several tissues show statistically significant correlation to codon usage of a group of approximately 15 to 40 of tissue-specific genes that are expressed at the highest levels among tissue-specific genes. Results/Discussion Design and Specificity of Microarrays for Human tRNA tRNA was quantified by taking advantage of its universally conserved 3′CCA sequence to attach a fluorescently labeled probe to tRNA present in total RNA prepared from tissues or cell lines. tRNA labeled in this manner was hybridized to DNA probes arrayed on glass slides. The brain sample was included in all hybridizations to correct for the variations in fluorescence labeling and array manufacturing. We used probes that are 70 to 80 nucleotides long, covering the length of the entire tRNA minus the conserved 3′CCA sequence. Probes at these lengths significantly increase hybridization efficiency and eliminate the sensitivity to potential variations in post-transcriptional modifications [19]. We designed the probes for nuclear tRNA genes to distinguish expression between tRNA isoacceptors, i.e., tRNAs with different anticodon sequences that read the codons for the same amino acid. Often, an isoacceptor family is encoded by multiple highly homologous genes. For example, five tRNAArg isoacceptors read the six arginine codons. Our work on bacterial tRNAs showed that two tRNAs having more than ten different residues can be generally distinguished on a microarray, whereas significant cross-hybridization occurs when the sequence difference between two tRNAs is less than eight [19]. Sequence alignment by Clustal X [21] shows that there are sufficient sequence differences between tRNAArg isoacceptors (more than ten among 70 to 75 residues) to enable design of three isoacceptor probes that separately cover tRNA genes with ACG (modified to ICG [22]), CCT, or TCT anticodons. Since sequence differences between tRNAArg with CCG and TCG anticodons are insufficient (fewer than eight in 70 to 75 residues) to allow the design of two distinct probes, a single probe is used for these tRNAs. Thirty-seven probes are designed in this way to cover the 49 human tRNA isoacceptors plus the initiator tRNAMet (Tables S1 and S2). The gene sequences for tRNALys(TTT), tRNALeu(TAA), tRNAThr(TGT), and tRNAThr(CGT) isoacceptors are distinct enough that separate probes can be designed for their individual tRNA genes. The mitochondrial encoded tRNA sequences are sufficiently different so that 21 probes are designed to cover all mitochondrial tRNA genes except tRNAGlu (Tables S3 and S4). We established the specificity of the human tRNA array by examining the cross-hybridization of probes designed to detect tRNAs from different organisms (Figure 1). Based on sequence conservation, most of the 42 probes for human nuclear encoded tRNAs should hybridize to mouse tRNAs as well as to some Drosophila and Caenorhabditis elegans tRNAs [4,5]. Mitochondrial tRNA genes between human and mouse are sufficiently unique that 18 distinct probes for mouse mitochondrial tRNAs are present on the array. Approximately two-thirds of the Drosophila tRNAs and one-third of the C. elegans tRNAs have sufficient sequence similarity to human tRNAs that the same probes are used for these tRNAs. Ten separate probes for Drosophila and 34 probes for C. elegans tRNAs are also included on the array. The microarray was tested using total RNA isolated from HeLa cells, mouse kidney, and entire C. elegans. Figure 1B shows one of the representative 32 blocks on the microarray. This block contains two to four repeats each of nine human probes, two mouse mitochondrial probes, six Drosophila or C. elegans probes, three probes as negative controls, and four blank spots. When HeLa total RNA was used, eight of nine human probes showed signals ranging from weak to strong. No signals were detected from the two mouse mitochondrial tRNA probes. Weak signals could be seen on one of the three negative control probes and two of six Drosophila and C. elegans probes. When mouse kidney total RNA was applied to the array, the two mouse mitochondrial tRNA probes showed intermediate to strong signals. When C. elegans total RNA was applied, all ten homologous probes showed weak to strong signals, with only a lone Drosophila probe showing a weak signal among the non–C. elegans probes. Using HeLa RNA, probes for human tRNAs show significantly higher hybridization signals than nonhuman probes (Figure 1C). Hybridization to all but one nonhuman probe yields signals that are lower than 10% of the strongest signals among the human tRNA probes. A single exception is the strong hybridization to the C. elegans tRNAHis probe which is not predicted by sequence similarity. These results show that the specificity of the microarray is sufficiently high given the extensive conservation among tRNAs between these organisms and supports its validity for measuring specific differences in tRNA expression. To determine the appropriate dynamic range for the fluorescent dye ratios, serial dilutions of total RNA from HeLa were performed (Figure 1D). The dynamic range is at least two orders of magnitude as the dye ratios remain within a constant threshold of 1.25-fold. This result also suggests a detection limit of 1.25-fold for measured changes in tRNA abundance between two human samples. In bacteria and yeast, the relative abundance between tRNA members in an isoacceptor family ranges from 1-fold to 20-fold [23–26]. Our microarray is clearly capable of detecting differences within this range. tRNA Expression in Human Tissues and Cell Lines In unicellular prokaryotes and eukaryotes, the abundance of tRNA isoacceptors is correlated with codon preferences among genes encoding highly expressed proteins, e.g., ribosomal proteins [11,27,28]. Mining mRNA microarray expression data, Plotkin et al. [14] reported the existence of tissue-based codon bias in paralogous genes; they proposed that this codon bias is related to tissue-specific differences in the abundance of corresponding decoding tRNAs. To explore this intriguing hypothesis, we used our microarray to measure the relative tRNA expression between eight tissues: brain, liver, vulva, testis and ovary, thymus, lymph node, and spleen. We included the latter three immune tissues based on an unexpected consequence of human genome sequencing: the single largest cluster of tRNA genes resides in the gene cluster of the major histocompatibility complex (also known as the human leukocyte antigen complex) [29]. The existence of one-third of all human tRNA genes in the human leukocyte antigen complex suggests that expression of these genes may be related to immune system function. For example, a high expression level of tRNA in this region may facilitate high expression of histocompatibility complex genes following a signaling event [29]. Microarray results show overall variations in the expression levels of tRNA among different tissues (Figures 2 and S1). For example, all tRNAs in ovary have lower levels relative to brain. Some tRNAs in spleen have higher, while others have lower levels, compared to those in brain (Figure 2A). Within individual tissues, the maximal differences between the relative tRNA levels can be as large as approximately tenfold (e.g., vulva, thymus) or only approximately threefold (e.g., testis). Nuclear and mitochondrial encoded tRNA levels can be approximated separately by the mean and median tissue-to-brain ratio (Figure 2B and 2C). Liver and vulva have approximately two-thirds the amount of tRNA present in brain, while the reproductive tissues of testis and ovary express approximately one-third as much tRNA as the brain. Among the three immune tissues, thymus is comparable to liver and vulva, lymph node is similar to the reproductive tissues, while spleen has similar tRNA levels as the brain. On the other hand, the relative mitochondrial encoded tRNA levels in all seven tissues are lower than that in brain, a result that may reflect high mitochondrial translation activity in the brain (e.g., [30]). Since mature tRNA in human is thought to be very stable, total tRNA levels likely reflect tRNA transcription rates [28]. tRNA is transcribed by multisubunit complexes of RNA polymerase III, TFIIIB and TFIIIC [31,32]. Varying the abundance of one or more of these protein factors as suggested by results from mRNA expression arrays [1,2] could lead to varying levels of transcription among tRNA genes. On the other hand, the levels or activities of these subunit components can also be controlled post-trascriptionally and post-translationally. Understanding the basis for tissue specific differences in total tRNA awaits direct experimental examination of all of the potential factors. Large differences in the relative abundance of individual tRNAs from brain versus other tissues (e.g., ovary and spleen, Figure 2A) are observed. For example, both tRNAIle isoacceptors in ovary are expressed at only one-tenth of the level in brain, but these tRNAs in spleen are expressed above their levels in brain. To facilitate evaluation of tissue-specific differences in relative levels of individual tRNAs (Figure 3), we normalized fluorescent ratios internally to the separate median values among the nuclear- (Figure 2B) and the mitochondrial- (Figure 2C) encoded tRNAs. Variations in the relative expression of tRNA isoacceptors among tissues are readily observed, suggesting a possible relationship between tRNA abundance and codon usage among different tissues (Figure 3 and Table 1). For example, among the members of the tRNAArg isoacceptor family, four probes separate the five isoacceptor groups according to their codon-reading capabilities: Arg-ICG reads CGU/C; Arg-YCG reads CGA/G; Arg-CCT reads only AGG; and Arg-TCT reads primarily AGA codons. A clear difference among these tRNAArg isoacceptors can be seen among the brain and the liver, thymus, and lymph node. Arg-TCT and Arg-CCT are preferred over Arg-ICG and Arg-YCG in these nonbrain tissues, suggesting a possible preference in reading AGA and AGG codons. Another example is the tRNALys isoacceptor family. The AAG-reading isoacceptor is present in higher amounts than the AAA-reading isoacceptor in almost all tissues. This difference is particularly pronounced in vulva, thymus, and lymph node. The same type of analysis can be applied to tRNA isoacceptors for the glycine, isoleucine, leucine, serine, threonine, and valine families (Table 1). The relative expression of nuclear encoded tRNAs in two commonly used cell lines (HeLa and HEK293) differs by less than twofold and is quite similar among the isoacceptors (Figures 3 and S1 and Table 1). This result suggests that tRNA isoacceptor levels do not play a major role in differential protein expression in these cell lines, even though they are derived from different tissues (cervix and embryonic kidney). This may also be a result of nontissue processes such as the immortalized nature of these lines. Interesting trends can be observed on the basis of the cognate amino acid properties of tRNA (Figure 3B). tRNAs and their corresponding amino acids can be divided into four groups: hydrophobic (Ile, Leu, Met, Phe, Trp, and Val), small (Ala, Cys, Gly, and Pro), charged (Arg, Asp, Glu, His, and Lys), and polar (Asn, Gln, Ser, Se-Cys, Thr, and Tyr). Among the nuclear encoded tRNAs, the three immune tissues (thymus, lymph node, and spleen) contain increased levels of tRNA for the hydrophobic group and decreased levels of tRNA for the charged group compared to brain. In contrast, the two reproductive tissues (testis and ovary) contain decreased levels of tRNA for the hydrophobic group and increased levels of tRNA for the small group. Trends for the liver and vulva are more similar to those of the immune tissues, with the increase in the tRNA for the hydrophobic group less pronounced. In general, brain contains increased levels of tRNA for the charged group (except for some tRNAArg isoacceptors) and for the polar group (except for some tRNAThr isoacceptors). The mitochondrial encoded tRNAs show distinctly different trends compared to the nuclear encoded tRNAs. The three immune tissues have decreased levels of mitochondrial tRNA for the hydrophobic group but comparable or increased levels of mitochondrial tRNA for the polar group relative to those in brain. The two reproductive tissues have decreased levels of mitochondrial tRNA for the small group than those in brain. These differences may reflect the amino acid availability in these tissues, although how this affects RNA polymerase III transcription is unclear. Correlating Relative tRNA Abundance to Codon Usage of Tissue-Specific Gene The differential expression of tRNA isoacceptors can potentially be used to control translation via the codon usage of specific genes. However, it is unclear to which genes and at which stages of cellular development and differentiation this mechanism may be applied. Codon preferences are clearly present in some tissue-specifically expressed genes [14], although this bias has also been suggested to represent regional variations rather than selection for translational performance [33]. We attempted to find potential correlations between the codon usage of tissue-specifically expressed genes to the relative tRNA abundance among these tissues (Figure 4). In bacteria and yeast, correlations of the abundance of tRNA isoacceptors to codon usage are derived primarily from genes that are translated at high levels (e.g., ribosomal proteins). Adapting this strategy, thresholds were algorithmically established to determine the top 13 to 43 tissue-specific transcripts according to the Human GeneAtlas GNF1H gcRMA dataset at http://symatlas.gnf.org/SymAtlas [2]. Gene sequences for the most highly expressed tissue-specific transcripts were then compiled and analyzed for codon content at http://bioinformatics.org/sms [34]. Some gene information was not included due to ambiguity of data or nomenclature. Table 2 lists the tissue-specific threshold expression levels used for this analysis and the tabulated gene and codon counts. The dataset contains 7,737 to 21,163 codons for six tissues: brain, liver, testis, ovary, thymus, and lymph node (we were unable to carry out this analysis for vulva and spleen). To mimic the relative tRNA abundance measurements, the raw codon count is normalized to the total number of codons in every tissue, and the sum of each normalized codon count from nonbrain tissues is divided by the sum of the same count from brain (Tables S5 and S6). The correlation of codon usage versus relative tRNA abundance (not divided by median values) was explored in three ways. First, all data points from the same tissue are plotted. For liver and brain, a linear fit of this plot gives an r-value of 0.78 and a p-value of <0.0001, a statistically significant correlation (Figure 4A). Similar correlations for testis, ovary, thymus, lymph node, and brain are much weaker and not statistically relevant (unpublished data). The fold over median expression threshold for liver is the highest among all tissues examined (Table 2), suggesting that the liver-specific genes are expressed at much higher levels than other tissue-specific genes. The high expression levels of liver-specific genes may explain why a significant tRNA abundance–codon usage correlation is only found in liver versus brain. Second, data points for each tRNA isoacceptor are plotted across five tissues. Linear correlations for three tRNA isoacceptors [tRNALeu(CAG); tRNALys(CTT), and tRNAVal(mAC)] can be found with r-values from 0.90 to 0.94 and p-values from 0.016 to 0.039 (Figure 4B). Similar correlations for other isoacceptors are not statistically significant. Third, only two amino acids (arginine and leucine) have more than three data points and they are plotted for each tissue. Linear correlations among the four tRNAArg for two tissues (liver and thymus) can be found with r-values of 0.93 and 0.97 and p-values of 0.067 and 0.033, respectively (Figure 4C). Similar correlations for other tissues are much weaker. Conclusions We have found that human tRNA expression varies by as much as tenfold among human tissues. Given the central role of tRNA in protein synthesis, this wide variation of tRNA abundance may reflect translational control via the availability of certain tRNAs. Since tRNA is the dominant ligand for the multitasking protein EF-1α, variations in tRNA levels may provide a mechanism to link translation with the dynamics of the cytoskeleton. Transcriptional control of tRNA genes may therefore play a role in the function of human tissues or possibly in cellular development and differentiation. tRNA abundance may also play a role in translational control of highly expressed, tissue-specific genes via their codon usage. Determination of tRNA abundance and charging levels [20] for differentiating cells or cells undergoing adaptation may reveal previously unseen connections between translation and other cellular processes. Materials and Methods Materials. Total RNA from eight human tissues was purchased from Stratagene (http://www.stratagene.com): brain (No. 540005, No. 735006), liver (No. 735017), vulva (No. 735067), testis (No. 735064), ovary (No. 735260), thymus (No. 540141), lymph node (No. 540021), and spleen (No. 540035). After the microarray measurements were completed, it was found that the tissue RNA samples from Stratagene underwent an LiCl precipitation step which is known to result in the loss of small RNAs [35]. We subsequently found that the loss of tRNA is quite minimal when the concentration of the total RNA was greater than 1.5 μg/μl prior to the addition of LiCl and that the total amount of tRNA in brain was similar to that in HeLa isolated using a different protocol (Figure S2). The Stratagene RNAs we used are certified for microRNA studies. It is clear that under certain conditions, LiCl can precipitate microRNAs that are 3.5 times smaller than tRNAs. These results lend confidence that it is possible to perform LiCl precipitation and not affect tRNA studies. The total RNA from the HeLa and HEK293 cell lines were obtained using RNAwiz (Ambion, http://www.ambion.com) according to manufacturer's manuals. This procedure does not include LiCl precipitation or other known steps biasing against tRNAs. The three tRNA standards, E. coli tRNALys (No. R6018), E. coli tRNATyr (No. R0258), and yeast tRNAPhe (No. R4018), were purchased from Sigma-Aldrich (http://www.sigmaaldrich.com) and used without further purifications. tRNA microarrays. The microarray experiment consists of four steps starting from total RNA: (i) deacylation to remove remaining amino acids attached to the tRNA, (ii) selective Cy3/Cy5 labeling of tRNA, (iii) hybridization with prefabricated arrays, and (iv) data analysis. For deacylation, 0.25 μg/μl total RNA premixed with the three tRNA standards at 0.17 μM each was incubated in 100 mM Tris-HCl (pH 9.0) at 37 °C for 30 min. The solution was neutralized by the addition of an equal volume of 100 mM Na-acetate/acetic acid (pH 4.8) plus 100 mM NaCl, followed by ethanol precipitation. Deacylated total RNA was dissolved in water, and its integrity was examined using agarose gel electrophoresis. For Cy3/Cy5 labeling, tRNA in the total RNA mixture was selectively labeled with either Cy3 or Cy5 fluorophore using an enzymatic ligation method described previously [19,20]. The ligation reaction depends on the presence of the universally conserved 3′CCA nucleotides in every tRNA. Two different labeling oligonucleotides for the T4 DNA ligase were used in this work (Figure 1A). Both oligonucleotides are designed and shown to have insignificant bias for Cy3 and Cy5 dyes (Figure 1B and unpublished data). Oligo-1 contains 5-aminoallyl-U, and the Cy3 and Cy5 fluorophores were attached after the ligation step upon reactions with succimidyl esters of Cy3 or Cy5 (Amersham Biosciences, http://www.amersham.com, described in [20]). Oligo-2 contains an 8–base pair hybrid helix and either a Cy3 or Cy5 fluorophore preattached in the loop. The ligation reaction used an approximately 1 μM concentration of purified T4 DNA ligase for Oligo-1 but only 0.5 U/μl T4 DNA ligase (US Biochemicals, http://www.usbweb.com) for Oligo-2. Hence, the ligation of Oligo-2 required substantially less T4 DNA ligase compared to Oligo-1. Hybridization was performed at 60 °C overnight with 1 μg each of Cy3- or Cy5-labeled total RNA mixture using Oligo-1 and 1 μg of Cy3-labeled total RNA and 2.5 μg of Cy5-labeled total RNA using Oligo-2 (because only 40% of Oligo-2 used in this work contained the Cy5 fluorophore). Multiple arrays were run using the brain reference sample labeled with either Cy3 or Cy5. The microarray printing and hybridization conditions were the same as those in bacterial tRNA studies [19,20]. DNA oligonucleotide probes were designed on the basis of the 2001 version of the human genome [36]. Subsequent revision of the human genome sequences and tRNA annotations showed that 136 probes are useful for our study. They included 42 probes for human nuclear encoded tRNA genes, 21 probes for human mitochondrial encoded tRNA genes, 18 probes for mouse mitochondrial encoded tRNA genes, ten probes for Drosophila nuclear tRNA genes, 34 probes for C. elegans nuclear tRNA genes, three probes for bacterial and yeast tRNA standards, and eight probes for human tRNA hybridization controls. Nonhuman probes were used as specificity controls for hybridization of human samples. Eighteen replicates of each probe were printed on each array. The descriptions and sequences of the DNA oligonucleotide probes used for human nuclear and mitochondrial tRNA genes are provided in Tables S1 through S4. For data analysis, arrays were scanned using GenePix 4000b scanner (Axon Instruments, http://www.axon.com) to obtain fluorescence intensities and the Cy5/Cy3 ratio per pixel at each probe spot. The averaged Cy5/Cy3 ratio per pixel at each probe spot was first normalized to an averaged value of the three tRNA standards prior to subsequent analysis. For all tissue samples, the brain total RNA was used as the reference sample at equal amounts of total RNA as determined by the UV absorbance. tRNA constitutes up to 15% of total RNA. Supporting Information Figure S1 Relative Ratios of Each Human tRNA Probe for Liver, Vulva, Testis, Thymus, and Lymph Node versus Brain (55 KB PDF) Click here for additional data file. Figure S2 Recovery of tRNA Following LiCl Precipitation (36 KB PDF) Click here for additional data file. Table S1 Human Probes for Chromosomal Encoded tRNA Genes (10 KB PDF) Click here for additional data file. Table S2 Sequences of Human Probes for Chromosomal Encoded tRNA Genes (17 KB PDF) Click here for additional data file. Table S3 Human Probes for Mitochondrial Encoded tRNA Genes (8 KB PDF) Click here for additional data file. Table S4 Sequences of Human Probes for Mitochondrial Encoded tRNA Genes (12 KB PDF) Click here for additional data file. Table S5 Gene Sequences for Tissue-Specifically Expressed Gene According to mRNA Expression Data (429 KB XLS) Click here for additional data file. Table S6 Averaged Ratios of tRNA Abundance for Seven Tissues Relative to Brain (34 KB XLS) Click here for additional data file.
The mechanisms leading to neuronal death in neurodegenerative disease are poorly understood. Many of these disorders, including Alzheimer's, Parkinson's and prion diseases, are associated with the accumulation of misfolded disease-specific proteins. The unfolded protein response is a protective cellular mechanism triggered by rising levels of misfolded proteins. One arm of this pathway results in the transient shutdown of protein translation, through phosphorylation of the α-subunit of eukaryotic translation initiation factor, eIF2. Activation of the unfolded protein response and/or increased eIF2α-P levels are seen in patients with Alzheimer's, Parkinson's and prion diseases, but how this links to neurodegeneration is unknown. Here we show that accumulation of prion protein during prion replication causes persistent translational repression of global protein synthesis by eIF2α-P, associated with synaptic failure and neuronal loss in prion-diseased mice. Further, we show that promoting translational recovery in hippocampi of prion-infected mice is neuroprotective. Overexpression of GADD34, a specific eIF2α-P phosphatase, as well as reduction of levels of prion protein by lentivirally mediated RNA interference, reduced eIF2α-P levels. As a result, both approaches restored vital translation rates during prion disease, rescuing synaptic deficits and neuronal loss, thereby significantly increasing survival. In contrast, salubrinal, an inhibitor of eIF2α-P dephosphorylation, increased eIF2α-P levels, exacerbating neurotoxicity and significantly reducing survival in prion-diseased mice. Given the prevalence of protein misfolding and activation of the unfolded protein response in several neurodegenerative diseases, our results suggest that manipulation of common pathways such as translational control, rather than disease-specific approaches, may lead to new therapies preventing synaptic failure and neuronal loss across the spectrum of these disorders.
Introduction Protein translation is central to cellular life. Although individual steps in translation such as the formation of the 43S preinitiation complex are known in intricate molecular detail, a global understanding of how these steps combine to set the pace of protein production for individual genes remains elusive (Jackson et al., 2010; Plotkin and Kudla, 2011). Factors such as biased codon usage, gene length, transcript abundance, and initiation rate are all known to modulate protein synthesis (Bulmer, 1991; Chamary et al., 2006; Cannarozzi et al., 2010; Tuller et al., 2010a; Shah and Gilchrist, 2011; Plotkin and Kudla, 2011; Gingold and Pilpel, 2011; Chu et al., 2011; Chu and von der Haar, 2012), but how they interact with one another to collectively determine translation rates of all transcripts in a cell is poorly understood. Systematic measurements for some of the most critical rates—such as the gene-specific rates of 5′ UTR scanning and start codon recognition—are extremely difficult to perform. As a result, questions as fundamental as the relative role of initiation versus elongation in setting the pace of protein production are still actively debated (Kudla et al., 2009; Tuller et al., 2010a; Plotkin and Kudla, 2011; Gingold and Pilpel, 2011; Chu et al., 2011; Chu and von der Haar, 2012; Ding et al., 2012). Biotechnical applications that exploit these processes stand to gain from a quantitative understanding of the global principles governing protein production (Gustafsson et al., 2004; Salis et al., 2009; Welch et al., 2009). Recent advances in synthetic biology allow high-throughput studies on the determinants of protein production (Kudla et al., 2009; Welch et al., 2009; Salis et al., 2009). Sequencing techniques such as ribosomal profiling provide snapshots of the translational machinery in a cell (Ingolia et al., 2009; Reid and Nicchitta, 2012). One way to leverage this new information is to develop a computationally tractable model of translation in a cell, to parameterize it from known measurements, and to use it to infer any unknown parameters of global translation dynamics. Here, we develop a whole-cell model of protein translation, and we apply it to study translation dynamics in yeast. Our model describes translation dynamics to the single-nucleotide resolution for the entire transcriptome. In combination with ribosomal profiling data, we use our model to infer the initiation rates of all abundant yeast transcripts. We systematically explore how the codon usage, transcript abundance, and initiation rate of a transgene jointly determine protein yield and cellular growth rate. Applied to the endogenous genome, our model reproduces one of the defining features of ribosomal profiling measurements: a decrease in ribosome density with codon position. We evaluate both elongation- and initiation-driven hypotheses for the ramp of 5′ ribosome densities. We also describe the factors that influence ribosomal pausing along mRNA molecules, as well as the effects of stress on translation. Results Model We developed a continuous-time, discrete-state Markov model of translation. The model tracks all ribosomes and transfer RNA (tRNA) molecules in a cell—each of which is either freely diffusing or bound to a specific messenger RNA (mRNA) molecule at a specific codon position at any time point (Extended Experimental Procedures). Rates of initiation and elongation are based on physical parameters that have been experimentally determined in yeast, including the cell volume, the abundances of ribosomes and tRNAs, and their diffusion constants (Tables 1 and S1 available online). Transition rates among states are parameterized in seconds so that the model describes the dynamics of translation in real time, as opposed to using arbitrary discrete time steps. We provide a precise definition of the Markov state space, as well as pseudocode and complete source code in Data S1 and S2 and also Table S2. Unlike many other models of translation (Gilchrist and Wagner, 2006; Mitarai et al., 2008; Reuveni et al., 2011), which treat each mRNA molecule in isolation and assume an inexhaustible supply of free ribosomes that initiate the message at a constant rate, our model keeps track of every tRNA, mRNA, and ribosome molecule in the cell simultaneously, and so it captures the indirect effects of one gene’s translation on another’s (Figure 1). In particular, if many ribosomes are engaged in translating the mRNAs of one gene, this reduces the pool of free ribosomes and tRNAs available to translate other genes. Our model makes a number of simplifying assumptions. Most importantly, our model treats the total number of ribosomes, tRNA molecules, and mRNA molecules in the cell as fixed quantities because the dynamics of their production and decay are typically slower than those of protein translation (García-Martínez et al., 2004; Larson et al., 2011). We specify the total number of ribosomes and tRNA molecules to agree with their experimentally determined values in an exponential-phase yeast cell: 2 × 10⁵ and 3.3 × 10⁶, respectively (Waldron and Lacroute, 1975; Warner, 1999; von der Haar, 2008; Siwiak and Zielenkiewicz, 2010; Chu and von der Haar, 2012). We infer gene-specific initiation probabilities (Extended Experimental Procedures) so that 85% of ribosomes are bound to mRNAs in equilibrium in agreement with measurements in yeast (Arava et al., 2003; Zenklusen et al., 2008). We further assume that tRNA charging is fast, which is reasonable because 80% of all tRNAs are charged at any given time in exponential-phase cells (Varshney et al., 1991; Jakubowski and Goldman, 1992; Chu et al., 2011). As a result of these parameters, the equilibrium number of free ribosomes available in the cell is typically smaller than the number of available charged tRNAs of each species. In this regime, we will show that protein production is generally limited by the rate of translation initiation in the sense that increasing the initiation probability of an mRNA molecule will typically increase the rate at which protein is produced, but increasing its codon elongation rates generally will not increase production. The initiation-limited regime agrees with the long-standing view of endogenous protein synthesis (Andersson and Kurland, 1990; Bulmer, 1991; Eyre-Walker and Bulmer, 1993; Lackner et al., 2007; Plotkin and Kudla, 2011), but it contrasts with other models of translation that assume an inexhaustible supply of ribosomes, which are always available for initiation of an mRNA regardless of how many ribosomes are bound to other mRNAs (Mitarai et al., 2008; Reuveni et al., 2011; Tuller et al., 2011). We implemented our Markov model of translation using the Gillespie algorithm. We simulated 1,500 s of translation and extracted the final 500 s to collect data on translation dynamics in equilibrium (Experimental Procedures). Our implementation requires about 1,300 s of computation time to simulate all initiation and elongation events in a wild-type cell for 1,500 s. In these simulations, at equilibrium, the mean elongation rate is 9.3 aa/s (median = 9.5 aa/s), and the mean distance between consecutive bound ribosomes is 60 codons (median = 34). Both of these quantities agree with empirical measurements in yeast (Arava et al., 2003). Codon Bias and Transgene Expression Optimizing a transgene’s codon usage to the tRNA content of a cell often improves protein yield (Gustafsson et al., 2004; Welch et al., 2009), but the underlying mechanisms have not been systematically explored. To study this in a quantitative model, we simulated translation of a transgene within the context of a Saccharomyces cerevisiae cell containing 3,795 endogenous genes whose transcript levels and gene-specific initiation probabilities were estimated from ribosomal profiling data (Ingolia et al., 2009) (Experimental Procedures). By varying the codon adaptation index (CAI) (Sharp and Li, 1987) and transcript level of the transgene across many simulations, we delineated the regimes for which increasing codon bias is expected to increase protein yield and by what mechanisms. Using the green fluorescent protein (GFP) as an example transgene, we found that increasing the CAI of a transgene significantly improves the rate of proteins produced per mRNA molecule only when the transgene mRNA accounts for a substantial proportion of all the mRNA in the transcriptome (Figure 2 and Table S4). For a transgene whose messages account for 50% of the cell’s mRNA content, for example, increasing CAI from almost zero to one results in nearly 3.6-fold more proteins produced per transcript per second (Figure 2B, triangles), whereas optimizing CAI in a transgene expressed at only 1% of the transcriptome results in a more modest increase (∼50%) in its rate of protein production (Figure 2B, squares). These results help explain the divergent views of biotechnological studies, which often report large gains in protein production upon optimizing transgene CAI (Gustafsson et al., 2004), and evolutionary studies of endogenous translation, which typically report very small effects of CAI on protein production per message (Bulmer, 1991; Tuller et al., 2010b; Gingold and Pilpel, 2011; Plotkin and Kudla, 2011). The discrepancy arises because transgenes are usually overexpressed and comprise a substantial fraction of all cellular mRNA, whereas endogenous genes are expressed at 1% of the transcriptome or less. Why does codon bias strongly influence protein yield only when a gene has high mRNA abundance? The reason has to do with the effects of codon bias on the pool of free ribosomes, as seen in Figure 3. At equilibrium, neglecting rare abortion events, the rate of protein production from any given mRNA (i.e., the rate of polypeptide termination) must equal the rate of initiation on that mRNA, which, in turn, depends primarily on the abundance of free ribosomes in the cell. Increasing the CAI of a gene will increase its codon elongation rates and thus decrease the density of ribosomes on each of its mRNAs, but the overall effect on the pool of free ribosomes is small when the gene accounts for a small proportion ( 0.9; Figures S1A and S1B). We then inverted our equations to infer gene-specific initiation probabilities from observed densities of ribosomes on transcripts. An alternative method of estimating initiation probabilities from profiling data was independently developed by Siwiak and Zielenkiewicz (2010). We validated that our analytical method can indeed reliably infer initiation probabilities when we simulate ribosome profiling data for S. cerevisiae genes with known initiation probabilities (Figure S1B). Using this method, we inferred the initiation probabilities for the 3,795 S. cerevisiae genes whose ribosomal densities have been reliably measured (Ingolia et al., 2009). The initiation probabilities we inferred for yeast genes vary by many orders of magnitude. According to these estimates, the average time between initiation events on a given mRNA molecule ranges from 4 s (fifth percentile) to 233 s (95th percentile), with a median value of 40 s. This variation provides the cell considerable range for tuning protein levels by modulating initiation probabilities of genes. Experiments with individual genes (Hall et al., 1982; Duan et al., 2003) and with large sets of coding sequences (Kudla et al., 2009) suggest that strong 5′ mRNA structure reduces the rate of initiation, presumably by obstructing ribosomal-mRNA binding. Using a large set of synthetic GFP genes that vary synonymously, we confirmed experimentally that 5′ mRNA folding plays a predominant role in determining protein levels in S. cerevisiae (Figure S2), which is similar to the role it plays in Escherichia coli (Kudla et al., 2009). In light of these experiments, we compared the initiation probabilities we estimated for 3,795 endogenous yeast genes with their predicted 5′ mRNA folding energies (nucleotides −4 to +37, Experimental Procedures) and found a strong positive correlation (Pearson correlation R = 0.125 and p 0.9). Moreover, we validated that we can reliably infer initiation probabilities from simulated ribosomal profiling data even when gene length and initiation probabilities are positively correlated (Figures S1C and S1D and Extended Experimental Procedures), indicating that the negative correlation observed in the real yeast data is not an artifact of our inference procedure. Why should short genes experience selection for fast initiation? Short genes are enriched for constitutively expressed housekeeping and ribosomal genes (Hurowitz and Brown, 2003), which must produce protein as rapidly as possible. In addition, housekeeping genes tend to have shorter 5′ UTRs and are under weaker posttranscriptional regulation (Hurowitz and Brown, 2003; Lin and Li, 2012). The probability of successful ribosomal binding and scanning on an mRNA may depend on the length of its 5′ UTRs; indeed, we find that genes with shorter 5′ UTRs exhibit higher inferred initiation probabilities (p 5 × 10⁵, Extended Experimental Procedures) exceeds the empirical measurement of the total number of ribosomes in a yeast cell (1.87 × 10⁵ ± 5.6 × 10⁴; von der Haar, 2008) by a factor of 2.5. When we artificially increase the number of ribosomes and tRNAs in our simulations beyond their empirically measured abundances, we can recapitulate the patterns produced by TASEP models of translation (Figure S5A). In this regime, which we argue is unrealistic, we still observe a decrease in the average ribosome density with codon position, but this ramp is caused by collisions along each mRNA, and it persists regardless of gene-specific initiation probabilities or codon ordering within genes (Figure S5B). Thus, models of translation in both initiation- and elongation-limited regimes produce similar global patterns of ribosomal densities with codon position but for entirely different and contradictory mechanisms. Only the initiation-limited regime is consistent with empirical measurements of ribosome abundances in the yeast cell. Ribosomal Interference and Codon Usage Our simulations allow us to estimate the amount of time a ribosome spends waiting for a tRNA at each codon position, called ribosomal pausing, and also the amount of time a ribosome wastes at any position due to interference by an adjacent downstream ribosome that prevents further elongation, called ribosomal stalling. We identified the sequence features of a gene that predispose it to ribosomal pausing or stalling (Experimental Procedures). Using GFP as an example transgene simulated at 50% mRNA transcriptome abundance, we found that increasing the transgene’s codon bias tends to decrease the overall density of ribosomes on its mRNAs, as well as the frequency of ribosomal stalling (Figure 6). For a transgene with high CAI, the probability of finding a ribosome bound at a given codon is negatively correlated with the abundance of corresponding iso-accepting tRNAs (Pearson correlation, R = −0.802), but this correlation is much weaker for a transgene with low CAI (R = 0.042 and p > 0.05). In other words, the waiting time per codon is largely determined by the abundance of corresponding tRNAs for a gene with high CAI. But for a gene with low CAI, ribosomes densities are higher overall and so the waiting time at each codon is also influenced by interference with downstream ribosomes and, therefore, is not easily predicted from tRNA abundances. In fact, regardless of CAI, there is a strong correlation between ribosomal stalling at a position and the probability of ribosomal pausing 10 codons downstream (R = 0.958 for high CAI and R = 0.644 for low CAI). Because the probability of pausing in a high-CAI transgene sequence is correlated with tRNA abundances, it is possible to predict the positions of ribosomal stalling from the transgene sequence alone. Understanding the effects of amino acid and codon usage on pausing and stalling may prove useful in designing transgene sequences to minimize ribosomal interference on its mRNAs. Protein Translation under Stress The simulations of translation described above were performed under parameters of optimal cell growth. Translation dynamics likely differ when a cell experiences stress. To investigate how protein production is affected by stress and how a cell might adapt in response, we simulated translation under conditions of amino acid starvation. We modeled starvation of a particular amino acid by reducing the abundance of its (charged) cognate tRNAs by either 2-, 5-, or 10-fold. As expected, we found that the rate of total protein production decreases under stress (Figures 7A and S6A). Furthermore, starvation of different amino acids can have radically different effects on protein production. For example, 10-fold starvation of amino acids Ala, Leu, Glu, Gln, or Ser decreases total protein production by at least 10-fold, whereas an equivalent starvation of Met, Trp, or His reduces protein production by less than 25% (Figure 7A). As expected, the effect of starvation of a particular amino acid is significantly correlated with its abundance encoded in the transcriptome (p 3 ambiguous N symbols. We used RNAfold (Hofacker et al., 1994) to estimate the mRNA folding energy from base −4 to 37 for each gene, using default parameters. Estimating Ribosomal Interference To identify regions of ribosomal pausing and interference on a transgene sequence, we simulated translation in the cell with a transgene accounting for 50% of the (mRNA) transcriptome. We ran the simulation for 500 s in equilibrium and sampled the state of the system every second. We used the average number of ribosomes bound at each position to quantify the frequency of ribosomal pausing. To quantify the frequency of ribosomal stalling, we calculated the fraction of bound ribosomes at a position that also have another bound ribosome ten codons (positions) ahead on that mRNA in the same time sample. Extended Experimental Procedures Simulation Model We describe protein translation using a discrete-state continuous-time Markov model of initiation, elongation, and termination events in a cell. The model assumes a fixed total number of ribosomes and tRNAs, and it describes how these entities initiate and elongate a fixed supply of mRNAs. Our model neglects the dynamics of transcription, mRNA decay, and co-transcriptional translation; it also neglects the production and decay of ribosomes and tRNAs themselves. These processes are typically slower than the dynamics of translation, and so our model nonetheless provides an accurate description of translation in a cell in most conditions. We assume a genome comprised of n genes, each with a prescribed coding sequence, and each with a fixed abundance A i , of mRNA copies in the cell. Gene i encodes an mRNA of length L i codons; each such codon is assigned one of k possible values (k = 61 in the standard genetic code). Each gene i also has a corresponding probability of translation initiation, denoted p i , which is described below. Corresponding to each type of codon j is one of 41 iso-accepting tRNA species, denoted ϕ ( j ) , which has a fixed total abundance T ϕ ( j ) t in the cell. At any time in our Markov model, each molecule of tRNA species ϕ ( j ) is either free in the cell, or bound, along with a ribosome, to some codon of type j in some mRNA in the cell. Thus, at each time, the total number of tRNAs of type ϕ ( j ) can be decomposed into those that are currently bound and those that are currently free: T ϕ ( j ) t = T ϕ ( j ) b + T ϕ ( j ) f . Likewise, the total number of ribosomes, R t , can be decomposed into bound and free: R t = R b + R f . Moreover, the number of bound ribosomes always equals the total number of bound tRNAs of all species: R b = ∑ k = 1 41 T k b . In our continuous-time Markov model, initiation and elongation events occur at rates that are determined by the current state of system (the number of free ribosomes, and the locations of all bound ribosomes) and by the underlying physical parameters of the cell. The underlying physical parameters are simply the volume of the cell, and the characteristic lengths and diffusion constants of ribosomes and tRNA molecules. The time between subsequent events are exponentially distributed, and Monte Carlo simulations proceed simply by incrementing time according to exponential deviates and re-computing rates of subsequent events (Gillespie, 1977). We provide the model source code, and associated datasets used in the current simulations as a supplement (Data S1). Additionally, the latest version of the code is also made freely available at http://mathbio.sas.upenn.edu/shah-cell-2013-code.tar.gz. Diffusion of Ribosomes and tRNAs We compute initiation and elongation rates by considering the diffusion of ribosome and tRNA molecules in the cell. Assuming a spherical cell of volume V = 4.2 × 10 − 17 m3 (Jorgensen et al., 2002), the number of different discrete positions that can be occupied by any molecule is N = V / λ 3 , where λ is the characteristic length of the molecule. The characteristic lengths of tRNA and ribosomes have been measured as λ t = 1.5 × 10 − 8 m and λ r = 3 × 10 − 8 m, respectively (Nissen et al., 1999; Politz et al., 2003). Thus, the number of available discrete positions for tRNA and ribosome molecules are N t = 1.24 × 10 7 and N r = 1.56 × 10 6 , respectively. The average time required for any given molecule to move from one position in the cell to another, known as the characteristic time τ, is given by (1) τ = λ 2 6 D where D is the diffusion coefficient of the molecule. The diffusion coefficients of tRNAs and ribosomes are known, D t = 8.42 × 10 − 11 m2/s and D r = 3 × 10 − 13 m2/s (Politz et al., 2003; Werner, 2011), and hence their characteristic times are τ t = 4.45 × 10 − 7 s and τ r = 5 × 10 − 4 s, respectively. The characteristic times allow us to compute the rate at which a free ribosome or mRNA molecule reaches any particular position in the cell. In particular, if there are N positions that can be occupied by a molecule, then a given molecule with characteristic time τ will reach a particular position in the cell at rate 1 / τ N . For example, if there are R f free ribosomes, then the rate at which any free ribosome reaches a given mRNA molecule is simply R f / τ N r . Translation Initiation Rates Given the current state of the system (the number of free ribosomes, and the locations of all bound ribosomes), each mRNA of type i will be initiated at rate ρi . The rate ρi is set to zero if any of the first 10 codons of the mRNA is currently bound by a ribosome. Otherwise, the rate is ρ i = p i R f τ N r . The term R f / τ N r in this equation denotes the rate at which any free ribosome diffuses to a given mRNA molecule. And the term p i denotes the initial probability of an mRNA of type i: the chance that a ribosome will actually initiate translation of such an mRNA molecule, once it has diffused to its 5′ end. The parameters p i allow us to account for sequence-specific variation in initiation probabilities among genes (Kudla et al., 2009). Translation Elongation Rates Any given ribosome currently bound to some mRNA will elongate at some rate. Consider a ribosome bound at codon position k on an mRNA. Its rate of elongation is set to zero if any of the following k + 10 codons of the mRNA are currently occupied by another ribosome, because of interference. Otherwise, the rate at which the ribosome elongates the subsequent codon, of type j, depends on the number of free cognate tRNAs for that codon T ϕ ( j ) f and the wobble parameter associated with the tRNA-codon pair w j . If there is a perfect match between the tRNA and the codon, then w j = 1. Else w r y / y r = 0.64 if the mismatch is due to a purine-pyrimidine wobble or w r r / y y = 0.61 if the mismatch is due to purine-purine or pyrimidine-pyrimidine wobble (Curran and Yarus, 1989; Lim and Curran, 2001). The rate at which a cognate tRNA elongates to the codon at position k + 1 is thus given by T ϕ ( j ) f w j τ t N t In addition, during elongation various tRNAs compete for the focal ribosome. The ribosome thus spends a considerable amount of time checking whether a given tRNA in its A-site is in fact a cognate tRNA for the codon it is about to elongate. The time spent by the ribosome in selecting the cognate tRNA depends on the relative abundances of various tRNAs as well as organism specific kinetic rates associated with ribosomal proofreading. Because these kinetic rates are not available for yeast, we use the values obtained in Escherichia coli (Fluitt et al., 2007; Gromadski and Rodnina, 2004). Using these parameters and tRNA abundances in yeast, we used numerical simulations described in Fluitt et al. (2007) to estimate the average time spent by the ribosome in kinetic proofreading to select the correct tRNA. As a result, accounting for tRNA competition coefficient s, the actual elongation rate of a codon is T ϕ ( j ) f w j s τ t N t Translation Termination We assume that translation termination is an instantaneous event that occurs immediately after elongation of the last codon at position L. Upon termination the pool of free ribosomes and free tRNAs corresponding to the codon j′ at position L − 1 each increases by 1 ( R f → R f + 1 ; T ϕ ( j ) ′ f → T ϕ ( j ) ′ f + 1 ) . Analytic Approximation for Steady-State Behavior Whereas we have used the complete stochastic model described above to produce all the simulation figures in the main text, it is convenient to approximate its steady-state behavior by analytical equations, especially for the purpose of inferring gene-specific initiation probabilities from ribosomal profiling data. To do so we derive here an analytic steady-state approximation, based on ordinary differential equations that treat all quantities as continuous variables and are therefore accurate when the molecular quantities are large. This approximation neglects the possibility of ribosomal interference during elongation, and so it is not expected to hold in regimes for which mRNAs are densely packed with ribosomes. We will derive analytic approximations for the steady state elongation times of codons, the amount of free tRNAs, the initiation and total elongation times of all mRNAs, and the steady-state number of free ribosomes in the cell. Consider a cell with a total number of ribosomes R t and n genes each with A i mRNA copies. Assuming no ribosomal interference during translation, the expected number of ribosomes bound to each mRNA can be approximated by solving the differential equation (2) d R i b d t = ρ i − R i b ϵ i where ρi and ϵi are the rates of initiation and total elongation of the i th mRNA, respectively. At steady-state the total number of bound ribosomes is then given by (3) R b = ∑ i = 1 n A i ρ i ϵ i The rates of translation initiation and total elongation in turn depend on the amounts of free ribosomes R f and free tRNAs T f , in addition to the characteristic times of these molecules. We assume that translation termination is instantaneous and does not contribute to the overall rate of translation. Thus the initiation rate on an mRNA can be given as (4) ρ i = R f p i τ r N r where p i is the probability of initiation given that the ribosome has reached the mRNA. p i is sequence-specific and accounts for the variation in initiation rates of various mRNAs. Similarly, when a ribosome is bound to the mRNA, the time taken to elongate codon j depends on the number of the free cognate tRNAs T ϕ ( j ) f , the wobble parameter w j , and the tRNA competition coefficient s: (5) c j = τ t N t T ϕ ( j ) f w j s . Thus at equilibrium, assuming no ribosomal collisions/interference, the expected total elongation rate of a ribosome on an mRNA is (6) ϵ i = 1 ∑ j = 1 k x j c j where x j is the number of codons of type j, and k denotes the total types of codons (typically k = 61). Case 1: One Gene and One Amino Acid with Two Codons Consider a simple case of one gene of length L codons composed of a single amino acid with two types of codons, each translated by a single tRNA type (T 1 or T 2). Let the expression level of the gene be A, relative frequency of codon 1 be u, and the total number of ribosomes in the cell R t . Based on Equation (6), the total elongation rate of that gene is given by (7) ϵ = 1 L ( u c 1 + ( 1 − u ) c 2 ) where c 1 and c 2 are given by Equation (5) (8) c 1 = τ t N t T 1 f w 1 s (9) c 2 = τ t N t T 2 f w 2 s Note that whenever a ribosome is bound to an mRNA waiting for a tRNA corresponding to the codon at its A-site, a tRNA is bound at its P-site attached to the growing polypeptide chain. Assuming that the codons in the gene are randomly distributed, the frequency of tRNA types at ribosomal P-sites are independent of the waiting time for codons in the A-sites. In addition, the total number of bound ribosomes should equal the number of bound tRNAs of all types R b = T 1 b + T 2 b . As a result, the number of bound tRNAs of each type is simply proportional to its codon usage. (10) T 1 b = R b u (11) T 2 b = R b ( 1 − u ) Note that the above relationship works if the number of bound ribosomes R b is less than the ratio of total tRNAs of either type to their codon usage: ( R b 0.9, Spearman correlation, R = 0.997). In addition, we validated that we can reliably infer initiation probabilities from simulated ribosomal profiling data even when gene length and initiation probabilities are positively correlated (Figures S1C and S1D). This result indicates that the negative correlation between gene length and inferred initiation probability observed in the real yeast data is not an artifact of our inference procedure. Correlation between Gene Length and Ribosome Density in Ribosome Profiling Data One of the hallmark features of ribosomal profiling data (Ingolia et al., 2009) is the decrease in ribosome density with increasing codon position. This has been argued to be driven by heterogeneity in ribosome density along each mRNA molecule, with higher densities in the 5′ region of genes due to less optimal codons (Tuller et al., 2010). In order to show that position-specific heterogeneity in ribosome density is not in fact the primary cause of these patterns we used the average ribosomal density of each gene and assumed that this density is spread uniformly across the entire length of the sequence. We then recomputed the transcriptome-wide average ribosome density, by codon position, assuming a uniform density along each mRNA. We found that in the resulting profile, even upon removing position specific heterogeneity for each individual mRNA, we still observed a sharp decrease in average ribosome density with codon position (Figure S3A). In addition, when inspecting the profiling data on a gene-by-gene basis we find that just as many genes exhibit a trend of increasing ribosome density, from 5′ to 3′, as show evidence of decreasing ribosome density (Figure S3B). These analyses of the primary profiling data confirm the conclusions drawn from our simulations of translation: the apparent 5′ ribosome ramp does not actually require a higher density of ribosomes near the 5′ end of each message, but rather it can be explained simply by a greater density of ribosomes on shorter mRNA molecules. Mapping Ribosome Profile Reads to Genes The ribosome profiling reads of Ingolia et al. (2009) and their alignment files were downloaded from GEO under the accession number GSE13750. We compared the mapped positions of the sequencing reads to the S. cerevisiae genome annotation file downloaded from UCSC genome browser ([Karolchik et al., 2003; Dreszer et al., 2012], genome version June 2008 [SGD/sacCer2]). For each coding sequence, we counted the number of reads that were mapped to each codon (we assigned the read to the codon that mapped to its 17th base), as well as the total number of reads mapped to the sequence. To avoid ambiguity we excluded the reads that were mapped to multiple positions across the genome. Comparison with Ribosome Flow Model of Translation The ribosome flow model (Reuveni et al., 2011) describes the translation of an individual mRNA molecule with a fixed rate of initiation and a fixed rate of elongation per codon. By assuming fixed rates of initiation and elongation, the model implicitly assumes a constant, inexhaustible supply of free ribosomes and free tRNAs in the cell. The ribosome flow model describes the translation of each mRNA molecule independently of all other mRNAs, and so the model does not account for competition among mRNAs for free ribosomes or free tRNAs in the cell. In other words, if one mRNA species is highly abundant and densely packed with ribosomes, then this does not limit the pool of available ribosomes to initiate other mRNAs, according to the assumptions of the ribosome flow model. Furthermore, the model predicts that each mRNA is translated close to (93% of) its maximum translation rate (Reuveni et al., 2011; Tuller et al., 2011). As a result, protein translation is generally elongation-limited in the ribosome flow model. This model, which rests on the implicit assumption that free ribosomes are always available, is expected to provide an accurate description of translation in a cell only under conditions in which a very large number of ribosomes are, indeed, free. To make this point explicit, we have calculated the predicted number of ribosomes bound to mRNAs in a yeast cell based on the estimates of average ribosome density obtained under the ribosome flow model (Reuveni et al., 2011). According to the ribosome flow model, the average ribosome density, per 15 codons, ranges from 0.36 to 0.42 for low-expression and high expression genes, respectively (Reuveni et al., 2011). Therefore, assuming an average ribosome density of 0.4 and a total transcriptome size of 2 × 10 7 codons (Zenklusen et al., 2008; Ingolia et al., 2009), the number of bound ribosomes predicted by the ribosome flow model is 2 × 10 7 × 0.4 / 15 = 5.33 × 10 5 . This number greatly exceeds the total number of ribosomes (free or bound) that have been measured in a real yeast cell ( 2 × 10 5 [Warner, 1999; von der Haar, 2008]). As this calculation suggests, the assumptions of the ribosome flow model imply that an unrealistically large number of ribosomes are required to translate all the mRNAs in a yeast cell. In order to compare the ribosome flow model with our whole-cell simulation of translation, we artificially increased the number of ribosomes and tRNAs in our simulations beyond their empirically measured abundances, so that a large supply of them would be free in equilibrium – in accordance with the assumptions of the ribosome flow model. To do so, we increased the number of tRNA molecules 10-fold (chosen so that there would be a large supply of free tRNAs of all species, even in the extreme case of every ribosome bound to a codon in the transcriptome). We also increased the numbers of ribosomes in the cell, ranging from a 2-fold to a 35-fold increase. To find the regime that corresponds to the ribosome flow model we identified the number of ribosomes required so that protein production in the cell is 93% of its maximal capacity (Figure S5A). To achieve this regime requires a 5-fold increase in the number of simulated ribosomes compared to the true, measured number of ribosomes in a yeast cell. In this regime our simulations recover the elongation-limited behavior of the ribosome flow model – but the total number of ribosomes bound to all mRNAs in the resulting simulated cell is about 8 × 10 5 (Figure S5A) in this regime, which again exceeds the measured number of ribosomes in a real yeast cell ( 2 × 10 5 [Warner, 1999; von der Haar, 2008]), by four-fold. Thus, it is possible for our model to recapitulate the behavior of the ribosome flow model – in which ribosomes are inexhaustibly abundant and the translation dynamics of each mRNA can be treated independently – but to do so requires assuming an unrealistic number of cellular ribosomes. In summary, the number of ribosomes required to reconcile our cellular model of translation with the ribosome flow model vastly exceeds the number of ribosomes in a normal yeast cell. Likewise, the number of bound ribosomes in the cell, according to direct estimates of ribosome densities inferred by the ribosome flow model (Reuveni et al., 2011), also exceeds the total number of ribosomes measured in a yeast cell. These calculations suggest that the elongation-limited regime described by the ribosome flow model is not realistic for most endogenous genes in a healthy yeast cell.
scite shows how a scientific paper has been cited by providing the context of the citation, a classification describing whether it supports, mentions, or contrasts the cited claim, and a label indicating in which section the citation was made.