0
views
0
recommends
+1 Recommend
0 collections
    0
    shares
      • Record: found
      • Abstract: found
      • Article: found
      Is Open Access

      Prediction of Cardiovascular Events by Pulse Waveform Parameters: Analysis of CARTaGENE

      research-article

      Read this article at

      Bookmark
          There is no author summary for this article yet. Authors can add summaries to their articles on ScienceOpen to make them more accessible to a non-specialist audience.

          Abstract

          Background

          Waveform parameters provide approximate data about aortic wave reflection. However, their association with cardiovascular events remains controversial and their role in cardiovascular prediction is unknown.

          Methods and Results

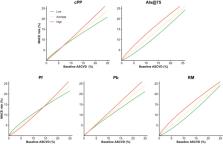
          We analyzed participants aged between 40 and 69 from the population‐based CARTaGENE cohort. Baseline pulse wave analysis (central pulse pressure, augmentation index) and wave separation analysis (forward pressure, backward pressure, reflection magnitude) parameters were derived from radial artery tonometry. Associations between each parameter and major adverse atherosclerotic events (MACE; cardiovascular death, stroke, myocardial infarction) were obtained using adjusted Cox models. The incremental predictive value of each parameter compared with the 10‐year atherosclerotic cardiovascular disease score alone was assessed using hazard ratios, c‐index differences, continuous net reclassification indexes, and integrated discrimination indexes. From 17 561 eligible patients, 2315 patients had a MACE during a median follow‐up of 10.1 years. Central pulse pressure, forward pressure, and backward pressure, but not augmentation index and reflection magnitude, were significantly associated with MACE after full adjustment. All parameters except forward pressure statistically improved MACE prediction compared with the atherosclerotic cardiovascular disease score alone. The greatest prediction improvement was seen with augmentation index and reflection magnitude but remained small in magnitude. These 2 parameters enhanced predictive performance more strongly in patients with low baseline atherosclerotic cardiovascular disease scores. Up to 5.7% of individuals were reclassified into a different risk stratum by adding waveform parameters to atherosclerotic cardiovascular disease scores.

          Conclusions

          Some waveform parameters are independently associated with MACEs in a population‐based cohort. Augmentation index and reflection magnitude slightly improve risk prediction, especially in patients at low cardiovascular risk.

          Related collections

          Most cited references70

          • Record: found
          • Abstract: found
          • Article: not found

          A new equation to estimate glomerular filtration rate.

          Equations to estimate glomerular filtration rate (GFR) are routinely used to assess kidney function. Current equations have limited precision and systematically underestimate measured GFR at higher values. To develop a new estimating equation for GFR: the Chronic Kidney Disease Epidemiology Collaboration (CKD-EPI) equation. Cross-sectional analysis with separate pooled data sets for equation development and validation and a representative sample of the U.S. population for prevalence estimates. Research studies and clinical populations ("studies") with measured GFR and NHANES (National Health and Nutrition Examination Survey), 1999 to 2006. 8254 participants in 10 studies (equation development data set) and 3896 participants in 16 studies (validation data set). Prevalence estimates were based on 16,032 participants in NHANES. GFR, measured as the clearance of exogenous filtration markers (iothalamate in the development data set; iothalamate and other markers in the validation data set), and linear regression to estimate the logarithm of measured GFR from standardized creatinine levels, sex, race, and age. In the validation data set, the CKD-EPI equation performed better than the Modification of Diet in Renal Disease Study equation, especially at higher GFR (P < 0.001 for all subsequent comparisons), with less bias (median difference between measured and estimated GFR, 2.5 vs. 5.5 mL/min per 1.73 m(2)), improved precision (interquartile range [IQR] of the differences, 16.6 vs. 18.3 mL/min per 1.73 m(2)), and greater accuracy (percentage of estimated GFR within 30% of measured GFR, 84.1% vs. 80.6%). In NHANES, the median estimated GFR was 94.5 mL/min per 1.73 m(2) (IQR, 79.7 to 108.1) vs. 85.0 (IQR, 72.9 to 98.5) mL/min per 1.73 m(2), and the prevalence of chronic kidney disease was 11.5% (95% CI, 10.6% to 12.4%) versus 13.1% (CI, 12.1% to 14.0%). The sample contained a limited number of elderly people and racial and ethnic minorities with measured GFR. The CKD-EPI creatinine equation is more accurate than the Modification of Diet in Renal Disease Study equation and could replace it for routine clinical use. National Institute of Diabetes and Digestive and Kidney Diseases.
            Bookmark
            • Record: found
            • Abstract: found
            • Article: found
            Is Open Access

            Global burden of 87 risk factors in 204 countries and territories, 1990–2019: a systematic analysis for the Global Burden of Disease Study 2019

            Summary Background Rigorous analysis of levels and trends in exposure to leading risk factors and quantification of their effect on human health are important to identify where public health is making progress and in which cases current efforts are inadequate. The Global Burden of Diseases, Injuries, and Risk Factors Study (GBD) 2019 provides a standardised and comprehensive assessment of the magnitude of risk factor exposure, relative risk, and attributable burden of disease. Methods GBD 2019 estimated attributable mortality, years of life lost (YLLs), years of life lived with disability (YLDs), and disability-adjusted life-years (DALYs) for 87 risk factors and combinations of risk factors, at the global level, regionally, and for 204 countries and territories. GBD uses a hierarchical list of risk factors so that specific risk factors (eg, sodium intake), and related aggregates (eg, diet quality), are both evaluated. This method has six analytical steps. (1) We included 560 risk–outcome pairs that met criteria for convincing or probable evidence on the basis of research studies. 12 risk–outcome pairs included in GBD 2017 no longer met inclusion criteria and 47 risk–outcome pairs for risks already included in GBD 2017 were added based on new evidence. (2) Relative risks were estimated as a function of exposure based on published systematic reviews, 81 systematic reviews done for GBD 2019, and meta-regression. (3) Levels of exposure in each age-sex-location-year included in the study were estimated based on all available data sources using spatiotemporal Gaussian process regression, DisMod-MR 2.1, a Bayesian meta-regression method, or alternative methods. (4) We determined, from published trials or cohort studies, the level of exposure associated with minimum risk, called the theoretical minimum risk exposure level. (5) Attributable deaths, YLLs, YLDs, and DALYs were computed by multiplying population attributable fractions (PAFs) by the relevant outcome quantity for each age-sex-location-year. (6) PAFs and attributable burden for combinations of risk factors were estimated taking into account mediation of different risk factors through other risk factors. Across all six analytical steps, 30 652 distinct data sources were used in the analysis. Uncertainty in each step of the analysis was propagated into the final estimates of attributable burden. Exposure levels for dichotomous, polytomous, and continuous risk factors were summarised with use of the summary exposure value to facilitate comparisons over time, across location, and across risks. Because the entire time series from 1990 to 2019 has been re-estimated with use of consistent data and methods, these results supersede previously published GBD estimates of attributable burden. Findings The largest declines in risk exposure from 2010 to 2019 were among a set of risks that are strongly linked to social and economic development, including household air pollution; unsafe water, sanitation, and handwashing; and child growth failure. Global declines also occurred for tobacco smoking and lead exposure. The largest increases in risk exposure were for ambient particulate matter pollution, drug use, high fasting plasma glucose, and high body-mass index. In 2019, the leading Level 2 risk factor globally for attributable deaths was high systolic blood pressure, which accounted for 10·8 million (95% uncertainty interval [UI] 9·51–12·1) deaths (19·2% [16·9–21·3] of all deaths in 2019), followed by tobacco (smoked, second-hand, and chewing), which accounted for 8·71 million (8·12–9·31) deaths (15·4% [14·6–16·2] of all deaths in 2019). The leading Level 2 risk factor for attributable DALYs globally in 2019 was child and maternal malnutrition, which largely affects health in the youngest age groups and accounted for 295 million (253–350) DALYs (11·6% [10·3–13·1] of all global DALYs that year). The risk factor burden varied considerably in 2019 between age groups and locations. Among children aged 0–9 years, the three leading detailed risk factors for attributable DALYs were all related to malnutrition. Iron deficiency was the leading risk factor for those aged 10–24 years, alcohol use for those aged 25–49 years, and high systolic blood pressure for those aged 50–74 years and 75 years and older. Interpretation Overall, the record for reducing exposure to harmful risks over the past three decades is poor. Success with reducing smoking and lead exposure through regulatory policy might point the way for a stronger role for public policy on other risks in addition to continued efforts to provide information on risk factor harm to the general public. Funding Bill & Melinda Gates Foundation.
              Bookmark
              • Record: found
              • Abstract: found
              • Article: not found

              2019 ACC/AHA Guideline on the Primary Prevention of Cardiovascular Disease

              Circulation
                Bookmark

                Author and article information

                Contributors
                remi.goupil@umontreal.ca
                Journal
                J Am Heart Assoc
                J Am Heart Assoc
                10.1002/(ISSN)2047-9980
                JAH3
                ahaoa
                Journal of the American Heart Association: Cardiovascular and Cerebrovascular Disease
                John Wiley and Sons Inc. (Hoboken )
                2047-9980
                03 September 2022
                06 September 2022
                : 11
                : 17 ( doiID: 10.1002/jah3.v11.17 )
                : e026603
                Affiliations
                [ 1 ] Department of Medicine Université de Montréal Montreal Canada
                [ 2 ] Hôpital du Sacré‐Coeur de Montréal Research Center Montreal Canada
                [ 3 ] Hôpital Maisonneuve‐Rosemont Université de Montréal Montréal Canada
                [ 4 ] AIT Austrian Institute of Technology Vienna Austria
                [ 5 ] Department of Medicine Université Laval Quebec City Canada
                [ 6 ] CHU de Quebec Université Laval Quebec City Canada
                Author notes
                [*] [* ]Correspondence to: Rémi Goupil, MD, MSc, Hôpital du Sacré‐Cœur de Montréal, 5400 Boul. Gouin, Montreal (Quebec) H4J 1C5, Canada. Email: remi.goupil@ 123456umontreal.ca
                Author information
                https://orcid.org/0000-0002-6475-5336
                https://orcid.org/0000-0003-2048-1019
                https://orcid.org/0000-0002-0098-3735
                Article
                JAH37801 JAHA/2022/026603
                10.1161/JAHA.122.026603
                9496446
                36056725
                e0b181e0-b577-4fcd-9e72-8e52ba75ae0f
                © 2022 The Authors. Published on behalf of the American Heart Association, Inc., by Wiley.

                This is an open access article under the terms of the http://creativecommons.org/licenses/by-nc-nd/4.0/ License, which permits use and distribution in any medium, provided the original work is properly cited, the use is non‐commercial and no modifications or adaptations are made.

                History
                : 26 April 2022
                : 01 August 2022
                Page count
                Figures: 3, Tables: 3, Pages: 12, Words: 8074
                Funding
                Funded by: Heart & Stroke Foundation , doi 10.13039/100004411;
                Award ID: G‐20‐0028656
                Funded by: Canadian Institutes of Health Research , doi 10.13039/501100000024;
                Award ID: 173313
                Categories
                Original Research
                Original Research
                Hypertension
                Custom metadata
                2.0
                06 September 2022
                Converter:WILEY_ML3GV2_TO_JATSPMC version:6.1.8 mode:remove_FC converted:15.09.2022

                Cardiovascular Medicine
                cardiovascular prediction,central pressure,pulse wave analysis,wave separation analysis,cardiovascular disease,hemodynamics

                Comments

                Comment on this article