3
views
0
recommends
+1 Recommend
0 collections
    0
    shares
      • Record: found
      • Abstract: found
      • Article: found
      Is Open Access

      Single-blind validation of space-based point-source detection and quantification of onshore methane emissions

      research-article

      Read this article at

      Bookmark
          There is no author summary for this article yet. Authors can add summaries to their articles on ScienceOpen to make them more accessible to a non-specialist audience.

          Abstract

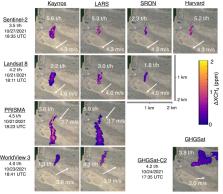
          Satellites are increasingly seen as a tool for identifying large greenhouse gas point sources for mitigation, but independent verification of satellite performance is needed for acceptance and use by policy makers and stakeholders. We conduct to our knowledge the first single-blind controlled methane release testing of satellite-based methane emissions detection and quantification, with five independent teams analyzing data from one to five satellites each for this desert-based test. Teams correctly identified 71% of all emissions, ranging from 0.20 [0.19, 0.21] metric tons per hour (t/h) to 7.2 [6.8, 7.6] t/h. Three-quarters (75%) of quantified estimates fell within ± 50% of the metered value, comparable to airplane-based remote sensing technologies. The relatively wide-area Sentinel-2 and Landsat 8 satellites detected emissions as low as 1.4 [1.3, 1.5, 95% confidence interval] t/h, while GHGSat’s targeted system quantified a 0.20 [0.19, 0.21] t/h emission to within 13%. While the fraction of global methane emissions detectable by satellite remains unknown, we estimate that satellite networks could see 19–89% of total oil and natural gas system emissions detected in a recent survey of a high-emitting region.

          Related collections

          Most cited references28

          • Record: found
          • Abstract: not found
          • Article: not found

          Unified equations for the slope, intercept, and standard errors of the best straight line

            Bookmark
            • Record: found
            • Abstract: not found
            • Article: not found
            Is Open Access

            The HITRAN2020 molecular spectroscopic database

              Bookmark
              • Record: found
              • Abstract: found
              • Article: not found
              Is Open Access

              Quantifying methane point sources from fine-scale satellite observations of atmospheric methane plumes

              Abstract. Anthropogenic methane emissions originate from a large number of relatively small point sources. The planned GHGSat satellite fleet aims to quantify emissions from individual point sources by measuring methane column plumes over selected ∼ 10 × 10 km 2 domains with ≤ 50 × 50 m 2 pixel resolution and 1 %–5 % measurement precision. Here we develop algorithms for retrieving point source rates from such measurements. We simulate a large ensemble of instantaneous methane column plumes at 50×50 m 2 pixel resolution for a range of atmospheric conditions using the Weather Research and Forecasting model (WRF) in large eddy simulation (LES) mode and adding instrument noise. We show that standard methods to infer source rates by Gaussian plume inversion or source pixel mass balance are prone to large errors because the turbulence cannot be properly parameterized on the small scale of instantaneous methane plumes. The integrated mass enhancement (IME) method, which relates total plume mass to source rate, and the cross-sectional flux method, which infers source rate from fluxes across plume transects, are better adapted to the problem. We show that the IME method with local measurements of the 10 m wind speed can infer source rates with an error of 0.07–0.17 t h - 1 + 5 %–12 % depending on instrument precision (1 %–5 %). The cross-sectional flux method has slightly larger errors (0.07–0.26 t h - 1 + 8 %–12 %) but a simpler physical basis. For comparison, point sources larger than 0.3 t h −1 contribute more than 75 % of methane emissions reported to the US Greenhouse Gas Reporting Program. Additional error applies if local wind speed measurements are not available and may dominate the overall error at low wind speeds. Low winds are beneficial for source detection but detrimental for source quantification.
                Bookmark

                Author and article information

                Contributors
                evands@stanford.edu
                Journal
                Sci Rep
                Sci Rep
                Scientific Reports
                Nature Publishing Group UK (London )
                2045-2322
                7 March 2023
                7 March 2023
                2023
                : 13
                : 3836
                Affiliations
                [1 ]GRID grid.168010.e, ISNI 0000000419368956, Department of Energy Science & Engineering, , Stanford University, ; Stanford, CA 94305 USA
                [2 ]GRID grid.421234.2, ISNI 0000 0004 1112 1641, ExxonMobil Upstream Research Company, ; Spring, TX 77389 USA
                [3 ]GRID grid.214458.e, ISNI 0000000086837370, Climate and Space Sciences and Engineering, , University of Michigan, ; Ann Arbor, MI 48109 USA
                [4 ]GRID grid.168010.e, ISNI 0000000419368956, Earth System Science, Woods Institute for the Environment and Precourt Institute for Energy, , Stanford University, ; Stanford, CA 94305 USA
                Author information
                https://orcid.org/0000-0003-2180-4297
                https://orcid.org/0000-0003-1666-4162
                https://orcid.org/0000-0002-4341-2414
                https://orcid.org/0000-0003-4940-7541
                https://orcid.org/0000-0001-9898-5546
                https://orcid.org/0000-0002-2528-1473
                Article
                30761
                10.1038/s41598-023-30761-2
                9992358
                36882586
                da8c4bcc-8cc7-4b83-9f2d-96ba9665563e
                © The Author(s) 2023

                Open Access This article is licensed under a Creative Commons Attribution 4.0 International License, which permits use, sharing, adaptation, distribution and reproduction in any medium or format, as long as you give appropriate credit to the original author(s) and the source, provide a link to the Creative Commons licence, and indicate if changes were made. The images or other third party material in this article are included in the article's Creative Commons licence, unless indicated otherwise in a credit line to the material. If material is not included in the article's Creative Commons licence and your intended use is not permitted by statutory regulation or exceeds the permitted use, you will need to obtain permission directly from the copyright holder. To view a copy of this licence, visit http://creativecommons.org/licenses/by/4.0/.

                History
                : 11 August 2022
                : 28 February 2023
                Funding
                Funded by: FundRef http://dx.doi.org/10.13039/100006584, ExxonMobil Research and Engineering Company;
                Funded by: Stanford Strategic Energy Alliance
                Funded by: Stanford Natural Gas Initiative
                Categories
                Article
                Custom metadata
                © The Author(s) 2023

                Uncategorized
                environmental impact,natural gas,energy infrastructure
                Uncategorized
                environmental impact, natural gas, energy infrastructure

                Comments

                Comment on this article