1
views
0
recommends
+1 Recommend
0 collections
    0
    shares
      • Record: found
      • Abstract: found
      • Article: found
      Is Open Access

      Small area variation in severe, moderate, and mild anemia among women and children: A multilevel analysis of 707 districts in India

      research-article

      Read this article at

      Bookmark
          There is no author summary for this article yet. Authors can add summaries to their articles on ScienceOpen to make them more accessible to a non-specialist audience.

          Abstract

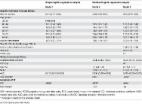
          India is home to the highest global number of women and children suffering from anemia, with one in every two women impacted. India's current strategy for targeting areas with a high anemia burden is based on district-level averages, yet this fails to capture the substantial small area variation in micro-geographical (small area) units such as villages. We conducted statistical and econometric analyses to quantify the extent of small area variation in the three grades of anemia (severe, moderate, and mild) among women and children across 36 states/union territories and 707 districts of India. We utilized data from the fifth round of the National Family Health Survey conducted in 2019–21. The final analytic sample for analyses was 183,883 children aged 6–59 months and 690,153 women aged 15–49 years. The primary outcome variable for the analysis was the three anemia grades among women and children. We adopted a three-level and four-level logistic regression model to compute variance partitioning of anemia among women and children. We also computed precision-weighted prevalence estimates of women and childhood anemia across 707 districts and within-district, between-cluster variation using standard deviation (SD). For severe anemia among women, small area (villages or urban blocks) account for highest share (46.1%; Var: 0.494; SE: 0.150) in total variation followed by states (39.4%; Var: 0.422; SE: 0.134) and districts (12.8%; Var: 0.156; SE: 0.012). Similarly, clusters account for the highest share in the variation in severe (61.3%; Var: 0.899; SE: 0.069) and moderate (46.4%: Var: 0.398; SE: 0.011) anemia among children. For mild and moderate anemia among women, however, states were the highest source of variation. Additionally, we found a high and positive correlation between mean prevalence and inter-cluster SD of moderate and severe anemia among women and children. In contrast, the correlation was weaker for mild anemia among women ( r = 0.61) and children (0.66). In this analysis, we are positing the critical importance of small area variation within districts when designing strategies for targeting high burden areas for anemia interventions.

          Related collections

          Most cited references36

          • Record: found
          • Abstract: found
          • Article: not found

          Worldwide prevalence of anaemia, WHO Vitamin and Mineral Nutrition Information System, 1993-2005.

          To provide current global and regional estimates of anaemia prevalence and number of persons affected in the total population and by population subgroup. We used anaemia prevalence data from the WHO Vitamin and Mineral Nutrition Information System for 1993-2005 to generate anaemia prevalence estimates for countries with data representative at the national level or at the first administrative level that is below the national level. For countries without eligible data, we employed regression-based estimates, which used the UN Human Development Index (HDI) and other health indicators. We combined country estimates, weighted by their population, to estimate anaemia prevalence at the global level, by UN Regions and by category of human development. Survey data covered 48.8 % of the global population, 76.1 % of preschool-aged children, 69.0 % of pregnant women and 73.5 % of non-pregnant women. The estimated global anaemia prevalence is 24.8 % (95 % CI 22.9, 26.7 %), affecting 1.62 billion people (95 % CI 1.50, 1.74 billion). Estimated anaemia prevalence is 47.4 % (95 % CI 45.7, 49.1 %) in preschool-aged children, 41.8 % (95 % CI 39.9, 43.8 %) in pregnant women and 30.2 % (95 % CI 28.7, 31.6 %) in non-pregnant women. In numbers, 293 million (95 % CI 282, 303 million) preschool-aged children, 56 million (95 % CI 54, 59 million) pregnant women and 468 million (95 % CI 446, 491 million) non-pregnant women are affected. Anaemia affects one-quarter of the world's population and is concentrated in preschool-aged children and women, making it a global public health problem. Data on relative contributions of causal factors are lacking, however, which makes it difficult to effectively address the problem.
            Bookmark
            • Record: found
            • Abstract: found
            • Article: found
            Is Open Access

            An Original Stepwise Multilevel Logistic Regression Analysis of Discriminatory Accuracy: The Case of Neighbourhoods and Health

            Background and Aim Many multilevel logistic regression analyses of “neighbourhood and health” focus on interpreting measures of associations (e.g., odds ratio, OR). In contrast, multilevel analysis of variance is rarely considered. We propose an original stepwise analytical approach that distinguishes between “specific” (measures of association) and “general” (measures of variance) contextual effects. Performing two empirical examples we illustrate the methodology, interpret the results and discuss the implications of this kind of analysis in public health. Methods We analyse 43,291 individuals residing in 218 neighbourhoods in the city of Malmö, Sweden in 2006. We study two individual outcomes (psychotropic drug use and choice of private vs. public general practitioner, GP) for which the relative importance of neighbourhood as a source of individual variation differs substantially. In Step 1 of the analysis, we evaluate the OR and the area under the receiver operating characteristic (AUC) curve for individual-level covariates (i.e., age, sex and individual low income). In Step 2, we assess general contextual effects using the AUC. Finally, in Step 3 the OR for a specific neighbourhood characteristic (i.e., neighbourhood income) is interpreted jointly with the proportional change in variance (i.e., PCV) and the proportion of ORs in the opposite direction (POOR) statistics. Results For both outcomes, information on individual characteristics (Step 1) provide a low discriminatory accuracy (AUC = 0.616 for psychotropic drugs; = 0.600 for choosing a private GP). Accounting for neighbourhood of residence (Step 2) only improved the AUC for choosing a private GP (+0.295 units). High neighbourhood income (Step 3) was strongly associated to choosing a private GP (OR = 3.50) but the PCV was only 11% and the POOR 33%. Conclusion Applying an innovative stepwise multilevel analysis, we observed that, in Malmö, the neighbourhood context per se had a negligible influence on individual use of psychotropic drugs, but appears to strongly condition individual choice of a private GP. However, the latter was only modestly explained by the socioeconomic circumstances of the neighbourhoods. Our analyses are based on real data and provide useful information for understanding neighbourhood level influences in general and on individual use of psychotropic drugs and choice of GP in particular. However, our primary aim is to illustrate how to perform and interpret a multilevel analysis of individual heterogeneity in social epidemiology and public health. Our study shows that neighbourhood “effects” are not properly quantified by reporting differences between neighbourhood averages but rather by measuring the share of the individual heterogeneity that exists at the neighbourhood level.
              Bookmark
              • Record: found
              • Abstract: not found
              • Book: not found

              Transforming our world: The 2030 agenda for sustainable development

                Bookmark

                Author and article information

                Contributors
                Journal
                Front Public Health
                Front Public Health
                Front. Public Health
                Frontiers in Public Health
                Frontiers Media S.A.
                2296-2565
                20 September 2022
                2022
                : 10
                : 945970
                Affiliations
                [1] 1Interdisciplinary Program in Precision Public Health, Department of Public Health Sciences, Graduate School of Korea University , Seoul, South Korea
                [2] 2Department of Economics, FLAME University , Pune, India
                [3] 3Turner Fenton Secondary School , Brampton, ON, Canada
                [4] 4Korea University Research and Business Foundation , Seoul, South Korea
                [5] 5Division of Health Policy and Management, College of Health Science, Korea University , Seoul, South Korea
                [6] 6Harvard Center for Population and Development Studies , Cambridge, MA, United States
                [7] 7Department of Social and Behavioral Sciences, Harvard T.H. Chan School of Public Health , Boston, MA, United States
                Author notes

                Edited by: Bijaya Kumar Padhi, Post Graduate Institute of Medical Education and Research (PGIMER), India

                Reviewed by: Shailaja Patil, BLDE University, India; Sreya Pradhan, Public Health Foundation of India, India

                *Correspondence: Rockli Kim rocklikim@ 123456korea.ac.kr

                This article was submitted to Public Health Policy, a section of the journal Frontiers in Public Health

                Article
                10.3389/fpubh.2022.945970
                9530333
                36203697
                d9e34125-95e4-459b-b887-fba31b1bd220
                Copyright © 2022 Rajpal, Kumar, Rana, Kim and Subramanian.

                This is an open-access article distributed under the terms of the Creative Commons Attribution License (CC BY). The use, distribution or reproduction in other forums is permitted, provided the original author(s) and the copyright owner(s) are credited and that the original publication in this journal is cited, in accordance with accepted academic practice. No use, distribution or reproduction is permitted which does not comply with these terms.

                History
                : 17 May 2022
                : 23 August 2022
                Page count
                Figures: 7, Tables: 0, Equations: 0, References: 37, Pages: 13, Words: 6312
                Funding
                Funded by: Bill and Melinda Gates Foundation, doi 10.13039/100000865;
                Categories
                Public Health
                Original Research

                anemia,small area variation,multilevel modeling,nutrition,india

                Comments

                Comment on this article