- Record: found
- Abstract: found
- Article: found
OMIP 076: High‐dimensional immunophenotyping of murine T‐cell, B‐cell, and antibody secreting cell subsets
research-article
Read this article at
There is no author summary for this article yet. Authors can add summaries to their articles on ScienceOpen to make them more accessible to a non-specialist audience.
Abstract
1
PURPOSE AND APPROPRIATE SAMPLE TYPES
This 19‐parameter, 18‐color flow cytometry panel was designed and optimized to enable
the comprehensive and simultaneous immunophenotyping of distinct T‐cell, B‐cell, and
antibody secreting cell (ASC) subsets within murine tissues (Table 1). Cellular populations
identified by using this OMIP include two major subsets of B‐cells (memory and activated),
two ASC subsets (plasma cells and plasmablasts), and seven major subsets of CD4+ T‐cells
(naïve, central memory, effector memory, helper, regulatory, follicular helper, and
follicular regulatory). Staining was performed on freshly isolated splenocytes from
21‐day‐old BALB/c mice, however, due to the omission of mouse strain‐specific markers,
this OMIP can be implemented across a range of murine models where in‐depth immunophenotyping
of the diverse repertoire of T‐cell, B‐cell, and ASC populations is required.
TABLE 1
Summary table
Purpose
Comprehensive immunophenotyping of T‐cell, B‐cell, and ASC subsets
Species
Mouse
Cell types
Murine tissues containing lymphocyte populations
Cross‐reference
OMIP‐031, OMIP‐032, OMIP‐054, OMIP‐061
2
BACKGROUND
There is now considerable evidence demonstrating that both prenatal and postnatal
exposure to particular classes of microbial stimuli can provide beneficial signals
during early life immune development, resulting in the protection against future inflammatory
disease [1, 2, 3]. The principal target of this beneficial immunostimulation appears
to be the innate immune system [4, 5], and the mechanisms driving protection underlay
the paradigm of innate immune training, whereby certain classes of microbial stimuli
can alter the functional state of innate immune cells, leading to the optimization
of immunocompetence [6]. Immune training focuses on the phenotypic and transcriptional
profiles of several prototypical innate populations [6, 7], however, the characterization
of downstream adaptive responses associated with protection via innate immune training
are of critical importance for understanding disease pathogenesis, and the potential
for therapeutic mitigation. Due to this gap in our current understanding, the broader
protective mechanisms remain incompletely understood. To address this requirement,
we have developed and optimized a novel 19‐parameter flow cytometry panel to comprehensively
and simultaneously characterize distinct T‐cell, B‐cell, and ASC subsets localized
within tissues of BALB/c mice in response to immune training during early life.
The developmental phase of this flow cytometry panel involved the prioritization of
T‐cell, B‐cell, and ASC subsets central to the maintenance of immunological homeostasis,
as based on the current literature and forerunner studies. As such, a degree of emphasis
was placed on effector, regulatory, and memory subsets within T‐cell and B‐cell populations.
In regard to T‐cells, the conversion of peripheral naïve CD4+ T‐cells to effector
T (Teff) cells is denoted by upregulation of the activation marker CD25, while concomitant
upregulation of both CD25 and intracellular Foxp3 expression is essential for the
peripheral induction of regulatory T‐cells (Treg) [8], a process previously recognized
in the protection against allergic airways inflammation following microbial‐derived
immunomodulation [9, 10]. Furthermore, the expression of CD44 on Treg has been implicated
in promoting enhanced function [11, 12], while inducible costimulator (ICOS)+ Tregs
are recognized to have superior suppressive capacity and interleukin (IL)‐10 production
compared to ICOS− Tregs [13, 14]. Following activation and contraction, CD4+ T‐cells
transition toward a memory phenotype via the gradual upregulation of CD44 expression
in parallel with transient expression of CD62L, driving the establishment of a dynamic
repository of central memory (TCM) and effector memory (TEM) T‐cells [15, 16, 17].
In addition to establishing peripheral memory, activated CD4+ T‐cells have the capacity
to upregulate extracellular expression of CXCR5, ICOS, and programmed cell death protein
1 (PD‐1) [18, 19], resulting in the generation of a highly specialized population
of T follicular helper (TFH) cells required for the formation of germinal centers
within secondary lymphoid organs, while also providing crucial survival signals to
support high‐affinity B‐cells during affinity maturation and proliferation [20, 21].
A separate subset of thymic‐derived cells that share homology with the TFH phenotype
in addition to Foxp3 and bimodal CD25 expression, termed follicular regulatory T (TFR)
cells, have also been identified, however, this subset has been attributed to the
inhibition of TFH activity and subsequent generation of humoral immunity [22, 23].
The immunophenotypic characterization of B‐cell and ASC subsets for this OMIP was
centered around the classic expression of CD19 and B220. To maximize the capacity
of a 5‐laser BD LSRFortessa™, CD19 (B‐cell and ASC subsets) and CD4 (T‐cell) antibodies
were conjugated to the same fluorochrome, since co‐expression is essentially absent
in single‐cell analysis. Within secondary lymphoid tissues, the antigen‐specific activation
of B‐cells involves the constitutive upregulation of major histocompatibility complex
class‐II (MHC class II; mouse I‐A/I‐E) and CD80 expression, in conjunction with the
membrane‐bound expression of both immunoglobulin (Ig) M and IgD [24, 25, 26]. Following
antigen‐specific activation, B‐cells upregulate Synd‐1 expression and differentiate
into the two major classes of ASC; the rapidly produced and short‐lived plasmablasts
and the short‐lived peripheral plasma cells, both of which have the capacity to secrete
IgM [27, 28, 29, 30]. A major difference between these two antibody‐secreting subsets,
however, is the absence of classic mature B‐cell markers CD19, B220, and MHC‐II on
plasma cells [28, 31]. The eventual transition of B‐cells toward a memory phenotype
results in the loss of Synd‐1 expression with parallel upregulation of programmed
cell death protein 1 ligand 2 (PD‐L2), generating a long‐lived secondary lymphoid
population expressing IgM +/− IgD that can rapidly differentiate into ASC upon re‐stimulation
[32, 33, 34, 35, 36].
Panel optimization was performed on a BD LSRFortessa™, with all fluorochrome‐conjugated
antibodies (Table 2) titrated during the optimization phase (Figure S1). Prior to
multicolor extracellular staining, splenocytes were incubated in Fc Block™ (Purified
recombinant CD16/32) to inhibit non‐antigen‐specific binding of fluorochrome‐conjugated
antibodies to the nonpolymorphic epitope of FcγIII (CD16) and FcγII (CD32) receptors
expressed on multiple myeloid populations and B‐cells. A representative gating strategy
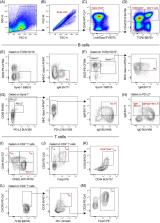
to delineate the T‐cell, B‐cell, and ASC subsets described above is detailed in Figure 1.
Briefly, splenocytes were first gated on side‐scatter (SSC) and forward‐scatter (FSC)
parameters (Figure 1A) to remove sample debris, followed by single‐cell gating (Figure 1B)
to remove doublets. Gating was then performed on viable CD45+ cells (Figure 1C) to
remove dead/dying cells and stromal cells from the analysis. The primary T‐cell/B‐cell/ASC
separation involved delineation of TCRβ and CD4/CD19 expression (Figure 1D). Double
positive cells were classified as CD4+ T‐cells, as CD19+ B‐cells and ASC subsets will
be present within the TCRβ− population (Figure 1D) due to the absence of TCRβ/CD19
co‐expression (Figure S2A). An additional TCRβ−CD4/CD19− gate was included to enable
the characterization of B220−Synd‐1+MHC class II−IgM+ plasma cells (PC; Figure 1E).
CD19+ B‐cells and ASC subsets were then defined as B220lo/+Synd‐1+MHC class II+IgM+
plasmablasts (PB; Figure 1F), B220+Synd‐1−CD80+PD‐L2−MHC class II+IgM+IgD+ activated
B‐cells (Figure 1G) and B220+Synd‐1−CD80+PD‐L2+IgM+IgD+/− memory B‐cells (Figure 1H).
CD4+ T‐cells were defined as CD62L+CD44lo/− naïve T‐cells (Figure 1I), CD62L+CD44hi
TCM (Figure 1I), CD62L−CD44hi TEM (Figure 1I), CD25+Foxp3− Teff (Figure 1J), CD25+Foxp3+
Treg (Figure 1J) ICOS+CD44+ Treg (Figure 1K), CXCR5+ICOS+PD‐1+ TFH (Figure 1L), and
CXCR5+ICOS+PD‐1+CD25+/‐Foxp3+ TFR (Figure 1M).
TABLE 2
Reagents used for OMIP
Specificity
Fluorochrome
Clone
Purpose
PD‐L2 (CD273)
BUV395
TY25
Memory B‐cells
IgD
BUV496
AMS 9.1
Activated/memory B‐cells
CD44
BUV737
IM7
T‐cell subsets
ICOS (CD278)
BV421
7E.17G9
T Follicular helper/Treg
PD‐1 (CD279)
BV480
J43
T Follicular helper cells
Live/Dead
FVS575
N/A
Viable cells
CD80
BV650
16‐10A1
Activated B‐cells
IgM
BV711
R6.60.2
B‐cell/ASC subsets
CD4
BV786
RM4‐5
CD4+ T‐cells
CD19
BV786
1D3
B‐cell subsets
Synd‐1 (CD138)
BB515
281‐2
Plasmablasts/Plasma cells
TCRβ
BB700
H57‐597
Pan T‐cells
Foxp3
PE
FJK‐16s
Regulatory T‐cells
B220 (CD45R)
PE‐CF594
RA3‐6B2
B‐cell subsets
CD25
PE‐Cy5
PC61
Activated T‐cells
CXCR5 (CD185)
PE‐Cy7
2G8
T Follicular helper cells
MHC class II (I‐A/I‐E)
AF647
M5/114.15.2
B‐cell subsets
CD62L
APC‐R700
MEL‐14
T‐cell subsets
CD45
APC‐Cy7
30‐F11
Pan leukocyte
FIGURE 1
Overview of 19‐parameter gating strategy developed for the characterization of T‐cell,
B‐cell, and ASC subsets within freshly isolated splenocytes from 21‐day‐old BALB/c
mice. 1 × 10⁶ splenocytes were incubated in Fc Block™, followed by fixable viability
stain (FVS) and a 17‐parameter extracellular antibody cocktail containing 10% brilliant
stain buffer plus (BD biosciences). Intracellular staining was performed following
fixation‐permeabilization of extracellular stained splenocytes. Data were acquired
on a BD LSRFortessa™ (BD Biosciences). (A–C) Removal of cellular debris, doublets,
nonviable cells and stromal cells. (D) Primary delineation of TCRβ−CD19+, TCRβ+CD4+,
and TCRβ−CD4/CD19− cells. (E–M) Characterization of (E) plasma cells, (F) plasmablasts,
(G) activated B‐cells, (H) memory B‐cells, (I) naïve, effector memory and central
memory T‐cells, (J) effector and regulatory T‐cells, (K) ICOS+CD44+ Treg, (L) T follicular
helper cells, and (M) follicular regulatory T‐cells. All plots are representative
of individual samples. Manual gating was determined using fluorescence minus one (FMO)
controls where necessary (Figure S4) [Color figure can be viewed at wileyonlinelibrary.com]
To perform high‐dimensional analysis on 21‐day‐old naïve splenocytes, viable CD45+
cells (Figure 1C) underwent high‐resolution FlowSOM clustering to define cell populations,
followed by metaclustering for visualization with Uniform Manifold Approximation and
Projection (UMAP) [37] using the Cytometry Data Analysis Tool (CATALYST) pipeline
[38, 39]. Primary unsupervised analysis was performed to identify CD4+ T‐cell and
B‐cell/ASC clusters based on extracellular receptor co‐expression (Figure S3A). CD4+
T‐cell (Figure S3B), and B‐cell/ASC (Figure S3C) clusters were then isolated for secondary
subset analysis.
3
SIMILARITIES TO OTHER OMIPS
The OMIP described here shares a small degree of marker similarity (TCRβ, CD4, CD44,
CD62L, PD‐1, CD19, B220) with OMIP‐031 [40], OMIP‐032 [41], and OMIP‐061 [42], which
are focused on immunologic checkpoint expression on murine T‐cell subsets, the characterization
of innate and adaptive populations within the murine mammary gland and murine antigen‐presenting
cells, respectively. While both OMIP‐031 and OMIP‐032 characterize TCRβ+CD4+ effector
and memory T‐cell subsets based on a combination of CD44 and/or CD62L expression,
OMIP‐032 employs an additional CD19+ gate to delineate B‐cells. OMIP‐061 utilized
B220 to identify B‐cells. A distinct difference between these OMIPs and the OMIP described
here is that our panel was developed for the sole purpose of comprehensively immunophenotyping
T‐cell, B‐cell, and ASC subsets simultaneously, and we therefore include an additional
12 markers to allow the characterization of two major B‐cell, two ASC and seven major
T‐cell populations within a single sample. The OMIP described here also exhibits minor
overlap with OMIP‐054 [43], however, our panel was developed to maximize the potential
of a 5‐laser BD LSRFortessa™ in facilities without the capacity to perform mass cytometry.
AUTHOR CONTRIBUTIONS
Kyle Mincham: Conceptualization; data curation; formal analysis; funding acquisition;
investigation; methodology; validation; visualization; writing‐original draft; writing‐review
& editing. Jacob Young: Data curation; formal analysis; investigation; validation;
writing‐original draft. Deborah Strickland: Conceptualization; formal analysis; funding
acquisition; investigation; methodology; project administration; writing‐original
draft; writing‐review & editing.
CONFLICT OF INTEREST
The authors declare no conflict of interest exists.
Supporting information
Table S1 Instrument Optical Configuration
Table S2. Reagents used in the final OMIP
Table S3. Reagents used
Table S4. Extracellular multicolor antibody staining cocktail for 1x sample
Figure S1. Titrations of each individual component used in the final OMIP. All antibodies
were individually titrated on splenocytes from naïve 21‐day‐old BALB/c mice. Data
are splenocytes pre‐gated to remove debris (SSC/FSC) and doublets.
Figure S2. Absence of TCRβ and CD19 coexpression. (A) TCRβ BB700 and CD19 BV786 staining
in the absence of sentinel CD4 BV786 staining (CD4 BV786 FMO), demonstrating the absence
of TCRβ and CD19 coexpression. (B) TCRβ BB700 and CD4 BV786 staining in the absence
of sentinel CD19 BV786 staining (CD19 BV786 FMO), demonstrating the presence of a
minor population of CD4+ non‐T‐cells within 21‐day‐old spleens. Population proportions
downstream of TCRβ−CD4+ gate = % of TCRβ−CD4+ cells. Data are splenocytes stained
for FVS575 BV605, CD45 APC‐Cy7, TCRβ BB700 and CD19 BV786 or CD4 BV786.
Figure S3. High‐dimensional analysis of CD45
+
splenocytes. Dimensionality reduction and clustering by UMAP demonstrating (A) distribution
of TCRβ, CD4/19 and B220 expression on viable CD45+ splenocytes, (B) CD4+ T‐cell and
(C) B‐cell/ASC clusters. Dimensionality reduction and UMAP visualization was performed
using 12,000 total splenocytes from 8 individual 21‐day‐old naïve BALB/c mice (1500
cells per sample).
Figure S4. Fluorescence Minus One (FMO) controls. Data are splenocytes showing terminal
population gates and intermediate gates where required for (A) Synd‐1 BB515, (B‐D)
IgM BV711, (E) CD80 BV650, (F) PD‐L2 BUV395 (G) IgM BV711, (H) IgD BUV496, (I) CD44
BUV737, (J) CD62L APC‐R700, (K) CXCR5 PE‐Cy7 and (L) PD‐1 BV480 FMO controls.
Figure S5. Titration data for CD3ε PerCP and CD3ε BB700 antibodies. Titrations of
(A) CD3ε PerCP and (B) CD3ε BB700 antibodies not used in the final panel. Data are
splenocytes pre‐gated to remove debris (SSC/FSC) and doublets.
Figure S6. Initial panel staining with CD3ε. Splenocytes were initially stained with
CD3ε BB700 at a dilution of 1:200 for the delineation of T‐cells, prior to replacement
with TCRβ BB700 in the final iteration of the OMIP. Data are splenocytes from naïve
21‐day‐old BALB/c mice.
Figure S7. Titration data for Foxp3 PE clone MF23 antibody. Titration of (A) Foxp3
PE clone MF23 antibody not used in the final panel and (B) Foxp3 PE clone FJK‐16 s
antibody used in the final panel. Data are splenocytes pre‐gated to remove debris
(SSC/FSC) and doublets.
Figure S8. Initial panel staining with CD62L AF700. (A) Titration of CD62L AF700.
(B) Poor discrimination of CD45+TCRβ+CD4+CD62L+CD44lo/− naïve, of CD45+TCRβ+CD4+CD62L+CD44hi
central memory and of CD45+TCRβ+CD4+CD62L−CD44hi effector memory T‐cell subsets when
using the AF700 fluorochrome. Data are splenocytes from naïve 21‐day‐old BALB/c mice.
Figure S9. Compensation matrix. Based on data displayed in Figure 1. Acquisition‐defined
compensation matrix was manually generated post‐acquisition.
Figure S10. Comparison of CXCR5 expression on adolescent and adult splenocytes. Data
are representative flow cytometry plots from 21‐day‐old and 20‐week‐old BALB/c mice
demonstrating the age‐dependent expression of CXCR5 PE‐Cy7 against PD‐1 BV480 on CD4+
T‐cells.
Figure S11. Initial panel staining with IgD BUV496 clone 217–170. (A) Titration of
IgD BUV496 clone 217–170. (B) Suboptimal detection of IgD expression on CD45+TCRβ−CD19+B220+Synd‐1−CD80+PD‐L2−MHC
class II+IgM+IgD+ activated and CD45+TCRβ−CD19+B220+Synd‐1−CD80+PD‐L2+IgM+IgD− memory
B‐cell subsets. Data are splenocytes from naïve 21‐day‐old BALB/c mice.
Click here for additional data file.
Related collections
Most cited references43
- Record: found
- Abstract: found
- Article: not found
Defining trained immunity and its role in health and disease
Mihai Netea, Jorge Domínguez-Andrés, Luis Barreiro … (2020)
- Record: found
- Abstract: found
- Article: not found
Two subsets of memory T lymphocytes with distinct homing potentials and effector functions.
F Sallusto, D Lenig, R Forster … (1999)
- Record: found
- Abstract: found
- Article: not found
Conversion of Peripheral CD4+CD25− Naive T Cells to CD4+CD25+ Regulatory T Cells by TGF-β Induction of Transcription Factor Foxp3
WanJun Chen, Wenwen Jin, Neil Hardegen … (2003)