18
views
0
recommends
+1 Recommend
0 collections
    0
    shares
      • Record: found
      • Abstract: found
      • Article: found
      Is Open Access

      Global, regional and time-trend prevalence of central obesity: a systematic review and meta-analysis of 13.2 million subjects

      research-article

      Read this article at

      Bookmark
          There is no author summary for this article yet. Authors can add summaries to their articles on ScienceOpen to make them more accessible to a non-specialist audience.

          Abstract

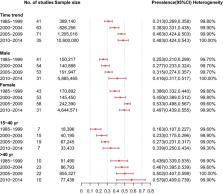
          We aimed to examine the global prevalences of central obesity according to age, sex, race, place of residence, geographical region, national income level, and the definitions of central obesity. MEDLINE and Embase were searched. Studies with sample size of ≥ 500 and investigated individuals aged ≥ 15 years were included. Metaprop (a Stata command) was adopted to conduct a meta-analysis of prevalence, and the Freeman-Tukey Double Arcsine Transformation was used to stabilize the variances. A random-effects model was used to evaluate the prevalence and 95% confidence intervals (CI) of central obesity. There were 288 studies involving 13,233,675 individuals in this analysis. The overall prevalence of central obesity was 41.5% (95% CI 39.9–43.2%). A higher prevalence was found in older individuals, female subjects, urban residents, Caucasians, and populations of higher income level countries. Regarding regional variations, the highest prevalence was found in Sothern America (55.1%, 95% CI 45.8–64.3%) and Central American (52.9%, 95% CI 32.7–72.7%). Its prevalence was rapidly rising from 1985 to 2014. From 1985–1999 to 2010–2014, younger subjects aged 15–40 years showed a more drastic rise in prevalence (16.3 to 33.9%) than subjects aged > 40 years (43.6 to 57.9%). Male individuals have a more drastic rise (25.3 to 41.6%) than females (38.6 to 49.7%). Major increasing in prevalence of the condition in the past three decades, particularly in certain subgroups. These findings could act as a useful reference to inform public health strategies to minimize the impact of central obesity on population health.

          Electronic supplementary material

          The online version of this article (10.1007/s10654-020-00650-3) contains supplementary material, which is available to authorized users.

          Related collections

          Most cited references38

          • Record: found
          • Abstract: found
          • Article: found
          Is Open Access

          Global trends in insufficient physical activity among adolescents: a pooled analysis of 298 population-based surveys with 1·6 million participants

          Summary Background Physical activity has many health benefits for young people. In 2018, WHO launched More Active People for a Healthier World, a new global action on physical activity, including new targets of a 15% relative reduction of global prevalence of insufficient physical activity by 2030 among adolescents and adults. We describe current prevalence and trends of insufficient physical activity among school-going adolescents aged 11–17 years by country, region, and globally. Methods We did a pooled analysis of cross-sectional survey data that were collected through random sampling with a sample size of at least 100 individuals, were representative of a national or defined subnational population, and reported prevalence of of insufficient physical activity by sex in adolescents. Prevalence had to be reported for at least three of the years of age within the 10–19-year age range. We estimated the prevalence of insufficient physical activity in school-going adolescents aged 11–17 years (combined and by sex) for individual countries, for four World Bank income groups, nine regions, and globally for the years 2001–16. To derive a standard definition of insufficient physical activity and to adjust for urban-only survey coverage, we used regression models. We estimated time trends using multilevel mixed-effects modelling. Findings We used data from 298 school-based surveys from 146 countries, territories, and areas including 1·6 million students aged 11–17 years. Globally, in 2016, 81·0% (95% uncertainty interval 77·8–87·7) of students aged 11–17 years were insufficiently physically active (77·6% [76·1–80·4] of boys and 84·7% [83·0–88·2] of girls). Although prevalence of insufficient physical activity significantly decreased between 2001 and 2016 for boys (from 80·1% [78·3–81·6] in 2001), there was no significant change for girls (from 85·1% [83·1–88·0] in 2001). There was no clear pattern according to country income group: insufficient activity prevalence in 2016 was 84·9% (82·6–88·2) in low-income countries, 79·3% (77·2–87·5) in lower–middle-income countries, 83·9% (79·5–89·2) in upper–middle-income countries, and 79·4% (74·0–86·2) in high-income countries. The region with the highest prevalence of insufficient activity in 2016 was high-income Asia Pacific for both boys (89·0%, 62·8–92·2) and girls (95·6%, 73·7–97·9). The regions with the lowest prevalence were high-income western countries for boys (72·1%, 71·1–73·6), and south Asia for girls (77·5%, 72·8–89·3). In 2016, 27 countries had a prevalence of insufficient activity of 90% or more for girls, whereas this was the case for two countries for boys. Interpretation The majority of adolescents do not meet current physical activity guidelines. Urgent scaling up of implementation of known effective policies and programmes is needed to increase activity in adolescents. Investment and leadership at all levels to intervene on the multiple causes and inequities that might perpetuate the low participation in physical activity and sex differences, as well as engagement of youth themselves, will be vital to strengthen the opportunities for physical activity in all communities. Such action will improve the health of this and future young generations and support achieving the 2030 Sustainable Development Goals. Funding WHO.
            Bookmark
            • Record: found
            • Abstract: found
            • Article: not found

            Waist circumference and not body mass index explains obesity-related health risk.

            The addition of waist circumference (WC) to body mass index (BMI; in kg/m(2)) predicts a greater variance in health risk than does BMI alone; however, whether the reverse is true is not known. We evaluated whether BMI adds to the predictive power of WC in assessing obesity-related comorbidity. Subjects were 14 924 adult participants in the third National Health and Nutrition Examination Survey, grouped into categories of BMI and WC in accordance with the National Institutes of Health cutoffs. Odds ratios for hypertension, dyslipidemia, and the metabolic syndrome were compared for overweight and class I obese BMI categories and the normal-weight category before and after adjustment for WC. BMI and WC were also included in the same regression model as continuous variables for prediction of the metabolic disorders. With few exceptions, overweight and obese subjects were more likely to have hypertension, dyslipidemia, and the metabolic syndrome than were normal-weight subjects. After adjustment for WC category (normal or high), the odds of comorbidity, although attenuated, remained higher in overweight and obese subjects than in normal-weight subjects. However, after adjustment for WC as a continuous variable, the likelihood of hypertension, dyslipidemia, and the metabolic syndrome was similar in all groups. When WC and BMI were used as continuous variables in the same regression model, WC alone was a significant predictor of comorbidity. WC, and not BMI, explains obesity-related health risk. Thus, for a given WC value, overweight and obese persons and normal-weight persons have comparable health risks. However, when WC is dichotomized as normal or high, BMI remains a significant predictor of health risk.
              Bookmark
              • Record: found
              • Abstract: found
              • Article: not found

              Global alcohol exposure between 1990 and 2017 and forecasts until 2030: a modelling study

              Alcohol use is a leading risk factor for global disease burden, and data on alcohol exposure are crucial to evaluate progress in achieving global non-communicable disease goals. We present estimates on the main indicators of alcohol exposure for 189 countries from 1990-2017, with forecasts up to 2030.
                Bookmark

                Author and article information

                Contributors
                wong_martin@cuhk.edu.hk
                junjie_huang@link.cuhk.edu.hk
                jxwang@link.cuhk.edu.hk
                pchan@link.cuhk.edu.hk
                veeleahlok@cuhk.edu.hk
                xiaochen@cuhk.edu.hk
                coletteleung19@gmail.com
                haoxiangwang@163.com
                xqlao@cuhk.edu.hk
                zhengzj@bjmu.edu.cn
                Journal
                Eur J Epidemiol
                Eur. J. Epidemiol
                European Journal of Epidemiology
                Springer Netherlands (Dordrecht )
                0393-2990
                1573-7284
                24 May 2020
                24 May 2020
                2020
                : 35
                : 7
                : 673-683
                Affiliations
                [1 ]GRID grid.10784.3a, ISNI 0000 0004 1937 0482, Jockey Club School of Public Health and Primary Care, Faculty of Medicine, , Chinese University of Hong Kong, ; 4/F, School of Public Health, Prince of Wales Hospital, Hong Kong, Hong Kong
                [2 ]GRID grid.12981.33, ISNI 0000 0001 2360 039X, School of Public Health, , Sun Yat-Sen University, ; Guangzhou, China
                [3 ]GRID grid.11135.37, ISNI 0000 0001 2256 9319, Department of Global Health, School of Public Health, , Peking University, ; 38, Xue Yuan Road, Haidian District, Beijing, China
                Author information
                http://orcid.org/0000-0001-7706-9370
                Article
                650
                10.1007/s10654-020-00650-3
                7387368
                32448986
                aa2799fb-5279-4933-9e7a-75b8e0d3dee9
                © The Author(s) 2020

                Open AccessThis article is licensed under a Creative Commons Attribution 4.0 International License, which permits use, sharing, adaptation, distribution and reproduction in any medium or format, as long as you give appropriate credit to the original author(s) and the source, provide a link to the Creative Commons licence, and indicate if changes were made. The images or other third party material in this article are included in the article's Creative Commons licence, unless indicated otherwise in a credit line to the material. If material is not included in the article's Creative Commons licence and your intended use is not permitted by statutory regulation or exceeds the permitted use, you will need to obtain permission directly from the copyright holder. To view a copy of this licence, visit http://creativecommons.org/licenses/by/4.0/.

                History
                : 19 January 2020
                : 18 May 2020
                Categories
                Meta-Analysis
                Custom metadata
                © Springer Nature B.V. 2020

                Public health
                central obesity,waist circumference,prevalence,epidemiology,temporal trend
                Public health
                central obesity, waist circumference, prevalence, epidemiology, temporal trend

                Comments

                Comment on this article