- Record: found
- Abstract: found
- Article: not found
De novo design of potent and selective mimics of IL-2 and IL-15
research-article
Daniel-Adriano Silva
1
,
2
,
& ,
Shawn Yu
1
,
3 ,
Umut Ulge
1
,
3 ,
Jamie B. Spangler
4 ,
Kevin M. Jude
5 ,
Carlos Labão-Almeida
6 ,
Lestat R. Ali
7 ,
Alfredo Quijano-Rubio
1
,
2
,
3 ,
Mikel Ruterbusch
8 ,
Isabel Leung
9 ,
Tamara Biary
7 ,
Stephanie J. Crowley
7 ,
Enrique Marcos
10 ,
Carl D. Walkey
1
,
2 ,
Brian D. Weitzner
1
,
2 ,
Fátima Pardo-Avila
11 ,
Javier Castellanos
1
,
2 ,
Lauren Carter
1 ,
Lance Stewart
1 ,
Stanley Riddell
9 ,
Marion Pepper
8 ,
Gonçalo J. L. Bernardes
6
,
12 ,
Michael Dougan
7 ,
K. Christopher Garcia
5
,
13
,
& ,
David Baker
1
,
2
,
13
,
&
09 January 2019
Read this article at

There is no author summary for this article yet. Authors can add summaries to their articles on ScienceOpen to make them more accessible to a non-specialist audience.
Abstract
We describe a de novo computational approach for designing
proteins that recapitulate the functional sites of natural signaling proteins, but
otherwise are unrelated in topology or amino acid sequence. We use this strategy to
design mimics of the central immune cytokine interleukin-2 (IL-2) that bind to the
IL-2
receptor βƔc heterodimer (IL-2RβƔc),
but have no binding site for IL-2Rα or IL-15Rα. The designs are
hyper-stable, bind human and mouse IL-2RβƔc with higher
affinity than the natural cytokines, and elicit downstream cell signaling independent
of
IL-2Rα and IL-15Rα. Crystal structures of Neoleukin-2/15 (Neo-2/15), an
experimentally optimized mimic, are very close to the designed model. Neo-2/15 has
superior therapeutic activity than IL-2 in murine models of melanoma and colon cancer,
with reduced toxicity and undetectable immunogenicity. Our strategy for building
hyper-stable de novo mimetics can be applied to signaling proteins
quite generally, enabling the creation of superior therapeutic candidates.
The considerable potential of the central immune cytokine interleukin-2 (IL-2)
for cancer treatment
1–3
has sparked numerous efforts to improve its
therapeutic properties by mutation and/or chemical modification
4–11
.
Such efforts have sought to simplify manufacturing, extend half-life, and modulate
receptor interactions
12–14
. However, there are inherent
challenges to the development of a new therapeutic when starting with a naturally
occurring bioactive protein. First, most natural proteins are only marginally
stable
15–17
, hence amino acid substitutions aimed at
increasing efficacy can decrease expression or cause aggregation, making manufacturing
and storage difficult. More substantial changes, such as the deletion or fusion of
functional or targeting domains, are often unworkable and can dramatically alter
pharmacokinetic properties and tissue penetration
13
. Second, any immune response against the engineered variant may
cross-react with the endogenous molecule
18–24
with
potentially catastrophic consequences. Third, the target receptor subunit interaction
profile can be difficult to reprogram. The clinical use of IL-2 has been mainly limited
by toxicity
25–27
which, while incompletely understood in humans,
is T cell independent in murine models and considerably reduced in animals deficient
in
the IL-2Rα chain (CD25−). Previous efforts at removing the CD25
interaction region in IL-2 and its reengineered variants, by either mutation
5,8,28,29
(e.g. Super-2) or PEGylation (e.g. NKTR-214
11
), have resulted in markedly reduced stability,
binding and/or potency of the cytokine while failing to completely eliminate the
interaction with CD25. Here, we sought to develop a computational design approach
to
generate analogs of natural proteins with improved therapeutic properties that
circumvent these challenges, focusing our effort on engineering de novo
cytokine mimics displaying the specific receptor binding interfaces optimal for treating
disease.
Computational design of IL-2/IL-15 mimics that bind and activate
IL-2RβƔc:
Cytokines interact with multiple receptor subunits
30–33
, and like most naturally occurring proteins, contain
non-ideal structural features that compromise its stability but are important
for function. We developed a computational protocol in which the structural
elements interacting with the desired receptor subunit(s) are fixed in space
(Fig. 1a), and an idealized globular
protein structure is built to support these elements. De novo
design has been used previously to support short linear epitopes
34–37
; here we support more complex binding
interfaces by using a parametric construction of disembodied helices coupled
with knowledge-based loop closure
38
(Fig. 1b–c). We tested our approach by attempting to
de novo design stable idealized proteins with interaction
surfaces mimicking those of human IL-2 (hIL-2) and human IL-15 (hIL-15) for the
human IL-2RβƔc
(hIL-2RβƔc)
32,39
, but entirely
lacking the alpha (CD25) receptor interaction surface.
Native hIL-2 comprises four helices (Fig.
1a) connected by long irregular loops. The N-terminal helix (H1)
interacts with both the beta and gamma subunits, the third helix (H3) interacts
with the beta subunit, and the C-terminal helix (H4) with the gamma subunit; the
alpha subunit interacting surface is formed by the irregular second helix (H2)
and two long loops, one connecting H1 to H2 and the other connecting H3 and H4.
We aimed to build an idealized protein that recapitulates the interface formed
by H1, H3, and H4 with beta and gamma and to replace H2 with a helix that offers
better packing and ignores the interaction with the alpha subunit. Two
generations of designed mimics were made. In a first generation, we used all
helices (H1, H2, H3, and H4) from hIL-2 (Fig.
1a) as starting points for structure idealization by (independently)
rebuilding each disembodied helix using commonly occurring protein fragments
(see Methods), and connecting helices with
fragment derived loops (Fig. 1c) to
generate fully connected backbones (Fig.
1d). For each backbone (in complex with
hIL-2RβƔc) Rosetta combinatorial flexible backbone
sequence design was carried out
40–42
resulting in a considerably more regular structure for H2 (H2’) than in
hIL-2 (Fig. 1b, top panel; see Methods). The four lowest energy designs and
eight single-disulfide stapled variations (SI Table S1) were selected for
experimental characterization by yeast display (see Methods). Eight designs bound
fluorescently-tagged
beta-gamma chimeric IL-2 receptor at low-nanomolar concentrations (SI Fig. S1), and
the
highest affinity non-disulfide design (G1_neo2_40) was subjected to
site-saturation mutagenesis (SI Table S5), followed by a library of combinatorial
substitutions
(enriched in selections against hIL-2RβƔc, SI Fig. S2 and Table S7). The highest
affinity variants (SI Fig.
S4 and SI Table
S2) were expressed recombinantly in E. coli and
found to elicit pSTAT5 signaling in vitro on IL-2-responsive
murine cells at low-nanomolar or even picomolar concentrations (Table E1), but had
relatively low thermal stability
(Tm ~<45°C, SI Figs. S3 and S5). To improve stability, in a
second generation of designs, we repeated the computational design protocol
starting from the backbone of the highest affinity first-round design
(G1_neo2_40_1F, topology: H1->H4->H2’->H3), but this
time coupling the loop building process with parametric variation of the helix
lengths (+/− 8 amino acids, Fig. 1b
bottom panel). This second generation approach improved the quality of the
models by enabling the exploration of substantially more combinations of
high-quality loops connecting each pair of helices. The fourteen-second
generation designs with highest predicted affinity and stability, along with
twenty-seven Rosetta sequence redesigns of G1_neo2_40_1F (SI Table S3), were experimentally
characterized and all but one were found to bind the hIL-2 receptor at
low-nanomolar concentrations (Fig. 1f,
extended Table E1, and SI Fig. S6). The three
highest affinity and stability designs (one sequence redesign and two new
mimetics) were subjected to site-saturation mutagenesis (SI Table S6), followed by
combinatorial libraries of substitutions increasing affinity against
mIL-2RβƔc (SI Figs. S8–10 and Tables S6 and S8), which yielded higher affinity
hyper-stable variants of the de novo mimics (extended Table E1, SI Tables S4 and S8,
and SI Figs. S11–13). The second generation
optimized design with highest overall affinity for both human and mouse
IL-2RβƔc, Neoleukin-2/15, is a 100-residue protein
with a new topology and sequence quite different from human or murine IL-2
(BLASTP sequence identity to hIL-2 and mIL-2 of 14% and 24% respectively; MICAN
structural-based sequence identity to hIL-2 and mIL-2 of 29% and 16%
respectively, see Methods and extended Table E1).
Functional characterization of Neo-2/15:
Neo-2/15 binds with high affinity to human and mouse
IL-2RβƔc (Kd ~19 nM and ~38,
respectively) but does not interact with IL-2Rα (Fig. 2a). The affinities of Neo-2/15
for the human and
mouse IL-2 receptors (IL-2Rβ and IL-2RβƔc) are
significantly higher than those of the corresponding native IL-2 cytokines
(Table E1). Neo-2/15 activates
IL-2Rα− human YT-1 cells more potently than native
hIL-2 (EC50 = 49 pM vs. 410 pM) and IL-2Rα−
mouse primary T cells more potently than native mIL-2 (EC50 = 130 pM
vs. 30 nM), which is consistent with its higher binding affinity (Fig. 2b, SI Table
S9). Neo-2/15 is more
active than Super-2 on IL-2Rα− mouse primary T cells
(EC50 = 130 pM vs. 660 pM) and less active than Super-2 on
IL-2Rα+ cells (EC50 = 24 pM vs. 1.2 pM),
presumably due to its complete lack of IL-2Rα binding (Fig. 2b). Neo-2/15 is hyper-stable
(SI Fig. S13) and does not lose
binding affinity for hIL-2RβƔc following incubation at
80°C for 2 hours, while hIL-2 and Super-2 are completely inactivated
after 10 minutes (half-inactivation time = ~4.2 min and ~2.6 min,
respectively, Fig. 2c, top panel). In
ex vivo primary cell cultures, Neo-2/15 drives T cell
survival effectively after 60 minutes of boiling at 95°C, whereas these
conditions inactivated both IL-2 and Super-2 (Fig.
2c, bottom panel). This unprecedented stability for a cytokine-like
molecule, beyond eliminating the requirement for cold chain storage, suggests a
robustness to mutations (extended Fig.
E8), genetic fusions and chemical modification (SI Fig. S14) greatly exceeding that
of native IL-2, which could contribute to the development of improved or new
therapeutic properties (extended Figs.
E3–4).
Structure of monomeric Neo-2/15 and ternary complex with
mIL-2RβƔc:
The X-ray crystal structure of Neo-2/15 is very close to the
computational design model (r.m.s.d.Cα = 1.1–1.3
Å for the 6 copies in the asymmetric unit, Fig. 3a). Neo-2/15 enabled the determination
of the previously
unsolved murine IL-2RβƔc complex, its structure aligns
very closely to the previously reported human IL-2 receptor complex
43
(Fig. 3b, Table E2). The
Neo-2/15 design model and its crystal structure align with the mouse ternary
complex structure with an r.m.s.d.Cα of 1.27 and 1.29
Å, respectively (Fig. 3c). The order
of helices in Neo-2/15 (in IL-2 numbering) is
H1->H3->H2’->H4 (Figs.
1a and 3a,d). The H1-H3 loop is disordered in the ternary
complex, but helix H3 is in close agreement with the predicted structure; there
is also an outward movement of helix H4 and the H2’-H4 loop compared to
the monomeric structure (Fig. 3c). Neo-2/15
interacts with mIL-2Rβ via helices H1 and H3, and with
Ɣc via the H1 and H4 helices (Fig. 3); these regions align closely with both the
computational design model (Fig. 3a) and
the monomeric crystal structure (Fig. 3c).
A ~4.0 Å shift for helix H4 (see Figure 3c) in the mouse complex may reflect the optimization
for
high-affinity binding to both the mouse and human receptors; Neo-2/15 design was
based on the human complex structure and simulations suggest that there is
little or no helix shift in this complex (see extended Fig. E7). Consistent with this,
the helices of apo-Neo-2/15
superimpose closely on those of hIL-2 in complex with the human receptor (Fig. 3e–f),
despite the different topology of the two proteins (Fig. 3d).
Therapeutic applications of Neo-2/15:
The inherent low stability of IL-2 and its tightly evolved dependence on
CD25 have been barriers to the clinical translation of reengineered IL-2
compounds. Other efforts have focused on IL-15
44
, since it elicits similar signaling to
IL-2 by dimerizing the IL-2RβƔc but has no affinity for
CD25. However, IL-15 activity is dependent on trans presentation of the
IL-15α (CD215) receptor that is displayed primarily on antigen-presenting
cells and NK cells. The low stability of native IL-15 and its dependence on
trans presentation have also been substantial barriers to reengineering
efforts
44,45
.
Dose escalation studies on naive mice show that Neo-2/15 expands
immunosuppressive Treg cells (Treg) less than mIL-2 (Fig. 4a, left panel), leading
to a higher CD8+ killer
T cell : Treg ratio for Neo-2/15 than for mIL-2 (Fig. 4a, right panel). The increased
expansion of
regulatory T cells by mIL-2 is expected because mIL-2 binds preferentially to
CD25+ cells
35,46,47
. The higher CD8 T cell : Treg ratios
achieved with Neo-2/15 are generally associated with better tumor
killing
8,11,29
; this functional advantage of Neo-2/15 likely stems from
its higher affinity for IL-2βƔc and lack of bias
towards CD25+ cells. Similarly, in a murine model of airway
inflammation that normally induces a small percentage of tissue-resident CD8+ T
cells (Thy1.2- CD44+ CD8+), Neo-2/15 elicits an increase in the population of
tissue-resident CD8+ T cells without increasing the population of
antigen-specific Treg (CD4+ Foxp3+, Fig. 4b).
To test whether Neo-2/15 is immunogenic, naive and tumor-bearing mice
were treated with Neo-2/15 daily (over a period of 4-weeks and 2-weeks,
respectively). Little or no immunogenicity was observed in either case (Fig. 4c and
extended Fig. E5); a similar lack of immune response has been
observed for other de novo designed therapeutic candidates
(likely due to their small size and high stability)
35
. Polyclonal antibodies against Neo-2/15
were generated by vaccinating mice with an inactive Neo-2/15 mutant (K.O.
Neo-2/15) in complete Freund’s adjuvant; importantly, these polyclonal
(pAb) anti-Neo-2/15 antibodies do not cross-react with human or murine IL-2
(Fig. 4c and extended Fig. E5). Thus, even if there is an immune
response to Neo-2/15 in a therapeutic setting, this response is unlikely to
cross-react with endogenous IL-2. The low sequence identity between Neo-2/15 and
hIL-2 (Table E1) makes an autoimmune
response against host IL-2 much less likely for Neo-2/15 than for previously
engineered hIL-2 variants (e.g. Super-2 or PEGylated variants of hIL-2), which
differ from endogenous hIL-2 by only a few mutations (the BLASTP sequence
identities of Neo2–15 and Super-2 to hIL-2 are 14% and 95%,
respectively).
We tested the therapeutic efficacy of Neo-2/15 in B16F10 (melanoma) and
CT26 (colon cancer) mouse models. Single-agent treatment with Neo-2/15 led to
dose-dependent delays in tumor growth in both cancer models. In CT26 colon
cancer, single agent treatment showed improved efficacy compared to mIL-2 (Fig. 4d
and extended Fig. E1). In B16F10 melanoma, previous studies have shown
that single-agent treatment with IL-2 is only partially effective, and
co-treatment with the anti-melanoma cell antibody TA99 (anti-TRP1 mAb) is
synergistic with IL-2
5,12,14
and IL-15 (superagonist complex ALT-803)
48
. In long-term survival
experiments (8 weeks), Neo-2/15 in combination with TA99 showed substantially
reduced toxicity and an overall superior therapeutic effect compared to mIL-2
(Fig. 4e
extended Fig. E2), while treatment with
TA99 alone has little effect. Mice treated with the combination mIL-2 and TA99
steadily lost weight and their overall health declined to the point of requiring
euthanasia, whereas little decline was observed with the combination of Neo-2/15
and TA99 (Fig. 4e). Consistent with a
therapeutic benefit, Neo-2/15 treatment led to a significant increase in
intratumoral CD8:Treg ratios (Fig.
4f and extended Fig. E1), which
correlate with effective antitumor immune responses
49
. The increases of CD8:Treg
ratios by Neo-2/15 are dose- and antigen-dependent (Fig. 4f), which is consistent
with the better
therapeutic effects observed at higher doses and in combination with TA99 (extended
Fig. E2). Altogether, these data
show that Neo-2/15 exhibits the predicted homeostatic benefit derived from its
IL-2-like immunostimulatory activity, but without the adverse effects associated
with a CD25+ preferential binding. These enhanced properties and low
toxicity may allow the routine use of Neo-2/15 for indications for which IL-2 is
not broadly used, such as to enhance CAR-T cell therapies (extended Fig. E4). The
considerable activation of
pSTAT5 signaling in naive mouse peripheral blood lymphocytes (CD8 and B cells)
observed an hour after exposure to Neo-2/15 was much reduced after three hours
(extended Fig. E6), suggesting that
the efficacy of Neo-2/15 can likely be increased using standard approaches for
extending circulation half-life, for example PEGylation
50
.
De novo design of protein mimetics has the potential to
transform the field of protein-based therapeutics, enabling the development of
bio-superior molecules with enhanced therapeutic properties and reduced
side-effects, not only for cytokines but for virtually any biologically active
molecule with known or accurately predictable structure. Because of the
incremental nature of current traditional engineering approaches (e.g.
1–3 amino acid substitutions, chemical modification at a single site),
most of the shortcomings of the parent molecule are inevitably passed on to the
resulting engineered variants, often in an exacerbated form. By building mimics
completely from scratch, these shortcomings can be avoided: unlike recombinant
IL-2 and its engineered variants, Neo-2/15 is well expressed in E. coli (SI Fig. S13),
retains
activity at high temperature, does not interact with IL-2Rα, and is
robust to substantial sequence changes (extended
Fig. E8) that can allow the engineering of new functions. Likely
because of the small size and high stability of de novo
designed proteins, immunogenicity appears to be low
35
, and in contrast to incremental variants
of hIL-2, any antibody response mounted against mimetics is unlikely to
cross-react with the natural parent cytokine. Because of their high stability
and robustness, along with their tailored interaction surfaces, designed
de novo protein mimetics are likely to be particularly
powerful for developing next-generation therapeutics that combine different
protein functionalities.
Methods
Computational design of de novo cytokine mimetics:
The design of de novo cytokine mimetics began by
defining the structure of hIL-2 in the quaternary complex with the
IL-2RβƔc receptor as the template for the design.
After inspection, the residues composing the binding-site were defined as
hotspots using Rosetta’s metadata (PDBInfoLabels). The structure was fed
into the new mimetic design protocol that is programmed in PyRosetta, which can
automatically detect the core-secondary structure elements that compose the
target-template and produce the resulting de novo mimetic backbones with full
RosettaScripts compatible information for design. Briefly, the mimetic building
algorithm works as follows. For the first generation of designs, each of the
core-elements was idealized by reconstruction using loops from a clustered
database of highly-ideal fragments (fragment-size 4 amino acids, see Data availability).
After idealization, the
mimetic building protocol aims to reconnect the idealized elements by pairs in
all possible combinations. To do this it uses combinatorial fragment assembly of
sequence-agnostic fragments from the database, followed by cartesian-constrained
backbone minimization for potential solutions (i.e. where the N- and C- ends of
the built fragment are close enough to link the two secondary structures). After
minimization, the solutions are verified to contain highly ideal fragments (i.e.
that every overlapping fragment that composes the two connected elements is also
contained within the database) and that no backbone clashes with the target
(context) receptor. Successful solutions were then profiled using the same
database of fragments in order to determine the most probable amino acids at
each position (this information was encoded as metadata on each design). Next,
solutions for pairs of connected secondary structures were combinatorially
recombined (by using graph theory connected components) to produce fully
connected backbones. Since the number of solutions grows exponentially with each
pair of elements, at each fragment combination step we ranked the designs to
favor those with shorter interconnections between pairs of secondary-structure
core elements (i.e. effectively with shorter loops), and kept only the top
solutions. Fully connected backbone solutions were profiled by layer (interface,
core, non-core-surface, surface) in order to restrict the identities of the
possible amino acids to be layer-compatible. Finally, all the information on
hotspots, compatible built-fragment amino acids and layers were combined
(hotspot has precedence to amino acid probability, and amino acid probability
took precedence to layer). These fully profiled backbones were then passed to
RosettaScripts for flexible backbone design and filtering (see SI Appendix A). For
the second
generation of designs, we followed two approaches. In the first approach, we
just simply executed Rosetta sequence redesigns of our best first generation
optimized design (G1_neo2_40_1F, SI Appendix B). In the second
approach, we engineered new mimetics using G1_neo2_40_1F as the target template.
The mimetic design protocol in this second generation was similar to the one
described for the first generation, but with two key differences. Firstly, the
core-elements (i.e. those that are secondary structures) were no longer built
from fragments, but instead by discovering parametric equations of repetitive
phi and psi angles (omega fixed to 180°) that result in secondary
structures that recapitulated each of the target helices as close as possible, a
“pitch” on the phi and psi angles was allowed every 3rd residue in
order to allow the helices the possibility to have curvature (final angle
parameters: H1: phi=−60.4, psi=−45.8, phi_pitch=−1.0,
psi_pitch=2.0; H2: phi=−64.5, psi=−38.4, phi_pitch=4.0,
psi_pitch=−8.0; H3: phi=−64.6, psi=−40.6, phi_pitch=0.0,
psi_pitch=0.0; H4: phi=−64.3, psi=−41.7, phi_pitch=0.0,
psi_pitch=0.0). By using these parametric equations, the algorithm can variate
the length of each of the core-elements up to ∓8.a.a. (compared to input
the template). Reductions in the size of the core elements were not allowed to
remove hotspots from the binding site. All length variations of the
core-elements were reconnected with loops from a clustered database of highly
ideal loops (fragment-size of 7 amino acids). The rest of the design algorithm
was in essence similar to the one followed in the generation one (SI Appendix C).
The
Rosetta energy functions used for sequence design were
“talaris2013” and “talaris2014”, for the first and
second generation of designs, respectively.
The databases of highly ideal fragments used for the design of the
backbones for the de novo mimetics (see Data availability) were constructed with the
Rosetta
application “kcenters_clustering_of_fragments” using an extensive
database of non-redundant (publicly available) protein structures from the RCSB
protein data bank, which was comprised of 16767 PDBs for the 4-mer database
(first generation of designs), and 7062 PDBs for the 7-mer database used for the
second generation designs (see Data
Availability). The computational algorithms for designing de
novo mimics are also provided (see Data Availability).
Yeast display:
Yeast were transformed with genes encoding the proteins to be displayed
together with a linearized pETcon3 vector. The vector was linearized by 100 fold
overdigestion by NdeI and XhoI (New England Biolabs) and then purified by gel
extraction (Qiagen). The genes included 50 bases of overlap with the vector on
both the 5’ and 3’ end such that homologous recombination would
place the genes in-frame between the AGA2 gene and the Myc tag on the vector.
Yeast was grown in C-Trp-Ura media prior to induction in SGCAA media as
previously described
34,35,51
. After induction for 12–18 hours, cells were
washed in chilled display buffer (50mM NaPO4 pH 8, 20mM NaCl, 0.5%
BSA) and incubated with varying concentrations of biotinylated receptor (either
human or murine IL-2Rα, IL-2Rβ or Ɣc) while
being agitated at 4°C. After approximately 30 minutes, cells were washed
again in a chilled buffer and then incubated on ice for 5 minutes with a
FITC-conjugated anti-c-Myc antibody (1 uL per 3×10⁶ cells) and
streptavidin-phycoerythrin (1 uL per 100 uL volume of yeast). Yeast was then
washed and counted by flow cytometry (Accuri C6) or sorted by FACS (Sony
SH800).
Mutagenesis and affinity maturation:
Site-saturation mutagenesis (SSM) libraries were constructed from
synthetic DNA from Genscript. For each amino acid on each design template,
forward primers and reverse primers were designed such that PCR amplification
would result in a 5’ PCR product with a degenerate NNK codon and a
3’ PCR product, respectively. Amplification of “left” and
“right” products by COF and COR primers yielded a series of
template products each consisting of a degenerate NNK codon at a different
residue position. For each design, these products were pooled to yield the SSM
library. SSM libraries were transformed by electroporation into conditioned
Saccharomyces cerevisiae strain EBY100 cells, along with linearized pETcon3
vector, using the protocol previously described by Benatuil et al. For details
of the primers used in the creation of SSM libraries SI Tables S5–6.
Combinatorial libraries were constructed from synthetic DNA from
Genscript containing ambiguous nucleotides and similarly transformed into a
linearized pETcon3 vector. For details of the primers used in the creation of
combinatorial libraries see SI
Tables S7–8.
Protein expression:
Genes encoding the designed protein sequences were synthesized and
cloned into pET-28b(+) E. coli plasmid expression vectors
(GenScript, N-terminal 6xHis-tagged followed by a thrombin cleavage site. For
all the designed proteins, the sequence of the N-terminal tag used is
MGSSHHHHHHSSGLVPRGSHM (unless otherwise noted), which is followed immediately by
the sequence of the designed protein. Plasmids were then transformed into
chemically competent E. coli Lemo21 cells (NEB). Protein
expression was performed using Terrific Broth and M salts, cultures were grown
at 37°C until OD600 reached approximately 0.8, then expression
was induced with 1 mM of isopropyl β-D-thiogalactopyranoside (IPTG), and
the temperature was lowered to 18°C. After expression for approximately
18 hours, cells were harvested and lysed with a Microfluidics M110P
microfluidizer at 18,000 psi, then the soluble fraction was clarified by
centrifugation at 24,000 g for 20 minutes. The soluble fraction was purified by
Immobilized Metal Affinity Chromatography (Qiagen) followed by FPLC
size-exclusion chromatography (Superdex 75 10/300 GL, GE Healthcare). The
purified Neo-2/15 was characterized by Mass Spectrum (MS) verification of the
molecular weight of the species in solution (Thermo Scientific ), Size Exclusion
- MultiAngle Laser Light Scattering (SEC-MALLS) in order to verify monomeric
state and molecular weight (Agilent, Wyatt), SDS-PAGE, and endotoxin levels
(Charles River).
Human and mouse IL-2 complex components including hIL-2 (a.a.
1–133), hIL-2Rα (a.a. 1–217), hIL-2Rβ (a.a.
1–214) hIL-2RƔc (a.a. 1–232), mIL-2 (a.a.
1–149), mIL-2Rα ectodomain (a.a. 1–213), mIL-2Rβ
ectodomain (a.a. 1–215), and mƔc ectodomain (a.a.
1–233) were secreted and purified using a baculovirus expression system,
as previously described
39,43
. For the zippered
hIL-2RβƔc heterodimer, the aforementioned
extracellular domain residues for the human/mouse IL-2Rβ and human/mouse
IL-2RƔc were separately cloned into baculovirus expression
constructs containing 3C protease-cleavable basic and acidic leucine zippers,
respectively, for a high-fidelity pairing of the receptor subunits, as described
previously
52
. The
IL-2Rβ and IL-2RƔc constructs were transfected
independently and their corresponding viruses were co-titrated to determine
optimal infection ratios for equivalent expression of the two chains. Insect
cell secretion and purification proceeded as described for IL-2 cytokine and
receptor subunits. All proteins were purified to >98% homogeneity with a
Superdex 200 sizing column (GE Healthcare) equilibrated in HBS. Purity was
verified by SDS-PAGE analysis. For expression of biotinylated human IL-2 and
mouse IL-2 receptor subunits, proteins containing a C-terminal biotin acceptor
peptide (BAP)-LNDIFEAQKIEWHE were expressed and purified as described via Ni-NTA
affinity chromatography and then biotinylated with the soluble BirA ligase
enzyme in 0.5 mM Bicine pH 8.3, 100 mM ATP, 100 mM magnesium acetate, and 500 mM
biotin (Sigma). Excess biotin was removed by size exclusion chromatography on a
Superdex 200 column equilibrated in HBS.
Neo-2/15 crystal and co-crystal structures:
C-terminally 6xHis-tagged endoglycosidase H (endoH) and murine
IL-2Rβ and IL-2RƔc were expressed separately in Hi-five
cells using a baculovirus system as previously described.
IL-2RƔc was grown in the presence of 5 μM
kifunensine. After approximately 72 hours, the secreted proteins were purified
from the media by passing over a Ni-NTA agarose column and eluted with 200 mM
imidazole in HBS buffer (150 mM NaCl, 10 mM HEPES pH 7.3). EndoH was exchanged
into HBS buffer by diafiltration. mIL-2RƔc was deglycosylated
by overnight incubation with 1:75 (w/w) endoH. mIL-2Rβand
mIL-2RƔc were further purified and buffer exchanged by
FPLC using an S200 column (GE Life Sciences).
Monomeric Neo-2/15 was concentrated to 12 mg/ml and crystallized by
vapor diffusion from 2.4 M sodium malonate pH 7.0, and crystals were harvested
and flash frozen without further cryoprotection. Crystals diffracted to 2.0
Å resolution at Stanford Synchrotron Radiation Laboratory beamline
12–2 and were indexed and integrated using XDS (Kabsch, 2010). The space
group was assigned with Pointless (Evans, 2006), and scaling was performed with
Aimless (Evans and Murshudov, 2013) from the CCP4 suite (Winn et al., 2013). Our
predicted model was used as a search ensemble to solve the structure by
molecular replacement in Phaser (McCoy et al., 2007), with six protomers located
in the asymmetric unit. After initial rebuilding with Autobuild (Terwilliger et
al., 2008), iterative cycles of manual rebuilding and refinement were performed
using Coot (Emsley et al., 2010) and PHENIX (Adams et al., 2010).
To crystallize the ternary
Neo-2/15:mIL-2Rβ:mIL-2RƔc complex, the three
proteins were combined in equimolar ratios, digested overnight with 1:100 (w/w)
carboxypeptidases A and B to remove purification tags, and purified by FPLC
using an S200 column; fractions containing all three proteins were pooled and
concentrated to 20 mg/ml. Initial needlelike microcrystals were formed by vapor
diffusion from 0.1 M imidazole pH 8.0, 1 M sodium citrate and used to prepare a
microseed stock for subsequent use in microseed matrix screening (MMS,
(D’Arcy et al., 2014)). After a single iteration of MMS, crystals grown
in the same precipitant were cryoprotected with 30% ethylene glycol, harvested
and diffracted anisotropically to 3.4 Å × 3.8 Å ×
4.1 Å resolution at Advanced Photon Source beamline 23ID-B. The structure
was solved by molecular replacement in Phaser using the human IL-2Rβ and
IL-2RƔc structures (PDB ID: 2B5I) as search ensembles.
This produced an electron density map into which two poly-alanine alpha helices
could be manually built. Following rigid body refinement in Phenix, electron
density for the two unmodeled alpha helices, along with the BC loop and some
aromatic side chains, became visible, allowing docking of the monomeric
Neo-2/15. Two further iterations of MMS and use of an additive screen (Hampton
Research) produced crystals grown by vapor diffusion using 150 nl of protein,
125 nl of well solution containing 0.1 M Tris pH 7.5, 5% dextran sulfate, 2.1 M
ammonium sulfate and 25 nl of microseed stock containing 1.3 M ammonium sulfate,
50 mM Tris pH 7.5, 50 mM imidazole pH 8.0, 300 mM sodium citrate. Crystals
cryoprotected with 3 M sodium malonate were flash frozen and diffracted
anisotropically to 2.5 Å × 3.7 Å × 3.8 Å at
Advanced Light Source beamline 5.0.1. After processing the data with XDS, an
elliptical resolution limit was applied using the STARANISO server (Bruhn et
al., 2017). Rapid convergence of the model was obtained by refinement against
these reflections using TLS and target restraints to the higher resolution human
receptor (PDB ID: 2B5I) and Neo-2/15 structures in Buster (Smart et al., 2012;
Bricogne et al., 2016), with manual rebuilding in Coot, followed by a final
round of refinement in PHENIX with no target restraints. Structure figures were
prepared with PyMol (Schrodinger, LLC. 2010. The PyMOL Molecular Graphics
System, Version 2.1.0). Software used in this project was installed and
configured by SBGrid (Morin et al., 2013).
Cell Lines:
Unmodified YT-1
53
and
IL-2Rα+ YT-1 human NK cells
54
were cultured in RPMI complete medium
(RPMI 1640 medium supplemented with 10% fetal bovine serum, 2 mM L-glutamine,
minimum non-essential amino acids, sodium pyruvate, 25 mM HEPES, and
penicillin-streptomycin [Gibco]). CTLL-2 cells purchased from ATCC were cultured
in RPMI complete with 10% T-STIM culture supplement with ConA (Corning). 24
hours prior to signaling studies, CTLL-2 cells were resuspended in RPMI lacking
T-STIM culture supplement for IL-2 starvation. Viability (>95%) of CTLL-2
cells was verified by trypan blue exclusion (counted in a hemocytometer)
immediately before performing the signaling assays. All cells were maintained at
37°C in a humidified atmosphere with 5% CO2. The subpopulation
of YT-1 cells expressing IL-2Rα was purified via magnetic selection as
described previously
39
.
Enrichment and persistence of IL-2Rα expression were monitored by
analysis of PE-conjugated anti-human IL-2Rα (Biolegend) antibody binding
on an Accuri C6 flow cytometer (BD Biosciences).
Circular dichroism (CD):
Far-ultraviolet CD measurements were carried out with an AVIV
spectrometer model 420 in PBS buffer (pH 7.4) in a 1 mm path-length cuvette with
a protein concentration of ~0.20 mg/ml (unless otherwise mentioned in the
text). Temperature melts where from 25 to 95 °C and monitored absorption
signal at 222 nm (steps of 2 °C/min, 30 s of equilibration by step).
Wavelength scans (195–260 nm) were collected at 25°C and
95°C, and again at 25°C after fast refolding (~5 min).
Binding studies:
Surface plasmon resonance (SPR): For IL-2 receptor affinity titration
studies, biotinylated human or mouse IL-2Rα, IL-2Rβ, and
IL-2RƔc receptors were immobilized to streptavidin-coated
chips for analysis on a Biacore T100 instrument (GE Healthcare). An irrelevant
biotinylated protein was immobilized in the reference channel to subtract
non-specific binding. Less than 100 response units (RU) of each ligand was
immobilized to minimize mass transfer effects. Three-fold serial dilutions of
hIL-2, mIL-2, Super-2, or engineered IL-2 mimetics, were flowed over the
immobilized ligands for 60 s and dissociation was measured for 240 s. For
IL-2RβƔc binding studies, saturating concentrations
of hIL-2Rβ (3 uM) or mIL-2Rβ (5 uM) were added to the indicated
concentrations of hIL-2 or mIL-2, respectively. Surface regeneration for all
interactions was conducted using 15 s exposure to 1 M MgCl2 in 10 mM sodium
acetate pH 5.5. SPR experiments were carried out in HBS-P+ buffer (GE
Healthcare) supplemented with 0.2% bovine serum albumin (BSA) at 25°C and
all binding studies were performed at a flow rate of 50 L/min to prevent analyte
rebinding. Data was visualized and processed using the Biacore T100 evaluation
software version 2.0 (GE Healthcare). Equilibrium titration curve fitting and
equilibrium binding dissociation (KD) value determination was implemented using
GraphPad Prism assuming all binding interactions to be first order. SPR
experiments were reproduced three times with similar results. Biolayer
interferometry: binding data were collected in a Octet RED96 (ForteBio, Menlo
Park, CA) and processed using the instrument’s integrated software using
a 1:1 binding model. Biotinylated target receptors, either human or murine
IL-2Rα, IL-2Rβ or Ɣc were functionalized to
streptavidin-coated biosensors (SA ForteBio) at 1μg/ml in binding buffer
(10 mM HEPES [pH 7.4], 150 mM NaCl, 3 mM EDTA, 0.05% surfactant P20, 0.5%
non-fat dry milk) for 300 seconds. Analyte proteins were diluted from
concentrated stocks into binding buffer. After baseline measurement in binding
buffer alone, the binding kinetics were monitored by dipping the biosensors in
wells containing the target protein at the indicated concentration (association
step) and then dipping the sensors back into baseline/buffer (dissociation). For
heterodimeric receptor binding experiments for
IL-2RβƔc, Ɣc was bound to the sensor
while IL-2Rβ was in solution at saturating concentrations(i.e. at least
~2.5 fold molar excess over the Kd).
STAT5 phosphorylation studies:
In vitro studies: Approximately 2×10⁵
YT-1, IL-2Rα+ YT-1, or starved CTLL-2 cells were plated in
each well of a 96-well plate and re-suspended in RPMI complete medium containing
serial dilutions of hIL-2, mIL-2, Super-2, or engineered IL-2 mimetics. Cells
were stimulated for 15 min at 37°C and immediately fixed by addition of
formaldehyde to 1.5% and 10 min incubation at room temperature. Permeabilization
of cells was achieved by resuspension in ice-cold 100% methanol for 30 min at
4°C. Fixed and permeabilized cells were washed twice with FACS buffer
(phosphate-buffered saline [PBS] pH 7.2 containing 0.1% bovine serum albumin)
and incubated with Alexa Fluor® 647-conjugated anti-STAT5 pY694 (BD
Biosciences) diluted 1:50 in FACS buffer for 2 hr at room temperature. Cells
were then washed twice in FACS buffer and MFI was determined on a CytoFLEX flow
cytometer (Beckman-Coulter). Dose-response curves were fitted to a logistic
model and half-maximal effective concentration (EC50 values) and
corresponding 95% confidence intervals were calculated using GraphPad Prism data
analysis software after subtraction of the mean fluorescence intensity (MFI) of
unstimulated cells and normalization to the maximum signal intensity.
Experiments were conducted in triplicate and performed three times with similar
results. Ex vivo studies: Spleens and lymph nodes were
harvested from wild-type C57BL/6J or B6;129S4-Il2ratm1Dw (CD25KO)
mice purchased from The Jackson Laboratory and made into a single cell
suspension in sort buffer (2% Fetal Calf Serum in pH 7.2 phosphate-buffered
saline). CD4+ T cells were enriched through negative selection by staining the
cell suspension with biotin-conjugated anti-B220, CD8, NK1.1, CD11b, CD11c,
Ter119, and CD19 antibodies at 1:100 for 30 min on ice. Following a wash with
sort buffer, anti-biotin MicroBeads (Miltenyi Biotec) were added to the cell
suspension at 20 μL per 107 total cells and incubated on ice
for 20 minutes. Cells were washed and then resuspended. Negative selection was
then performed using EasySep Magnets (STEMCELL Technologies). Approximately 1
×105 enriched cells were added to each well of a 96-well
plate in RPMI complete medium with 5% FCS with 10-fold serial dilutions of
mIL-2, Super-2, or Neo-2/15. Cells were stimulated for 20 min at 37°C in
5% CO2, fixed with 4% PFA and incubated for 30 minutes at 4°C.
Following fixation, cells were harvested and washed twice with sort buffer and
again fixed in 500 μL 90% ice-cold methanol in dH2O for 30 min
on ice for permeabilization. Cells were washed twice with Perm/Wash Buffer (BD
Biosciences) and stained with anti-CD4-PerCP in Perm/Wash buffer (1:300),
anti-CD44-Alexa Fluor 700 (1:200), anti-CD25-PE-Cy7 (1:200), and 5 μL per
sample of anti-pSTAT5-PE pY694 for 45 min at room temperature in the dark. Cells
were washed with Perm/Wash and re-suspended in sort buffer for analysis on a BD
LSR II flow cytometer (BD Biosciences). Dose-response curves were fitted to a
logistic model and EC50 values and corresponding 95% confidence intervals were
determined using GraphPad Prism data analysis software after subtraction of the
MFI of untreated cells and normalization to the maximum signal intensity.
Experiments were performed in triplicate and repeated three times with similar
results.
In vivo murine airway inflammation experiments:
Mice (C57BL/6J, purchased from The Jackson Laboratory) were inoculated
intranasally with 20μL of whole house dust mite antigen (Greer)
resuspended in PBS to a total of 23μg Derp1 per mouse. From Days
1–7, mice were given a daily intraperitoneal injection of 20μg
mIL-2 in sterile PBS (pH 7.2), a molar equivalent of Neo-2/15 in sterile PBS, or
no injection. On Day 8, circulating T cells were intravascularly labeled and
tetramer-positive cells were enriched from lymph nodes and spleen or lung as
previously described (Hondowicz, Immunity, 2016). Both the column flow-through
and bound fractions were saved for flow cytometry analysis. Cells were surface
stained with antibodies and analyzed on a BD LSR II flow cytometer with BD
FACSDiva software (BD Biosciences). Antibodies used: FITC anti-Ki67, clone
SolA15, PerCP-Cy5.5 anti-CD25, clone PC61, eFluor 450 anti-Foxp3, clone FJK-16S,
BV510 anti-CD8, clone 53–6.7, BV605 anti-PD-1, clone J43, BV711 anti-CD4,
clone RM4–5, BV786 anti-CD62L, clone MEL-14, PE anti-CD69, clone H1.2F3,
PE-CF594 anti-B220, clone RA3–6B2, PE-Cy7 anti-CXCR5, clone 2G8 and
BUV395 anti-Thy1.2, clone 53–2.1. All flow cytometry files were analyzed
using FlowJo 9.9.4 and statistical analysis was performed using Prism 7. All
experiments were performed in accordance with the University of Washington
Institutional Care and Use Committee guidelines.
Colorectal carcinoma in vivo mice experiments:
CT26 cells were sourced from Jocelyne Demengeot’s research group
at IGC (Instituto Gulbenkian de Ciência), Portugal. On day 0, 5 ×
10^5 cells were injected subcutaneously (s.c.) into the flanks of BALB/c mice
purchased from Charles River with 50 μL of a 1:1 mixture of
Dulbecco’s modified Eagle medium (Gibco) with Matrigel (Corning).
Starting on day 6, when tumor volume reached around 100mm3, Neo-2/15 and mIL-2
(Peprotech) were administered daily by intraperitoneal (i.p.) injection in 50
μL of PBS (Gibco). Mice were sacrificed when tumor volume reached 1,300
mm3. BALB/c mice were purchased from Charles River. Flow
cytometry: All reagents were purchased from Gibco by Life
Technologies (Thermo Fisher Scientific) unless stated otherwise. Excised tumors
were minced and digested using a mix of collagenase I, collagenase IV
(Worthington) and DNase I (Roche) in a shaker for 20 minutes, 250 rpm at
37°C. After digestion, samples were passed through a 100μm cell
strainer, and resuspended in cold complete RPMI 1640 medium, supplemented with
10 mM of HEPES buffer, 1 mM of sodium pyruvate, 50μM of
2-mercaptoethanol, 100 U/mL of penicillin and 100 μg/mL of streptomycin
and complemented with 1% non-essential amino acids (NEAA), 1% GlutaMAX
supplement and 10% heat-inactivated fetal bovine serum (HI FBS). The cell
suspensions from the spleens and the inguinal lymph nodes were obtained through
the smashing of the tissues against the filter of a 100μm cell strainer.
Cells were resuspended in PBS with 2% FBS and 1mM EDTA and stained for
extracellular markers for 45 min at 4°C. Cell suspensions were then
fixed, permeabilized and stained for intracellular markers using the
eBioscience™ Foxp3 / Transcription Factor Staining Buffer Set from
ThermoFisher Scientific. Samples were analyzed in a BD LSRFortessa™ flow
cytometer equipped with a BD FACSDiva software™ and data were analyzed in
FlowJo V10 software and the statistical analysis performed using Prism 5.
Antibodies (BioLegend) used in colon carcinoma experiments were: CD45-BV510
(30-F11), CD3-BV711 (17A2), CD49b-FITC (DX5), CD4-BV605 (RM4–5),
CD8-PECy7 (53–6.7), and Foxp3-APC (FJK-16s; eBioscience). Fixable
Viability Dye eFluor 780 (eBioscience) was used to exclude dead cells. Animals
were maintained according to protocols approved by the Direção
Geral de Veterinária and iMM Lisboa ethical committee.
Melanoma in vivo experiments:
B16F10 cells were purchased from ATCC. On day 0, 5×10⁵
cells were inoculated into the mice (C57BL/6J purchased from Jackson) by s.c.
injection in 500 μL of Hank’s Balanced Salt Solution (Gibco).
Starting on the specified day, Neo-2/15 or mIL-2 (Peprotech) treatments were
administered daily by intraperitoneal (i.p.) injection in 200 μL of
LPS-free PBS (Teknova). Treatment with TA99 (a gift from Noor Momin and Dane
Wittrup, Massachusetts Institute of Technology) at 150 μg/mouse was added
later at the (as indicated). Mice were sacrificed when tumor volume reached
2,000 mm3. Flow cytometry: Excised tumors were minced,
enzymatically digested (Miltenyi Biotec), and passed through a 40-μm
filter. Cells from spleens and tumor-draining lymph nodes were dispersed into
PBS through a 40-μm cell strainer using the back of a 1-mL syringe
plunger. All cell suspensions were washed once with PBS, and the cell pellet was
resuspended in 2% inactivated fetal calf serum containing fluorophore-conjugated
antibodies. Cells were incubated for 15 minutes at 4°C then fixed,
permeabilized, and stained using a BioLegend FoxP3 staining kit. Samples were
analyzed on a BD Fortessa flow cytometer. Antibodies (BioLegend) used in
melanoma experiments were: CD45-BV711 (clone 30-F11), CD8-BV650 (53–6.7),
CD4-BV421 (GK1.5), TCRβ-BV510 (H57–597), CD25-AF488 (PC61),
FoxP3-PE (MF-14). Animals were maintained according to protocols approved by
Dana–Farber Cancer Institute (DFCI) Institutional Animal Care and Use
Committee.
Generation of anti-Neo-2/15 polyclonal antibody:
Mice (C57BL/6J purchased from Jackson) were injected i.p . with 500
μg of K.O. Neo-2/15 in 200 μL of a 1:1 emulsion of PBS and
Complete Freund’s Adjuvant. Mice were boosted on days 7 and 15 with 500
μg of K.O. Neo-2/15 in 200 μL of a 1:1 emulsion of PBS and
Incomplete Freund’s Adjuvant. On day 20, serum was collected and
recognition of Neo-2/15 was confirmed by ELISA. For the ELISA, plates were
coated with Neo-2/15, K.O. Neo-2/15, or mIL-2 mixed with ovalbumin for a total
of 100 ng/well in carbonate buffer. Coated plates were incubated with murine
serum diluted 1:1000 in PBS. Binding was detected using anti-mouse IgG
conjugated to HRP and developed with TMB. Results were quantified using
absorption at 450 nm.
Enzyme-linked immunosorbent assay (ELISA):
High-binding 96-well plates (Corning) were coated overnight at
4°C with 100 ng/mL of Neo-2/15, mIL-2 (Peprotech), hIL-2 (Peprotech), or
ovalbumin (Sigma-Aldrich) in carbonate buffer. Antibody binding to target
proteins was detected using HRP-conjugated sheep anti-mouse IgG (GE Healthcare)
at 75 ng/mL. Plates were developed with tetramethylbenzidine and HCl. Absorbance
was measured at 450 nm with an EnVision Multimode Plate Reader
(PerkinElmer).
T cell proliferation assay:
Cells were isolated from mice (C57BL/6J purchased from Jackson) spleens
using the EasySep T Cell Isolation Kit (Stemcell Technologies). Cells were
plated in RPMI in 96-well culture plates at a density of 10,000 cells/well.
Media were supplemented with regular or heat-treated Neo-2/15, rmIL-2, or
Super-2 (as indicated). After 5 days of incubation at 37°C, cell survival
and proliferation were measured by CellTiter-Glo Luminescent Cell Viability
Assay (Promega).
In vivo experiments:
For Treg expansion experiments (Figure
4a), naive C57BL/6 mice were treated daily with Neo-2/15 or mIL-2 at
the indicated concentrations (n=2–3 per group). After 14 days, spleens
were harvested and analyzed by flow cytometry using the indicated markers; For
immunogenicity experiments (Figure 4c),
C57BL/6 mice were inoculated with 5×10⁵ B16F10 cells by subcutaneous
injection. Starting on day 1, mice were treated daily with Neo-2/15 (10
μg) or equimolar mIL-2 by intraperitoneal (i.p.) injection (n=10 for each
group). After 14 days, serum (antiserum) was collected and IgG was detected by
ELISA in plates coated with fetal bovine serum (FBS 10%, negative control),
Neo-2/15, mIL-2, hIL-2, or Ovalbumin (OVA) as a negative control. Polyclonal
mouse IgG against Neo-2/15 (Anti-Neo-2/15 pAb) was generated using complete
Freund’s adjuvant in conjunction with a knockout of Neo-2/15
(“K.O. Neo-2/15”, which is an inactive double point mutant of
Neo-2/15: Y14D, F99D); For Colorectal cancer experiments (Figure 4d), BALB/C mice
were inoculated with CT26
tumors. Starting on day 6, mice were treated daily with i.p. injection of mIL-2
or Neo-2/15 (10 μg), or left untreated (n = 5 per group); For Melanoma
experiments (Figure 4e), C57BL/6 mice were
inoculated with B16 tumors as in “a)”. Starting on day 1, mice
were treated daily with i.p. injection of Neo-2/15 (10 μg) or equimolar
mIL-2 (n = 10 per group). Twice-weekly treatment with TA99 was added on day 3.
Mice were euthanized when weight loss exceeded 10% of initial weight or when
tumor size reached 2,000 mm3; For CD8+ : Treg ratio in Melanoma
experiments (Figure 4f), C57BL/6 mice were
inoculated with B16 tumors and treated by daily i.p. injection as indicated.
Treatment with TA99 (bottom plot) was started on day 5 and continued
twice-weekly. Tumors were harvested from mice when they reached 2,000 mm3 and
analyzed by flow cytometry. The CD8+ : Treg cell ratio was calculated
by dividing the percentage CD45+ TCRβ+ cells that were CD8+ by the
percentage that were CD4+ CD25+ FoxP3+.
CAR-T cell in vivo experiments:
In vitro T cell proliferation assay. Primary human T cells were obtained
from healthy donors, who provided written informed consent for research
protocols approved by the Institutional Review Board of the FHCRC. Peripheral
blood mononuclear cells (PBMC) were isolated by centrifugation over
Ficoll-Hypaque (Sigma). T cells were isolated using EasySep™ CD8 or CD4
negative isolation kits (STEMCELL Technologies). To stimulate T cells, T cells
were thawed and incubated with anti-CD3/CD28 Dynabeads (Gibco) at 1:1 ratio in
media supplemented with 50 IU/ml (3.1ng/ml) of IL2. Beads were removed after
four days of incubation. Stimulated or freshly thawed unstimulated T cells were
plated at 30000 or 50000 cells/well, respectively, in 96 well format and
cultured in indicated concentrations of IL-2 or Neo-2/15 in triplicate. Three
days later, proliferation was measured using CellTiter-Glo 2.0. (Promega). In
vivo RAJI experiment: The FHCRC Institutional Animal Care and Use Committee
approved all mouse experiments. Six- to eight-week-old NSG mice were obtained
from the Jackson Laboratory. 0.5*10^6 RAJI tumor cells transduced with
(ffLuc)-eGFP were tail vein injected into the NSG mice. Seven days post tumor
inject, lentiviral transduced anti-CD19 CAR T cells (0.4*10^6 CD4, 0.4*10^6 CD8)
prepared as described in (Liu et al, 2016) were infused i.v. into mice. hIL2 or
Neo-2/15 at 20μg/mouse were given i.p. from day 8 to 16 post tumor
injection.
Disulfide-stapling Neo-2/15 to increase its stability and binding
potency.
Neo-2/15 is highly modular, allowing to further tune its properties.
As proof of concept, we designed stability enhancing disulfide staples that
preserve the protein’s function intact
55
. Two computational design strategies
were tested, first, we designed internal disulfide bridges for all pairs of
positions with favorable geometrical arrangements inside of Neo-2/15. The
four best disulfide-stapled designs (i.e. with the most favorable energy and
minimal geometric distortion) were recombinantly expressed (E.
coli). A design that bridges residues 38–75 (stabilizing
helices H3->H2’) was confirmed to be monomeric (SEC-MALS). In
the second approach, we remodeled the N- C-terminus of Neo-2/15 to allow the
introduction of a single-disulfide staple encompassing the entire protein.
We generated a total of 330 models that were then filtered based on fragment
quality and disulfide bond geometry. Finally, the designs were manually
inspected and six were selected (representing a diversity of insertion
lengths) and experimentally characterized as described above. One design,
replacing the terminal residues P- and -S with the amino acid sequences
CNSN- and -NFQC (N- and C-termini, respectively) (extended Fig. E3) was confirmed
to be monomeric
(SEC-MALS). The designs from both disulfide stapling strategies successfully
increased the stability of Neo-2/15 (Tm > 95°C) and its
binding potency (extended Fig. E3).
Pharmacodynamics and pharmacokinetics of Neo-2/15 in mice.
We assessed the in vivo duration of pSTAT5
signaling response to Neo-2/15 in peripheral blood lymphocytes of naive mice
(CD8 and B cells, see extended Fig.
E6). As expected, Neoleukin-2/15 has a significant effect (similar to
mIL-2) in CD8 cell signaling one-hour after administration, but as expected
from Neo-2/15 small size, the signaling effect decreases greatly after
3-hours (see extended Fig. E6) and is
undetectable after 8-hours (data not shown). This suggests that future
engineering of Neo-2/15 to extend half-life --there are a number of
approaches such as Fc-fusions, site-specific PEGylation (e.g. through
engineered cysteines, such as those demonstrated in SI Figure S14), fusions to
targeting domains (e.g. mAbs, sdAbs or VHHs
12,56
, DARPins
56
, or de novo designed binding proteins
35,57,58
) can be
used to extend its half-life and would likely translate into improved
pharmacokinetics.
Molecular dynamics (MD) simulations of apo-Neo-2/15 and
holo-Neo-2/15.
Molecular dynamics (MD) simulations in explicit water solvent
initiated from the computational model of apo-Neo-2/15 recapitulated the
crystallographic structure of (monomeric) apo-Neo-2/15 (avg
r.m.s.dCα to crystal structure = 1.9 Å, see
extended Fig. E7a). For instance,
MD simulations initiated from the ternary complex of Neo-2/15 with the
mIL-2RβƔc were more likely to sample the
crystallographic structure observed for Neo-2/15 in the ternary complex with
mIL-2RβƔc, including the outward movement of
helices H2’-H4 (Neo-2\15 avg r.m.s.dCα to crystal
structure = 1.4 Å, see extended Fig.
E7c). The conformation of Neo2/15 seems to be stabilized in the
ternary complexes (either with the murine or human receptors, see extended Fig. E7c–d).
Molecular Dynamics simulations were performed
using GROMACS 2018.1
59,60
with the Amber99SB-ILDN
force field
61
. Each system
consisted of the protein in a solvated dodecahedron box (min initial
distance from the protein to the boundary = 1 nm) filled with explicit TIP3P
waters
62
and
neutralized with Cl− or Na+ ions. The solvated
systems were energy-minimized using the steepest descent minimization
method, followed by equilibration for 200 ps under the NPT ensemble with
position restraints (1000 kJ mol−1 nm−1,
applied on all the proteins’ heavy atoms). Pressure coupling to 1 atm
was performed with the Berendsen barostat
63
, and the temperature was coupled to
310 K using the velocity-rescaling thermostat. The equilibrated systems were
used as starting conformations for production runs. In the case of the
monomers, we performed 5 independent production simulations of 100 ns/each,
and for the complexes bound to any of the IL-2 receptors, we performed 5
independent simulations of 90 ns/each. The production simulations were
conducted under the NPT ensemble, with the Parrinello-Rahman
barostat
64
for
pressure coupling to 1 atm. The cutoff for van der Waals and short-range
electrostatic interactions was set to 1 nm. Long-range electrostatic
interactions were treated with the Particle-Mesh Ewald (PME) summation
method
65
, and the
Verlet cut-off scheme was used
66
. The LINCS algorithm was used to constrain all chemical
bonds and allow an integration time-step of 2 fs. The simulation
trajectories were recorded every 20 ps and were analyzed using GROMACS.
Statistical and power analyses:
For statistical test a P-value of less than 0.05 considered significant,
unless otherwise noted. For comparison of fitted curves in cellular
phospho-STAT5 signaling assays, differences in EC50 values were
considered statistically significant if their 95% confidence intervals did not
overlap. In vivo airway inflammation experiments: comparison of cell populations
were performed using a two-tailed t-test. In vivo murine Colon cancer
experiments: comparisons of the survival of tumor-bearing mice were performed
using the log-rank Mantel-cox test (95% confidence interval). Comparisons of
weight loss in tumor-bearing mice were performed using a two-tailed t-test. In
vivo murine Melanoma experiments: comparisons of the survival of tumor-bearing
mice were performed using the log-rank Mantel-cox test (95% confidence
interval). Comparisons of weight loss in tumor-bearing mice were performed using
a two-tailed t-test. The minimum group size was determined using G*Power for an
expected large effect size (Cohen’s d = 1.75). For all the bar-plots, the
whiskers represent ∓1-standard deviation and individual data points are
shown (as dots) for experiments where the n<5. Unless otherwise noted,
results were analyzed by one-way ANOVA, if significant (95% confidence
interval), post-hoc t-tests were performed comparing groups, and P-values
adjusted for multiple comparisons are reported.
Software:
The design of de novo protein mimics was performed
using custom code (i.e. “Protein Mimic Designer”) programmed in
Python
67
,
IPython
68
, and using
the scientific high-performance modules: PyRosetta
42
, numpy and scipy
69,70
, matplotlib
71
, sklearn
72
, cython
73
and pandas
74
. Data analyses
were performed with custom code in Python and IPhyton. Protein sequence design
was performed with Rosetta
40,41
and RosettaScripts
40
. Protein visualization was
performed using PyMOL
75
.
Simple protein-protein sequence alignments were performed using BLASTP, and
structural based sequence comparisons were performed using MICAN
76
. Sequence logos were generated
with WebLogo
77
.
Data availability:
PDB structures for Neo-2/15 monomer and its ternary complex with
mIL-2RβƔc are available in the RCSB Protein Data
Bank (PDB IDs: 6DG6 and 6DG5, respectively), diffraction images have been
deposited in the SBGrid Data Bank (IDs: 587 and 588, respectively) and
validation reports are part of the supplementary information. The de
novo “Protein Mimic Designer” algorithm and databases
used for designing the protein mimetics are available in the online repository
Zenodo (doi: “to be provided with the final manuscript”). Other
data and materials are available upon request to the corresponding authors.
Extended Data
Figure E1.
Therapeutic effect of Neo-2/15 on colon cancer.
a) BALB/C mice were inoculated with CT26 tumors.
Starting on day 9 and ending on day 14, mice were treated daily with
i.p. injection of mIL-2 or Neo-2/15 at the specified concentrations (n =
4 per group), or were left untreated (n=6 per group). Tumor growth
curves (top) show data only for surviving mice and stop if a mice/group
fell below 50% of the initial number of subjects. Survival curves
(bottom). Mice were euthanized when weight loss
exceeded 10% of initial weight or when tumor size reached 1,300
mm3. The experiments were performed twice with similar
results. b-d) The bar-plots compare the T cell populations
for BALB/C mice (n=3 per group) that were inoculated with CT26 tumors
and treated starting from day 6 with by daily i.p. injection of
10μg of Neo-2/15 or 10μg mIL-2 or no-treatment (No Tx). On
day 14 the percentage of Treg cells (CD4+ CD45+
FoxP3+, top graph) and CD8:Treg cell ratio
((CD45+ CD3+ CD8+ )/ Treg, bottom
graph) was assessed in: b) tumors, c) neighboring inguinal lymph node
(LN), and d) spleen. Whiskers represent ∓1-standard deviation and
are centered in the mean. Results were analyzed by one-way ANOVA (95%
confidence interval), except for survival curves that were assessed
using the Mantel-cox test (95% confidence interval). The experiments
performed twice with similar results. In all cases, whiskers are
centered on the mean and in bar plots represent ∓1-standard
deviation, while in growth curves represent ∓1-standard error of
the mean. Results were analyzed by one-way ANOVA (95% confidence
interval), except for survival curves that were assessed using the
Mantel-cox test (95% confidence interval).
Figure E2.
Therapeutic effect of Neo-2/15 on melanoma.
Survival curves (top) and tumor growth curves
(bottom) for C57BL/6 mice that were inoculated with
B16 tumors (as in Fig. 4a) and
treated with low (1 μg/mice/day) or high doses of Neo-2/15 (10
μg/mice/day). a) Starting on day 1, mice (n = 5 per
group) were treated daily with i.p. injection of
left: single agent Neo-2/15 at 1
μg/mice or equimolar mIL-2, or right: the
same treatments in combination a twice-weekly treatment with TA99
(started on day 5). Mice were euthanized when tumor size reached 2,000
mm3. Tumor growth curves show data only for surviving
mice and stop if a mice/group fell below 50% of the initial number of
subjects. The experiments were performed twice with similar results;
b) similar to “a”, but starting on day 4,
mice (n = 5 per group) were treated daily with i.p. injection of
left: single agent Neo-2/15 at 10
μg/mice or equimolar mIL-2; right: the
same treatments in combination a twice-weekly treatment with TA99
(started on day 4). Mice were euthanized when tumor size reached 1,000
mm3. The therapeutic effect of Neo-2/15 is dose-dependent
(higher doses are better) and is potentiated in the presence of the
antibody TA99. Tumor growth curves show data only for surviving mice and
stop if a mice/group fell below 50% of the initial number of subjects.
The experiments were performed twice with similar results;
c) C57BL/6 mice were immunized with 500 μg K.O.
Neo-2/15 in complete Freund’s adjuvant and boosted on days 7 and
15 with 500 μg K.O. Neo-2/15 in incomplete Freund’s
adjuvant. Reactivity against K.O. Neo-2/15 and native Neo-2/15 and
cross-reactivity with mIL-2 were determined by incubation of serum
(diluted 1:1000 in PBS) with plate-bound K.O. Neo-2/15, Neo-2/15, or
mIL-2 as indicated. Serum binding was detected using an anti-mouse
secondary antibody conjugated to HRP followed by incubation with TMB.
Data are reported as optical density at 450 nm.
Top: naive mouse serum;
bottom: immunized serum. The experiments were
performed once. In all the growth curves the whiskers represent
∓1-standard error of the mean. Results were analyzed by one-way
ANOVA (95% confidence interval), except for survival curves that were
assessed using the Mantel-cox test (95% confidence interval).
Figure E3.
Single disulfide-stapled variants of Neo-2/15 with higher thermal
stability.
Structural models of disulfide-stabilized variants of Neo-2/15
(gray) are shown superposed on the ternary crystal structure of Neo-2/15
(red) with mutated residues highlighted in magenta and the disulfide
bond shown in gold. Two strategies were used to generate the disulfide
stapled variants: a) (top) internal placement of the
disulfide linking residues 38 and 75. The plot at the
(bottom) is the experimental CD spectra of the design
at 25°C, 95°C and then cooled back to 25°C,
complete ellipticity-spectra recovery (full reversibility) upon cooling
was observed; b) (top) for the terminal disulfide variant,
three residues were added to each terminus in order to allow the
disulfide to be formed without generating distortions to
Neo-2/15’s structure. The plot at the (bottom) is
the experimental CD spectra of the design at 25°C, 95°C
and then cooled back to 25°C, complete ellipticity-spectra
recovery (full reversibility) upon cooling was observed; c)
thermal melts of each disulfide variant in panel “a) and
b)” were followed by its circular dichroism signal (222 nm) from
25°C to 95°C (heating rate ~2°C/min). Each
of the disulfide-stapled variants shows improved stability relative
native Neo-2/15; d) the binding strength of each disulfide
variant was measured by biolayer interferometry, showing that the
introduction of the disulfide bonds does not disrupt binding.
Furthermore, both disulfide variants exhibit an improvement in binding
IL-2Rβγc (Kd ~ 1.3 ± 0.49 and
1.8 ± 0.26 nM, for the internal and external disulfide-staples,
respectively), compared to Neo-2/15 (Kd ~ 6.9 ± 0.61 nM
for) under the same experimental conditions. These results are
consistent with the expected effect of disulfide-induced stabilization
on a de novo protein binding site
55
. Thermal denaturation experiments performed 3
times with similar results, and binding experiments were performed
once.
Figure E4.
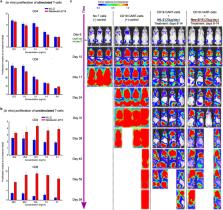
The stimulatory effect of Neo-2/15 on human CAR-T cells.
a) Anti-CD3/CD28 stimulated or b)
unstimulated human primary CD4 (top) or CD8 (bottom) T cells were
cultured in indicated concentrations of human IL-2 or Neo-2/15. T cell
proliferation is measured as fold change over T cells cultured without
IL-2 supplement. The experiments were performed 3 times with similar
results. Whiskers represent ∓1-standard deviation and are
centered in the mean; c) NSG mice inoculated with
0.5×10^6 RAJI tumor cells were treated with 0.8×10^6
anti-CD19 CAR-T cells 7 days post tumor inoculation. Tumor growth was
analyzed by bioluminescence imaging. The experiment was performed
once.
Figure E5.
Immunogenicity of Neo-2/15 in healthy naive mice.
a) Naive C57BL/6 mice were treated daily with
Neo-2/15 (n = 10), K.O. Neo-2/15 (n = 5), mIL-2 (n = 5) or left
untreated (n = 5). After 28 days, blood was drawn and analyzed. IgG
against Neo-2/15, mIL-2, hIL-2, K.O. Neo-2/15, and ovalbumin were
detected in treated-mouse sera diluted 1:100 by ELISA. 10% fetal bovine
serum was used as a negative control. Polyclonal antibody against
Neo-2/15 was used as a positive control. All statistical comparisons
between sera from treated mice and negative control serum were not
significant (two-way ANOVA with a 95% confidence interval). All
statistical comparisons between Neo-2/15 and mIL-2 treated mice serum
were not significant (two-way ANOVA with a 95% confidence interval). The
experiments were performed once. b) After 14 days, immune
cell populations in the blood of treated mice were quantified by flow
cytometry. B : T cell ratio (top right) was calculated by dividing the
percentage of B220+ cells by the percentage of CD3+ cells.
CD8+ : CD4+ cell ratio (top left) was
calculated by dividing the percentage of CD3+ cells that were CD8+ by
those that were CD4+. NK cells (bottom left) were identified by their
expression of NK1.1. Results were analyzed by one-way ANOVA (95%
confidence interval). The experiments were performed once. In all cases,
whiskers represent ∓1-standard deviation and are centered in the
mean.
Figure E6.
Kinetics of phosphorylation of STAT5 with Neo-2/15 treatment.
Naive C57BL/6 mice were treated once with 13 μg mIL-2 (n
= 5) or 10 μg Neo-2/15 (n = 5), or were left untreated (n = 5).
Phosphorylation of STAT5 was measured in peripheral blood at the
indicated time points by flow cytometry using an anti-pSTAT5 antibody
(eBioscience). Mean fluorescence intensity (MFI) is reported at each
time point for TCRβ+ CD8+ cells (top) and TCRβ- B220+
cells (bottom). Whiskers represent ∓1-standard deviation and are
centered in the mean. Results were analyzed by one-way ANOVA (75%
confidence interval). The experiments were performed once.
Figure E7.
Conformational flexibility of Neo-2/15 in MD simulations.
a) MD simulations started from the computational
model of Neo-2/15 (top) converged into structures
similar to the crystal conformation. Apo-Neo-2/15 is shown in red thick
tubes (chain A from PDBid: 6GD6) and 45 (randomly selected) MD
conformations from 5-independent MD simulations are shown in thin grey
tubes; (bottom) the plot shows the
r.m.s.d.Cα along 5-independent MD simulations (avg
r.m.s.d.Cα= 1.93 Å); b)
similar to “a)” but for (control) MD simulations started
from the crystallographic structure of hIL-2. (Top) The
crystal conformation of hIL-2 (chain A from PDBid: 2B5I) is shown in
blue thick tubes and 45 (randomly selected) MD conformations from
5-independent simulations are shown in thin grey tubes (avg
r.m.s.d.Cα= 2.02 Å); c)
(top) similar to “a-b” shows MD
structures for simulations started from the computational model of
Neo-2/15 bound to the hIL-2RβƔc;
(middle-top) the plot shows the
r.m.s.d.Cα along 5-independent MD simulations (avg
r.m.s.d.Cα to apo-Neo-2/15 (model)= 1.28
Å); (middle-bottom) shows the nearest
conformation (to the Apo-Neo-2/15 computational model) that were sampled
on each of the 5-independent MD simulations performed (structures from
the first 50ns of MD simulation were not considered);
(bottom) shows a 2d-scatter plot (and the
underlying density plot, where yellow, blue, green and purple colors
represent decreasing densities) that compares the
r.m.s.d.Cα (after discarding the first 50ns of MD
simulation) for Apo-Neo-2/15 (computational model)
versus the r.m.s.d.Cα for the
holo-crystal structure of Neo-2/15 (in complex with the murine
receptor). The conformations sampled by Neo-2/15 when in complex with
the hIL-2RβƔc are more similar to the
Apo-Neo-2/15 structure (computational model) than to the Neo-2/15
conformation observed in complex with the
mIL-2RβƔc receptor. d)
(top, middle-top and middle-bottom) analogous to
“c)” but for MD simulations started from the computational
model of Apo-Neo-2/15 in complex with the crystallographic structure of
the mIL-2RβƔc. The model of Apo-Neo-2/15 was
initially placed by simply aligning (TMalign) the ternary computational
model of Neo-2/15 with hIL-2RβƔc (from
“c)”) into the crystallographic structure of the
mIL-2RβƔc (PDBid: 6GD5), avg
r.m.s.d.Cα to holo-Neo-2/15 (murine) = 1.43
Å. (bottom) shows a 2d-scatter plot (and the
underlying density plot, where yellow, blue, green and purple colors
represent decreasing densities) that compares the
r.m.s.d.Cα (after discarding the first 50ns of MD
simulation) for Apo-Neo-2/15 (computational model)
versus the r.m.s.d.Cα for the
holo-crystal structure of Neo-2/15 (in complex with the murine
receptor). Different to what is observed in “c)”, the
conformations sampled by Neo-2/15 when in complex with the
mIL-2RβƔc are more similar to the Neo-2/15
conformation observed in the crystallographic structure of the ternary
complex of Neo-2/15 with the mIL-2RβƔc receptor
(see Figure 3). For clarity, all
the r.m.s.d.Cα plots were filtered (running average
filter, 5-frames = 100 ps), and the dots in the 2d scatter plots were
subsampled every 25-conformations (i.e. 500 ps), however the density
plot corresponds to all the conformations analyzed (i.e. the last 40ns
× 5 MD simulations were analyzed, and conformations were recorded
each 20ps).
Figure E8.
Overall sequence conservation in terms of binding for each of the
4-common helices combining the information from three different
de novo designed IL-2 mimics.
The sequence logos (WebLogo) were generated using the combined
data from in vitro binding experiments (against the heterodimeric
mIL-2Rβγc, see Methods) from 3 independent SSM mutagenesis
libraries for G2_neo2_40_1F_seq27, G2_neo2_40_1F_seq29 and
G2_neo2_40_1F_seq36 (SI Figs. S8–10). All of these proteins
are functional high-affinity mimetics of mice and human IL-2 (see SI Figures
S6–11), some with different topologies than Neo-2/15, but all
containing the four Helices H1, H3, H2’ and H4. The logos show
the combined information for each helix independently. Below each logo,
a line graph shows the probability score (higher is more conserved) for
each amino acid in the Neo-2/15 sequence. A red line in these line
graphs highlights positions where the Neo-2/15 amino acid has a
probability score ≥ 30% (i.e. these amino acids contribute more
significantly to receptor binding as they are generally more enriched in
the binding populations of all of the tested mimics). The helix
represented by EACH logo is shown to the left of each logo in terms of
its topological position in Neo-2/15. The sequences of the Neo-2/15
helices and those of the corresponding helices (structurally aligned)
for natural hIL-2 (interleukin-2) and hIL-15 (interleukin-15) are shown
below the graphs, demonstrating the unique character of
Neo-2/15’s helices and binding interfaces.
Table E1.
Characterization of several de novo designed mimics of
IL-2/IL-15.
The table shows experimental and structural properties for
several de novo IL-2/IL-15 mimics. hIL-2, mIL-2, and
Super-2 are shown as references. The sequence similarity was calculated
by structural alignment against hIL-2 (PDB ID: 2B5I) or mIL-2 (PDB ID:
4YQX). The EC50 field refers to pSTAT5 cell-signaling that was measured
across six (6) independent experiments (denoted by the identifiers a-f
in parentheses). “N/S” stands for nonsignificant and
“N/A” for nonavailable. The binding and signaling
experiments were performed 3 times with similar results..
Binding affinity
(Kd) to mIL-2R0Yc, and cell signaling In human NK (YT, CD25-)
cells
Name
Kd hIL-2RβƔc
(nM)
Kd HIL-2Rβ
(nM)
EC50 (CD25-) pSTAT5p (nM) / (exp
i.d.)
Seq identity to HIL-2
(% / (num a.a. algn))
Seq identity to mIL-2 (%/
(num a.a. algn))
Exp. optimized
Parent molecule
a.a. length
hIL-2
193.6
326.9
0.41 / (a)
100.0 /
(120)
54.5/(112)
-
-
133
mIL-2
8034.0
4950.0
39.05 /(a)
54.5/(112)
100/(122)
-
-
130
Super-2 / Superkine (PDB:
3QAZ)
300.9
2.0
0.07/(a)
94.9/(117)
50.9/(114)
Y
hIL-2
133
G1_neo2_40
260.0
1457.0
0.14/(b)
47.7 / (86)
30.4/(79)
N
-
87
G1_neo2_41
187.0
720.6
0.07 / (b)
47.7 / (86)
30.4/(79)
N
-
87
G1_neo2_43
533.4
2861.0
0.21 / (b)
50.0/(86)
32.9/(79)
N
-
87
G1_neo2_40_1F
2.3
2.6
0.09/(c)
44.2/(86)
26.6/(79)
Y
G1_neo2_40
87
G2_neo2_40_1F_dsn36
113.9
27.6
0.12 / (a)
33.7 / (89)
17.6/(85)
N
De novo mimetic
design using template: G1 neo2 40 1F
100
Neoleukin-2/15
(G2_neo2_40_1F_dsn36)
18.8
11.2
0.05 / (a)
29.2 / (89)
15.7/(83)
Y
G2_neo2_40_1F_dan36
100
Binding affinity
(Kd) to mIL-2RβƔc, and cell signaling (EC50) in
murine T (CTLL-2, CD25+) cells
Name
Kd mIL-2RβƔc
(nM)
Kd mIL-2Rβ (nM)
EC50 (CD25+) PSTAT5
(nM) / (exp i.d.)
Seq Identity to hIL-2 (% / (num
a.a. algn))
Seq Identity to mIL-2 (% / (num
a.a. algn))
Exp. optimized
Parent molecule
a.a. length
hIL-2
492.2
8106.0
0.002/(d)
*see previous
table
mIL-2
126.2
1496.0
0.003/(e)
*see previous
table
Super-2 / Superkine (PDB:
3QAZ)
312.2
214.0
N/A
*see previous
table
G1_neo2_40_1F
7.9
485.5
0.2 / (e)
*see previous
table
G1_neo2_40_1F_H1
2654.0
6799.0
37.38 / (d)
39.5/(86)
25.0 / (80)
Y
G1_neo2_40_1F
87
G1_neo2_40_1F_H2
963.7
68300.0
9.38 / (d)
40.7/(86)
26.2 / (80)
Y
G1_neo2_40_1F
87
G1_neo2_40_1F_H3
3828.0
N/S
35.2 / (d)
39.5/(86)
25.0 / (80)
Y
G1_neo2_40_1F
87
G1_neo2_40_1F_H4
391.8
10070.0
0.93 / (d)
41.9/(86)
26.2 / (80)
Y
G1_neo2_40_1F
87
G1_neo2_40_1F_H5
5123.0
45300.0
84.69 / (d)
39.5/(86)
23.8 / (80)
Y
G1_neo2_40_1F
87
G1_neo2_40_1F_M1
4.3
213.9
0.007/(d)
36.0/(86)
25.0 / (80)
Y
G1_neo2_40_1F
87
G1_neo2_40_1F_M2
886.3
2599.0
3.11 /(d)
37.2 / (86)
25.0 / (80)
Y
G1_neo2_40_1F
87
G1_neo2_40_1F_M3
64.8
402.3
0.08/(d)
34.9/(86)
25.3 / (79)
Y
G1_neo2_40_1F
87
G2_neo2_40_1F_seq04
80.0
N/A
1.95
1 (f)
38.4/(86)
23.8 / (80)
N
Sequence redesign of
G1_neo2_40_1F
87
G2_neo2_40_1F_seq12
39.1
N/A
1.74/(0
38.4/(86)
25.3 / (79)
N
Sequence redesign of
G1_neo2_40_1F
87
G2_neo2_40_1F_seq16
71.5
N/A
2.20/(f)
34.9/(86)
22.5 / (80)
N
Sequence redesign of
G1_neo2_40_1F
87
G2_neo2_40_1F_seq26
27.8
N/A
1.06/(0
39.5/(86)
25.3 / (79)
N
Sequence redesign of
G1_neo2_40_1F
87
G2_neo2_40_1F_seq27
13.6
N/A
0.24/(0
36.0/(86)
25.0 / (80)
N
Sequence redesign of
G1_neo2_40_1F
87
G2_neo2_40_1F_dsn29
38.2
N/A
0.48/(f)
36.6/(82)
8.9 / (90)
N
De novo mimetic
design using template: G1 neo2 40 1F
107
G2_neo2_40_1F_dsn30
925.0
N/A
7.61 /(f)
33.0/(97)
23.4 / (94)
N
De novo mimetic
design using template: G1 neo2 40 1F
107
G2_neo2_40_1F_dsn36
568.5
2432.0
1.36 / (e)
*see previous
table
G2_neo2_40_1F_dsn40
69.2
N/A
0.50 1(f)
33.7 / (89)
17.9/(84)
N
De novo mimetic
design using template: G1 neo2 40 1F
100
Neoleukin-2/15
(G2_neo2_40_1F_dsn36)
38.4
16.1
0.07 /
(e)
*see previous
table
Table E2.
Crystallographic data table for (left) monomeric Neoleukin-2/15, and
(right) the quaternary complex of Neoleukin-2/15 with
mIL-2RβƔc.
Notes: *) Values in parentheses are for highest-resolution
shell; a) Statistics are for data that were truncated by STARANISO to
remove poorly measured reflections affected by anisotropy; b) The
resolution limits for three directions in reciprocal space are indicated
here. To accomplish this, STARANISO computed an ellipsoid post fitted by
least squares to the cutoff surface, removing points where the fit was
poor. Note that the cutoff surface is unlikely to be perfectly
ellipsoidal, so this is only an estimate; c) The anisotropic
completeness was obtained by least squares fitting an ellipsoid to the
reciprocal lattice points at the cutoff surface defined by a local mean
I/σI threshold of 1.0, rejecting outliers in the fit due to
spurious deviations (including any cusp), and calculating the fraction
of observed data lying inside the ellipsoid so defined. Note that the
cutoff surface is unlikely to be perfectly ellipsoidal, so this is only
an estimate..
Neoleukin-2/15 (6DG6)
Neoleukin-2/15 ternary complex
with mIL-2RβƔc (6DG5)
Data collection
Space group
P 21 21 21
P 21 2 21
Cell dimensions
a, b, c
(Å)
73.73,86.8, 92.31
65.125, 67.914, 172.084
α,β,γ
(°)
90, 90, 90
90, 90 ,90
Resolution (Å)
39.28 – 1.999(2.07
– 1.999)*
47.005–2.516(2.828–2.516)
Ellipsoidala resolution
limit (Å)
-
3.422 (a*)
(direction)b
-
2.407 (b*)
-
3.475 (c*)
R
sym
0.1027(1.709)
0.3590(2.516)
I/cl
12.19(1.25)
6.8 (1.3)
Completeness (%)
92.58 (77.83)
52.3 (9.0)
Completeness
(ellipsoidal)c (%)
93.2 (77.2)
Redundancy
8.7 (8.1)
9.5(11.2)
Refinement
Resolution (Å)
39.28 – 1.999(2.07
– 1.999)
47.005–2.516
No. reflections
37747(3125)
13923 (136)
R
work /
R
free
0.2037/0.2260
0.2211/0.2658
No. atoms
4791
4100
Protein
4735
3949
Ligand/ion
0
138
Water
56
13
B-factors
52.56
47.05
Protein
52.54
46.39
Ligand/ion
-
67.79
Water
54.21
27.31
R.m.s. deviations
Bond lengths
(Å)
0.005
0.004
Bond angles (°)
0.88
0.94
Supplementary Material
1
2
Related collections
Most cited references68
- Record: found
- Abstract: not found
- Article: not found
Python for Scientific Computing
Travis E. Oliphant (2007)
- Record: found
- Abstract: found
- Article: not found
ROSETTA3: an object-oriented software suite for the simulation and design of macromolecules.
Andrew Leaver-Fay, Michael Tyka, Steven M. Lewis … (2011)
- Record: found
- Abstract: found
- Article: not found