1
views
0
recommends
+1 Recommend
0 collections
    0
    shares
      • Record: found
      • Abstract: found
      • Article: found
      Is Open Access

      Regional differences and temporal trend analysis of Hepatitis B in Brazil

      research-article

      Read this article at

      Bookmark
          There is no author summary for this article yet. Authors can add summaries to their articles on ScienceOpen to make them more accessible to a non-specialist audience.

          Abstract

          Background

          Burden disease related to chronic HBV infection is increasing worldwide. Monitoring Hepatitis B occurrence is difficult due to intrinsic characteristics of the infection, nonetheless analyzing this information improves strategic planning towards reducing the burden related to chronic infection. In this line of thought, this study aims to analyze national and regional epidemiology of Hepatitis B and it’s temporal trends based on Brazilian reported cases.

          Methods

          Data obtained from the Brazilian National Notifiable Disease Reporting System (SINAN) from 2007 to 2018 were classified by infection status with an original classification algorithm, had their temporal trends analyzed by Joinpoint regression model and were correlated with gender, age and region.

          Results

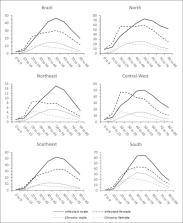
          Of the 487,180 hepatitis B cases notified to SINAN, 97.65% had it infection status correctly classified by the new algorithm. Hepatitis B detection rate, gender and age-distribution were different among Brazilian regions. Overall, detection rates remained stable from 2007 to 2018, achieving their maximal value (56.1 cases per 100,000 inhabitants) in North region. However, there were different temporal trends related to different hepatitis B status and age. Women mean age at notification were always inferior to those of men and the difference was higher in Central-West, North and Northeast regions.

          Conclusion

          Hepatitis B affects heterogeneously different populations throughout Brazilian territory. The differences shown in its temporal trends, regional, gender and age-related distribution helps the planning and evaluation of control measures in Brazil.

          Supplementary Information

          The online version contains supplementary material available at 10.1186/s12889-022-14296-1.

          Related collections

          Most cited references19

          • Record: found
          • Abstract: found
          • Article: found

          The global burden of viral hepatitis from 1990 to 2013: findings from the Global Burden of Disease Study 2013

          Background With recent improvements in vaccines and treatments against viral hepatitis, an improved understanding of the burden of viral hepatitis is needed to inform global intervention strategies. We used data from the Global Burden of Disease (GBD) Study to estimate morbidity and mortality for acute viral hepatitis, and for cirrhosis and liver cancer caused by viral hepatitis, by age, sex, and country from 1990 to 2013. Methods We estimated mortality using natural history models for acute hepatitis infections and GBD’s cause-of-death ensemble model for cirrhosis and liver cancer. We used meta-regression to estimate total cirrhosis and total liver cancer prevalence, as well as the proportion of cirrhosis and liver cancer attributable to each cause. We then estimated cause-specific prevalence as the product of the total prevalence and the proportion attributable to a specific cause. Disability-adjusted life-years (DALYs) were calculated as the sum of years of life lost (YLLs) and years lived with disability (YLDs). Findings Between 1990 and 2013, global viral hepatitis deaths increased from 0·89 million (95% uncertainty interval [UI] 0·86–0·94) to 1·45 million (1·38–1·54); YLLs from 31·0 million (29·6–32·6) to 41·6 million (39·1–44·7); YLDs from 0·65 million (0·45–0·89) to 0·87 million (0·61–1·18); and DALYs from 31·7 million (30·2–33·3) to 42·5 million (39·9–45·6). In 2013, viral hepatitis was the seventh (95% UI seventh to eighth) leading cause of death worldwide, compared with tenth (tenth to 12th) in 1990. Interpretation Viral hepatitis is a leading cause of death and disability worldwide. Unlike most communicable diseases, the absolute burden and relative rank of viral hepatitis increased between 1990 and 2013. The enormous health loss attributable to viral hepatitis, and the availability of effective vaccines and treatments, suggests an important opportunity to improve public health. Funding Bill & Melinda Gates Foundation.
            Bookmark
            • Record: found
            • Abstract: found
            • Article: found
            Is Open Access

            Estimating average annual per cent change in trend analysis

            Trends in incidence or mortality rates over a specified time interval are usually described by the conventional annual per cent change (cAPC), under the assumption of a constant rate of change. When this assumption does not hold over the entire time interval, the trend may be characterized using the annual per cent changes from segmented analysis (sAPCs). This approach assumes that the change in rates is constant over each time partition defined by the transition points, but varies among different time partitions. Different groups (e.g. racial subgroups), however, may have different transition points and thus different time partitions over which they have constant rates of change, making comparison of sAPCs problematic across groups over a common time interval of interest (e.g. the past 10 years). We propose a new measure, the average annual per cent change (AAPC), which uses sAPCs to summarize and compare trends for a specific time period. The advantage of the proposed AAPC is that it takes into account the trend transitions, whereas cAPC does not and can lead to erroneous conclusions. In addition, when the trend is constant over the entire time interval of interest, the AAPC has the advantage of reducing to both cAPC and sAPC. Moreover, because the estimated AAPC is based on the segmented analysis over the entire data series, any selected subinterval within a single time partition will yield the same AAPC estimate—that is it will be equal to the estimated sAPC for that time partition. The cAPC, however, is re-estimated using data only from that selected subinterval; thus, its estimate may be sensitive to the subinterval selected. The AAPC estimation has been incorporated into the segmented regression (free) software Joinpoint, which is used by many registries throughout the world for characterizing trends in cancer rates. Copyright © 2009 John Wiley & Sons, Ltd.
              Bookmark
              • Record: found
              • Abstract: found
              • Article: found
              Is Open Access

              Measuring underreporting and under-ascertainment in infectious disease datasets: a comparison of methods

              Background Efficient and reliable surveillance and notification systems are vital for monitoring public health and disease outbreaks. However, most surveillance and notification systems are affected by a degree of underestimation (UE) and therefore uncertainty surrounds the 'true’ incidence of disease affecting morbidity and mortality rates. Surveillance systems fail to capture cases at two distinct levels of the surveillance pyramid: from the community since not all cases seek healthcare (under-ascertainment), and at the healthcare-level, representing a failure to adequately report symptomatic cases that have sought medical advice (underreporting). There are several methods to estimate the extent of under-ascertainment and underreporting. Methods Within the context of the ECDC-funded Burden of Communicable Diseases in Europe (BCoDE)-project, an extensive literature review was conducted to identify studies that estimate ascertainment or reporting rates for salmonellosis and campylobacteriosis in European Union Member States (MS) plus European Free Trade Area (EFTA) countries Iceland, Norway and Switzerland and four other OECD countries (USA, Canada, Australia and Japan). Multiplication factors (MFs), a measure of the magnitude of underestimation, were taken directly from the literature or derived (where the proportion of underestimated, under-ascertained, or underreported cases was known) and compared for the two pathogens. Results MFs varied between and within diseases and countries, representing a need to carefully select the most appropriate MFs and methods for calculating them. The most appropriate MFs are often disease-, country-, age-, and sex-specific. Conclusions When routine data are used to make decisions on resource allocation or to estimate epidemiological parameters in populations, it becomes important to understand when, where and to what extent these data represent the true picture of disease, and in some instances (such as priority setting) it is necessary to adjust for underestimation. MFs can be used to adjust notification and surveillance data to provide more realistic estimates of incidence.
                Bookmark

                Author and article information

                Contributors
                xggrandi@gmail.com , giuliano.grandi@usp.br
                mnburatt@gmail.com
                Journal
                BMC Public Health
                BMC Public Health
                BMC Public Health
                BioMed Central (London )
                1471-2458
                17 October 2022
                17 October 2022
                2022
                : 22
                : 1931
                Affiliations
                [1 ]GRID grid.413463.7, ISNI 0000 0004 7407 1661, Infectious Diseases Division, Escola Paulista de Medicina, , Hospital São Paulo, Universidade Federal de São Paulo, ; São Paulo, SP Brazil
                [2 ]GRID grid.11899.38, ISNI 0000 0004 1937 0722, Institute of Mathematics and Statistics, , The University of São Paulo, ; São Paulo, SP Brazil
                [3 ]GRID grid.11899.38, ISNI 0000 0004 1937 0722, Discipline of Medical Informatics and LIM-01 HCFMUSP, School of Medicine, , The University of São Paulo, ; São Paulo, SP Brazil
                [4 ]GRID grid.65456.34, ISNI 0000 0001 2110 1845, Center for Internet Augmented Research and Assessment - CIARA, , Florida International University, ; Florida, USA
                [5 ]Present Address: Rua Botucatu, 740–5th floor. Room 507, CEP 04023-062 São Paulo, SP Brazil
                Author information
                http://orcid.org/0000-0003-3846-7506
                http://orcid.org/0000-0003-4097-6887
                http://orcid.org/0000-0002-5407-6890
                Article
                14296
                10.1186/s12889-022-14296-1
                9578265
                36253757
                3f042b29-f211-4342-adcc-dc86375c459e
                © The Author(s) 2022

                Open AccessThis article is licensed under a Creative Commons Attribution 4.0 International License, which permits use, sharing, adaptation, distribution and reproduction in any medium or format, as long as you give appropriate credit to the original author(s) and the source, provide a link to the Creative Commons licence, and indicate if changes were made. The images or other third party material in this article are included in the article’s Creative Commons licence, unless indicated otherwise in a credit line to the material. If material is not included in the article’s Creative Commons licence and your intended use is not permitted by statutory regulation or exceeds the permitted use, you will need to obtain permission directly from the copyright holder. To view a copy of this licence, visit http://creativecommons.org/licenses/by/4.0/. The Creative Commons Public Domain Dedication waiver ( http://creativecommons.org/publicdomain/zero/1.0/) applies to the data made available in this article, unless otherwise stated in a credit line to the data.

                History
                : 18 August 2022
                : 22 September 2022
                Funding
                Funded by: Coordenação de Aperfeiçoamento de Pessoal de Nível Superior - CAPES (GG)
                Funded by: LIM01-HCFMUSP (MNB and LFL)
                Funded by: National Council for Scientific and Technological Development - CNPq (MNB)
                Funded by: Fundo Nacional de Saúde of the Brazilian Ministry of Health (FNS-MoH) (MNB)
                Award ID: TED 27/2015
                Categories
                Research
                Custom metadata
                © The Author(s) 2022

                Public health
                hepatitis b virus,hepatitis b,epidemiologic methods,epidemiological monitoring
                Public health
                hepatitis b virus, hepatitis b, epidemiologic methods, epidemiological monitoring

                Comments

                Comment on this article