- Record: found
- Abstract: found
- Article: not found
Peptidoglycan synthesis drives FtsZ treadmilling-independent step of cytokinesis
research-article
João M. Monteiro
1 ,
Ana R. Pereira
1 ,
Nathalie T. Reichmann
1 ,
Bruno M. Saraiva
1 ,
Pedro B. Fernandes
1 ,
Helena Veiga
1 ,
Andreia C. Tavares
1 ,
Margarida Santos
1 ,
Maria T. Ferreira
1 ,
Vânia Macário
1 ,
Michael S. VanNieuwenhze
2 ,
Sérgio R. Filipe
3 ,
Mariana G. Pinho
1
14 February 2018
Read this article at

There is no author summary for this article yet. Authors can add summaries to their articles on ScienceOpen to make them more accessible to a non-specialist audience.
Abstract
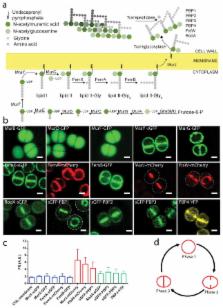
Peptidoglycan (PG), the major component of the bacterial wall, protects cells from
mechanical stress resulting from high intracellular turgor. PG biosynthesis (Fig.
1a) is very similar in all bacteria. Therefore, different bacterial shapes are mainly
determined by the spatial and temporal regulation of PG synthesis, not by its chemical
composition. Rod-shaped bacteria, such as Bacillus subtilis or Escherichia coli, achieve
their shape through the action of two PG synthesis machines that act at the septum
and at the lateral wall, in processes coordinated by cytoskeletal proteins FtsZ and
MreB, respectively
1,2
. The tubulin homologue FtsZ is the first protein recruited to the division site where
it assembles in filaments (Z-ring) that undergo treadmilling and recruit later divisome
proteins
3,4
. Importantly, the rate of treadmilling in B. subtilis controls both the rate of PG
synthesis and of cell division
3
. The actin homologue MreB forms discrete patches that move circumferentially around
the cell, in tracks perpendicular to the cell long axis, and organise insertion of
new cell wall during elongation
5,6
. Cocci like Staphylococcus aureus possess only one PG synthesis machinery
7,8
, which is diverted from the cell periphery to the septum in preparation for division
9
. The molecular cue that coordinates this transition has remained elusive. Here, we
investigated the localisation of S. aureus PG biosynthesis proteins and showed that
the putative lipid II flippase MurJ is recruited to the septum by the DivIB/DivIC/FtsL
complex, driving PG incorporation to midcell. MurJ recruitment corresponds to a turning
point in cytokinesis, which is slow and dependent on FtsZ treadmilling before MurJ
arrival, but becomes faster and independent of FtsZ treadmilling after PG synthesis
activity is directed to the septum, providing additional force for cell envelope constriction.
The molecular cue that determines the shift of PG synthesis from the cell periphery
to the septum in cocci could be the recruitment to midcell of a key PG biosynthesis
protein, concomitantly with assembly of the divisome. Therefore, we examined the localisation
of most S. aureus PG synthesis proteins in the background of Methicillin Resistant
S. aureus (MRSA) strain COL (Fig. 1 and Supplementary Table 1). All fluorescent fusions
were functional (Supplementary Table 1) and expressed from their native locus under
the control of their native promoter, as the sole copy of the gene in the cell, with
the exception of MraY-sGFP. As expected MurB, MurD and MurF fusions, which act on
cytoplasmic PG precursors, showed cytoplasmic localisation (Fig. 1b). Also consistent
with their substrate localisation, the remaining fusions localised to the membrane,
including the FemXAB proteins, which do not have canonical membrane-targeting domains
10
. Since most PG synthesis activity occurs at the septum
9
, we were expecting membrane-associated PG synthesis enzymes to be highly enriched
in the septal region of dividing cells. However, MraY, MurG, and the FemXAB proteins
were evenly distributed throughout the membrane (including the septum) suggesting
that the key step for spatial regulation of PG synthesis was not the synthesis of
lipid I or lipid II (Fig. 1b,c). MurJ, FtsW and PBP1 were the only septal proteins
for which virtually no signal could be observed in the peripheral membrane during
septum synthesis (Fig. 1b,c) and therefore were good candidates to catalyse the first
specifically septal PG synthesis step. MurJ is a member of the MOP (multidrug/oligosaccharidyl-lipid/polysaccharide)
exporter superfamily and has been suggested to be the lipid II flippase in E. coli
11
. In S. aureus the essential gene SAV1754 (aka SACOL1804) has been reported as a functional
MurJ ortholog
12
. FtsW is a member of the SEDS (sporulation, elongation, division and synthesis) protein
family, also suggested to be a lipid II flippase
13
. However, more recently, SEDS proteins were shown to be PG transglycosylases that
probably function together with a cognate Penicillin-Binding Protein (PBP) during
PG polymerisation
14,15
. S. aureus encodes two SEDS proteins, SACOL1122 and SACOL2075, similar to B. subtilis
FtsW and RodA, respectively. PBP1 is a transpeptidase that crosslinks PG glycan strands
16
.
In order to clarify which protein(s) was responsible for directing PG synthesis to
the septum, newly synthesised PG was labelled with the fluorescent D-amino acid HADA,
which is specifically incorporated into PG
17
, in a strain expressing both FtsW-mCherry (which colocalises with PBP1, see below)
and MurJ-sGFP. HADA incorporation appeared to colocalise with both proteins in cells
in Phase 1 of the cell cycle and in most Phase 2 cells (Fig. 2a; see Fig. 1d for cell
cycle phases). However, MurJ/HADA septal colocalisation was more frequent than FtsW/HADA
colocalisation (88% vs. 70% of cells, N=200), as cells with septal FtsW but peripheral
MurJ had peripheral HADA incorporation (see asterisks in Fig. 2a). This suggested
that septal PG synthesis was dependent on the presence of MurJ. If this was the case,
preventing MurJ recruitment to midcell should abolish septal PG synthesis. We therefore
investigated the mechanism of MurJ localisation so that we could selectively prevent
its septal recruitment, while maintaining correct FtsW/PBP1 septal localisation. For
that purpose, we determined the timing of MurJ arrival to the septum, as localisation
of divisome proteins is often dependent on the presence of earlier localising proteins
18,19
.
In B. subtilis, divisome assembly is a two-step process, with proteins such as FtsA,
ZapA and EzrA arriving very early, concomitantly with FtsZ, followed after a time
delay by a second group of proteins including the DivIB/DivIC/FtsL sub-complex
20
. We therefore compared S. aureus PBP1, FtsW and MurJ localisation with that of early
divisome protein FtsZ and later divisome protein DivIB (Fig. 2b). Colocalisation between
each protein and FtsZ was determined by measuring Pearson’s Correlation Coefficient
(PCC) for the fluorescence signals in the two channels, in cells showing FtsZ midcell
localisation, as we reasoned that proteins arriving to the septum simultaneously with
FtsZ should have a PCC close to 1 and this value should decrease for later divisome
proteins. As a positive control we constructed a strain co-expressing FtsZ-CFP and
FtsZ-mCherry. Colocalisation results indicated that DivIB arrives to the divisome
later than FtsZ, as expected, and approximately at the same time as PBP1 and FtsW,
while MurJ arrives later than DivIB/PBP1/FtsW (Fig. 2c), a result that is unlikely
to be affected by nature of the fluorescent tags (Extended Data Fig. 1). In agreement,
in 20% of the cells (N = 200) of a strain expressing both YFP-DivIB and MurJ-mCherry,
YFP-DivIB was already localised at the septum, while MurJ-mCherry had not arrived
yet (insets in Fig. 2d). This raised the possibility that MurJ septal recruitment
could be dependent on the presence of the DivIB/FtsL/DivIC sub-complex. We therefore
depleted expression of each of these three proteins using antisense RNA fragments
21
(Supplementary Table 2), whose efficiency was assessed by western blot analysis and
by the increase in cell volume resulting from divisome inhibition (Extended Data Fig.
2). Depletion of DivIB, FtsL or DivIC reduced septal colocalisation of FtsZ-CFP and
MurJ-mCherry (Fig. 3a,b), but not of FtsZ and either FtsW or PBP1 (Extended Data Fig.
3), in agreement with their earlier recruitment to the divisome.
Having a tool to specifically delocalise MurJ, by depleting FtsL, while maintaining
correct PBP1 and FtsW localization, allowed us to determine that new PG (labelled
by a short pulse of HADA), was only incorporated at midcell if MurJ-sGFP was also
present at the septum (Fig. 3c, asterisks and 3d). Finally, we showed that inhibiting
MurJ activity using DMPI, a MurJ inhibitor
12
that does not prevent its recruitment to the divisome (Extended Data Fig. 4a), drastically
reduced HADA incorporation (i.e. PG synthesis) at the septum (Extended Data Fig. 4b–e).
Taken together, these data indicate that recruitment of MurJ to the divisome by the
FtsL/DivIB/DivIC complex is likely the molecular cue directing PG synthesis specifically
to the septum during division. Therefore, we would expect MurJ to be essential for
the transition from Phase 1 to Phase 2 during the cell cycle, i.e., for initiation
of septum synthesis. We treated COL wild type cells with DMPI for one cell cycle and
characterised the distribution of cells in the three cell cycle phases. For comparison
we tested other inhibitors, namely PC190723
22
, which targets FtsZ and oxacillin, which inhibits PG transpeptidation catalysed by
PBPs (Fig. 3e and Extended Data Fig. 5). Consistent with previous data
9
, in the absence of inhibitors approximately half of the cells were in Phase 1, with
the other half split evenly between Phase 2 and Phase 3 (Fig. 3e). Inhibition of MurJ
by DMPI resulted in accumulation of Phase 1 cells (70%, N > 300), indicating that
MurJ is indeed crucial for entry in Phase 2. Phase 2 cells, which are synthesising
the septum, were also halted, as flipping the PG precursor is essential for PG synthesis
to occur.
The most surprising result was the almost complete absence of Phase 2 cells in the
presence of PC190723, since this compound inhibits FtsZ treadmilling
3
, which was shown to control the rate of PG synthesis during septum formation in B.
subtilis and therefore the rate of cell division
3
. One would therefore expect that addition of PC190723 would prevent Phase 2 cells,
that were halfway through the process of septum synthesis, from completing this process.
As this was not the case, we wondered if redirecting PG synthesis to the septum, driven
by septal recruitment of MurJ, would provide the constrictive driving force for cytokinesis,
as previously suggested for E. coli
23,24
, and result in septum closure independent of FtsZ treadmilling.
To visualise the process of septum closure and determine if FtsZ treadmilling occurs
in S. aureus, we introduced an FtsZ sandwich fusion to sGFP (see methods) in the background
of a strain expressing native FtsZ and followed the dynamics of Z-ring formation and
constriction. We were able to observe FtsZ55-56sGFP movement, which was inhibited
by PC190723 as expected (Fig. 4 and Supplementary Video 1). However, Z-ring constriction
continued in many cells treated with PC190723, in accordance with the fact that PC190723-treated
cells could complete Phase 2 of the cell cycle (Fig. 3e). Interestingly, when we followed
Z-ring constriction in untreated cells, we observed biphasic cytokinesis, with a first
step, immediately after Z-ring assembly, during which the divisome barely constricts,
followed by a second step with a higher rate of Z-ring constriction (Fig. 5a, Extended
Data Fig. 6a and Supplementary Video 2). Addition of PC190723 blocked constriction
of large Z-rings, presumably in the first step of cytokinesis, but not of smaller
Z-rings (Fig. 5a, b, Extended Data Fig. 6a and Supplementary Video 3). This indicates
that only Z-rings in the first step of cytokinesis required treadmilling activity
for constriction. To confirm these results, we used a functional fluorescent derivative
of the divisome protein EzrA as a proxy for FtsZ localisation, given that EzrA interacts
directly with FtsZ
25,26
. Similarly to what we observed for FtsZ, EzrA treadmilling was inhibited by PC190723
and EzrA rings underwent biphasic constriction where the second, faster, step was
insensitive to PC190723 (Extended Data Fig. 7).
It is possible that the transition between the first and the second step of Z-ring
constriction corresponds to the start of substantial PG synthesis activity that results
from MurJ recruitment. In agreement with this hypothesis, the divisome rings that
contained MurJ did not display the first step of constriction and were insensitive
to PC190723 (Fig. 5c, e and Extended Data Figs. 6b, 8). Furthermore, arrival of MurJ
to the septum coincided with initiation of fast constriction (Fig. 5d and Extended
Data Fig. 9a). In contrast, rings containing the earlier divisome protein FtsW paralleled
the biphasic behaviour of the Z-ring (Fig. 5c, d, Extended Data Figs. 8 and 9b) and
were susceptible to inhibition by PC190723, presumably during the initial stages of
cytokinesis (Fig. 5e). Furthermore, while the FtsZ inhibitor PC190723 only blocked
constriction of Z-rings at initial stages, addition of the MurJ inhibitor DMPI blocked
ring constriction at all stages (Extended Data Fig. 6a).
We propose a model (Extended Data Fig. 10) where the S. aureus PG synthesis machinery
continuously incorporates PG at the periphery of the cell during initial stages of
the cell cycle. In preparation for division and following Z-ring assembly, the FtsL/DivIB/DivIC
complex recruits MurJ to the divisome, which ensures that translocation of lipid II
occurs exclusively at midcell. Substrate affinity
27
then diverts the major PG synthase, PBP2, from the periphery to midcell where, together
with other PG synthesis enzymes, it incorporates lipid II into the growing PG network.
This mechanism forgoes the need for an additional dedicated multi-protein machinery
and represents a new mode of controlling PG synthesis in two different locations,
in the absence of an MreB-like cytoskeleton.
Importantly, after the initiation of massive PG synthesis activity at the leading
edge of the constricting septum that follows MurJ recruitment, the FtsZ inhibitor
PC190723, which inhibits FtsZ treadmilling, no longer prevents cytokinesis. Nevertheless,
FtsZ treadmilling is likely to have a role in the organisation of septum synthesis,
since ~15% of the Z-rings that were able to constrict in the presence of PC190723,
did so defectively, similarly to E. coli FtsZ mutants impaired in GTPase activity
4
.
Our data may reconcile two models proposed in the literature for the origin of the
force required for cytokinesis to occur. In one model, this force has been proposed
to be derived from FtsZ, either from the chemical energy of GTP hydrolysis which could
promote bending of the FtsZ polymers or from the affinity of FtsZ filaments to bundle,
which could result in condensation of the Z-ring
24,28
. Alternatively, PG synthesis has been suggested to be the force for cytokinesis
23,24
. We propose that cytokinesis occurs in two steps: an initial, slow one, dependent
on FtsZ treadmilling, for which FtsZ may be the driving force and that may be responsible
for the initial invagination of the cell membrane, followed by a second, faster step,
for which PG synthesis provides the driving force.
Supplementary Information is linked to the online version of the paper at www.nature.com/nature.
METHODS
Bacterial growth conditions
Strains and plasmids used in this study are listed in Supplementary Table 3. S. aureus
strains were grown in tryptic soy broth (TSB, Difco) at 200 r.p.m with aeration at
37 °C or on tryptic soy agar (TSA, Difco) at 30 or 37°C. E. coli strains were grown
in Luria–Bertani broth (Difco) with aeration, or Luria–Bertani agar (Difco) at 37
or 30°C. When necessary, antibiotics ampicillin (100 μg ml−1), erythromycin (10 μg
ml−1), kanamycin (50 μg ml−1), neomycin (50 μg ml−1) or chloramphenicol (30 μg ml−1)
were added to the media. 5-bromo-4-chloro-3-indolyl β-D-galactopyranoside (X-gal,
Apollo Scientific) was used at 100 μg ml−1. Unless stated otherwise, isopropyl β-D-1-thiogalactopyranoside
(IPTG, Apollo Scientific) was used at 0.1 mM to induce expression of constructs under
the control of the Pspac promoter. Cadmium chloride (Sigma-Aldrich) was used at 0.1
μM when required to induce expression of constructs under the control of the Pcad
promoter.
Construction of S. aureus fluorescent strains
Cloning of fluorescent fusions in S. aureus was done using the following general strategy:
plasmids were propagated in E.coli strains DC10B or DH5α and purified from overnight
cultures supplemented with the relevant antibiotics. Plasmids were then introduced
into electrocompetent S. aureus RN4220 cells as described before
29
and transduced to COL using phage 80α
30
. Constructs were confirmed by PCR and sequencing of the amplified fragment.
The ColMurB-GFP, ColMurD-GFP, ColMurF-GFP, ColFemB-GFP and ColpSGEzrA-GFP strains
were constructed using the pSG5082 vector
31
. Briefly, DNA fragments with approximately 500 bp spanning the 3′ ends (minus stop
codons) of the murB, murD, murF, femB and ezrA genes from COL were amplified using
primer pairs murBg_P1/murBg_P2; murDg_P1/murDg_P2; murFg_P1/murFg_P2; femBg_P1/femBg_P2
and ezrAP8Kpn/ezrAP9Xho, respectively (Supplementary Table 4). Fragments were digested
with KpnI and XhoI restriction enzymes and cloned into pSG5082 upstream and in frame
with gfpmutP2, originating plasmids pSG-murB, pSG-murD, pSG-murF, pSG-femB and pSG-ezrA.
These plasmids were then electroporated to RN4220, where they integrated in the genome
by a single homologous recombination event and subsequently transduced to COL. Resulting
strains contain the corresponding fluorescent fusions in each gene’s native locus
under the control of its native promoter, followed by the pSG5082 backbone and a truncated
copy of the gene. The strategy to construct ColFemX-sGFP was essentially the same,
except that the pFAST3
32
vector was used instead of pSG5082. A femX fragment was amplified from COL DNA with
primers femXg_P1 and femXg_P2, digested with KpnI/XhoI and cloned into pFAST3 upstream
and in frame with sgfp, giving pFAST-femX, which was electroporated into RN4220 and
transduced into COL. Strain ColMurG-GFP was obtained by transducing the murG-gfp construct
from BCBMS001
33
into COL.
Strains ColFemA-mCherry, ColFtsW-mCherry, ColMurJ-mCherry, ColRodA-sGFP, ColsGFP-PBP1
and ColsGFP-PBP3 were constructed by allelic replacement strategies using the pMAD
vector. In each case three DNA fragments (F1, F2 and F3 – see Supplementary Table
5) containing overhangs complementary with adjacent fragments were amplified from
COL DNA and joined by overlap PCR, giving F1-F2-F3 fusion constructs. The full constructs
were then amplified by PCR using up- and downstream primers (P1 and P6 in each case),
digested with the corresponding restriction enzymes and cloned into pMAD. Integration
and excision of the pMAD derivatives in COL by a double recombination event, leading
to allelic exchange, was performed as described before
34
. The relevant information for the cloning steps for each strain is described in Supplementary
Table 5.
In order to obtain strains ColFtsW-sGFP and ColMurJ-sGFP, plasmids pMAD-ftsWsgfp and
pMAD-murJsgfp were first constructed. For pMAD-ftsWsgfp, three fragments (F1, F2 and
F3), each flanked by restriction sites, were introduced into pMAD. F1, containing
the 3′ end of ftsW minus the stop codon, was amplified from NCTC8325-4 DNA with primers
ftsWg_P1/ftsWg_P2 and digested with SmaI/SalI; F2, containing sgfp, was amplified
from pTRC99a-P7 with primers ftsWg_P3/ftsWg_P4 and digested with SalI; F3, containing
the downstream region of ftsW, was amplified from NCTC8325-4 DNA and digested with
SalI/BamHI. Fragments were then sequentially cloned into pMAD (F1, followed by F3
and finally by F2) using the adjacent restriction sites, giving pMAD-ftsWsgfp. For
pMAD-murJsgfp the same strategy was used. F1, containing the 3′ end of murJ minus
the stop codon, was amplified from COL DNA using primers murJg_P1/murJg_P2 and digested
with SmaI/SalI; F2, containing sgfp, was amplified from pTRC99a-P7 using primers murJg_P3/murJg_P4
and digested with SalI; F3, containing the last 26bp of murJ and its downstream region,
was amplified from COL DNA using primers murJg_P5/murJg_P6 and digested with SalI/BamHI.
Fragments were cloned into pMAD resulting in plasmid pMAD-murJsgfp. Plasmids pMAD-ftsWsgfp
and pMAD-murJsgfp were then electroporated to RN4220, transduced to COL and following
allelic replacement strains ColFtsW-sGFP and ColMurJ-sGFP were obtained.
Strain ColFtsZ-mCherryi was constructed using the pBCB13 plasmid
35
, a derivative of pMAD that allows allelic exchanges in the spa locus. Briefly, a
DNA fragment containing the Ribosome Binding Site (RBS), the ftsZ gene without its
stop codon and a 5 amino acid linker was amplified by PCR from COL with primers iftsZm_P1/iftsZm_P2.
A second fragment containing mCherry was amplified from pBCB4che using primers iftsZm_P3/iFtsZm_P4.
The two fragments were joined by overlap PCR using primers iftsZm_P1/iftsZm_P4 and
the resulting construct was digested with SmaI/XhoI and cloned into pBCB13, downstream
of the Pspac promoter, giving pBCB13-ftsZmch. Similarly, to construct strain ColDltC-sGFPi
a DNA fragment containing an RBS, the dltC gene without stop codon and a two amino
acid linker was amplified by PCR from COL with primers idltCg_P1 and idltCg_P2. A
second fragment containing sgfp was amplified from pTRC99a-P7 using primers idltCg_P3/idltCg_P4.
The two fragments were joined by overlap PCR using primers idltCg_P1/idltCg_P4 and
the resulting construct was digested with SmaI/XhoI and cloned into pBCB13 downstream
of the Pspac promoter, giving pBCB13-dltCsgfp. Following transduction to COL, plasmids
integration/excision at the spa locus was performed as described before
34
.
Strain ColFtsZ55-56sGFP was constructed using the pCNX replicative plasmid
9
to express an FtsZ-sGFP sandwich fusion. In brief, three DNA fragments (F1, F2 and
F3) with overhangs were amplified in order to construct a sgfp fusion inserted within
the ftsZ coding sequence between codons 55 and 56
36
, flanked by 10 amino acid linkers (GGGGSx2). F1, containing an RBS and the first
165 bp of ftsZ was amplified from COL DNA using primers ftsZswgfp_pCNX_P1 and ftsZswgfp_pCNX_P2;
F2, containing sgfp flanked by linker sequences was amplified from pTRC99a-P7 using
primers ftsZswgfp_pCNX_P3 and ftsZswgfp_pCNX_P4; F3, containing the remaining 1008
bp of ftsZ (from nucleotide 166 onwards) was amplified from COL DNA using primers
ftsZswgfp_pCNX_P5 and ftsZswgfp_pCNX_P6. The three fragments were joined by overlap
PCR, digested with BamHI/EcoRI and cloned into pCNX giving pCN-ftsZ55-56sGFP, which
was then transduced into COL and the resulting strain was named ColFtsZ55-56sGFP.
Strain ColMraY-sGFP was constructed using the pCN51 replicative plasmid to express
an MraY-sGFP sandwich fusion. Briefly, three DNA fragments (F1, F2 and F3) with overhangs
were amplified in order to construct a fusion with sgfp inserted within the mraY coding
sequence, between codons 220 and 221. F1, containing an RBS and the first 660 bp of
mraY, was amplified from COL DNA using primers mraYg_P1/mraYg_P2; F2, containing sgfp
minus the stop codon, was amplified from pTRC99a-P7 with primers mraYg_P3/mraYg_P4;
F3, containing the last 306 bp of mraY, was amplified from COL using primers mraYg_P5
and mraYg_P6. The three fragments were joined by overlap PCR and digested with SmaI
and cloned into pCN51, resulting in pCN-mraYsgfp.
Strains ColWZ and ColJZ were constructed by transducing plasmids pMAD-ftsWmch and
pMAD-murJmch, respectively, into BCBAJ020. ColP1Z was constructed by transducing pMAD-sgfpPbp1
into ColFtsZ-mCherryi. Strains ColWgZm and ColJgZm were constructed by transducing
plasmids pMAD-ftsWsgfp and pMAD-murJsgfp, respectively, into ColFtsZ-mCherryi. Strain
ColWJ was obtained by transducing pMAD-murJsgfp to ColFtsW-mCherry. In each case,
allelic replacement was performed as described above.
In order to construct ColZZ, an ftsZ-mCherry fusion was amplified from genomic DNA
of ColFtsZ-mCherryi with primers ftsZm_pCNX_P1 and ftsZm_pCNX_P2, digested with BamHI/EcoRI
and cloned in pCNX downstream of the Pcad promoter, giving plasmid pCN-ftsZmch. This
plasmid was then electroporated into RN4220 and transduced to BCBAJ020, giving strain
ColZZ.
To study colocalisation between DivIB with FtsZ or MurJ, an yfp-divIB fusion was constructed
and cloned into pCNX. Briefly, a fragment containing yfp minus the stop codon and
a 3′ terminal overhang was amplified from pMUTINYFPKan
37
with primers ydivIB_pCNX_P1/ydivIB_pCNX_P2. A second fragment containing the full
divIB gene with a 5′ overhang was amplified from COL DNA with primers ydivIB_pCNX_P3/ydivIB_pCNX_P4.
The two fragments were then joined by overlap PCR, digested with SmaI/KpnI and cloned
into pCNX downstream of Pcad, giving plasmid pCN-yfpDivIB. This plasmid was transduced
to BCBAJ020 and ColMurJ-mCherry, giving strains ColZIB and ColJIB, respectively.
Construction of S. aureus strains containing antisense RNA vectors
To construct strains carrying antisense RNA vectors, 250 bp fragments of divIB or
divIC genes were amplified from COL DNA with primer pairs ASdivIB_P1/ASdivIB_P2 and
ASdivIC_P1/AS_DivIC_P2, respectively, digested with EcoRI/BamHI and cloned in antisense
direction into pEPSA5, relative to the xylose inducible T5X promoter, giving pAS-DivIB
and pAS-DivIC. These plasmids were then transduced into ColJZ, giving ColJZpAS-DivIB
and ColJZpAS-DivIC respectively. Additionally, phage lysates were obtained from AS-022
and AS-185 strains
21
carrying antisense RNA pEPSA vectors pAS-022 and pAS-185 targeting ftsA and ftsL,
respectively. pAS-022 was transduced to ColWZ and ColP1Z, giving strains ColWZpAS-FtsA
and ColP1ZpAS-FtsA. pAS-185 was transduced to ColJZ, ColWZ, ColP1Z and ColWJ, giving
strains ColJZpAS-FtsL, ColWZpAS-FtsL, ColP1ZpAS-FtsL and ColWJpAS-FtsL, respectively.
Control strains for these experiments were obtained by transducing the empty vector
pEPSA5 into ColJZ, ColWZ, ColP1Z and ColWJ, giving strains ColJZpEPSA, ColWZpEPSA,
ColP1ZpEPSA and ColWJpEPSA, respectively.
Growth curves of S. aureus strains
Overnight cultures of COL strains encoding fluorescent derivatives of PG synthesis
enzymes were back-diluted to OD600nm 0.02 in TSB and grown at 37°C for 11 hours with
OD600nm measurements taken every hour. Doubling times were calculated for each strain
during exponential growth phase.
Minimum inhibitory concentration (MIC) assays
MICs of relevant antimicrobial compounds were determined by broth microdilution in
sterile 96-well plates. The medium used was TSB, containing a series of two-fold dilutions
of each compound. Cultures of S. aureus strains and mutants were added at a final
density of 5×10⁵ CFU ml−1 to each well. Wells were reserved in each plate for sterility
control (no cells added) and cell viability (no compound added). Plates were aerobically
incubated at 37°C. Endpoints were assessed visually after 24 and 48 h. All assays
were done in triplicate.
Western Blotting
S. aureus strains ColJZpEPSA, ColJZpAS-DivIB and ColJZpAS-DivIC were grown overnight,
back-diluted 1:200 in fresh TSB and incubated at 37°C until an OD600nm of approximately
0.2. At this point, xylose was added to the medium at 4% to allow the expression of
the antisense RNA fragments. After 1 hour of antisense expression, cells were harvested
and broken with glass beads in a FastPrep FP120 cell disrupter (Thermo Electro Corporation).
Samples were centrifuged to remove unbroken cells and debris and total protein content
of the clarified lysates was determined using the Bradford method and bovine serum
albumin as a standard (BCA Protein Assay Kit, Pierce). Equal amounts of total protein
from each sample were separated on 10% SDS-PAGE at 80V and then transferred to Hybond-P
PVDF membrane (GE Healthcare) using a Semi-dry transfer cell (Biorad), according to
standard western blotting techniques. Membranes were cut to separate PBP2A region
from DivIB or DivIC region. DivIB and DivIC proteins were detected using specific
polyclonal antibodies at 1:5000 and 1:10000 dilutions, respectively. PBP2A was detected
using the antibody from a Slidex MRSA detection kit (Biomerieux) at 1:500 dilution.
Protein bands were visualised using the ECL Prime Detection Reagents (GE Healthcare),
following manufacturer’s instructions.
S. aureus imaging by fluorescence microscopy
Super-resolution Structured Illumination Microscopy (SIM) imaging was performed using
an Elyra PS.1 microscope (Zeiss) with a Plan-Apochromat 63×/1.4 oil DIC M27 objective.
SIM images were acquired using five grid rotations, unless stated otherwise, with
34 μm grating period for the 561 nm laser (100 mW), 28 μm period for 488 nm laser
(100 mW) and 23 μm period for 405 nm laser (50 mW). Images were captured using a Pco.edge
5.5 camera and reconstructed using ZEN software (black edition, 2012, version 8.1.0.484)
based on a structured illumination algorithm, using synthetic, channel specific optical
transfer functions and noise filter settings ranging from −6 to −8.
Wide-field fluorescence microscopy was performed using a Zeiss Axio Observer microscope
with a Plan-Apochromat 100x/1.4 oil Ph3 objective. Images were acquired with a Retiga
R1 CCD camera (QImaging) using Metamorph 7.5 software (Molecular Devices).
For fluorescence microscopy experiments, unless stated otherwise, overnight cultures
of S. aureus strains were back-diluted 1:200 in fresh media with appropriate inducers
and allowed to grow until OD600nm ~ 0.6 before being harvested and washed with phosphate
buffer saline (PBS). Cells were then placed on microscope slides covered with a thin
layer of agarose (1% in PBS) and imaged by SIM or wide-field microscopy.
To assess if MurJ localisation was dependent on interaction with its substrate, strain
ColMurJ-mCherry was grown until OD600nm of 0.4 and incubated with 3-{1-[(2,3-Dimethylphenyl)methyl]piperidin-4-yl}-1-methyl-2-pyridin-4-yl-1H-indole
(DMPI, gift from Merck) at 3 μg ml−1 for 30 minutes and then imaged by wide-field
fluorescence microscopy as described above.
For antisense RNA experiments, strains were grown until OD600nm of 0.1–0.2 at which
point expression of the antisense RNA fragments was induced with xylose (Apollo Scientific)
at a final concentration of 4% for 1 hour. Cells were then harvested and washed with
PBS to remove xylose, mounted on microscope slides as described above and imaged by
wide-field fluorescence microscopy. Assays were done in triplicate.
To evaluate localisation of peptidoglycan synthesis activity, S. aureus cells were
given a pulse of fluorescent D-amino-acid HADA
17
(250 μM) for 1 min and then washed two times with PBS. Cells were then placed on an
agarose pad and visualised by wide-field microscopy. Assays were done in triplicate.
To label S. aureus membranes, cells were incubated with Nile Red (Invitrogen) at a
final concentration of 10 μg ml−1 for 5 minutes at room temperature, washed with PBS
and then mounted on microscope slides.
For timelapse experiments, all cultures were grown overnight in TSB. For ColFtsZ55-56sGFP
and ColpSGEzrA-GFP the media was supplemented with kanamycin 150 μg ml−1 and erythromycin
10 μg ml−1 respectively. Overnight cultures were diluted 1:200 in fresh TSB media
without antibiotic but supplemented with appropriate inducers (CdCl2 0.1 μM for ColFtsZ55-56sGFP;
IPTG 0.5mM for ColWgZm and ColJgZm). After being harvested, cells were re-suspended
in M9 microscopy media (KH2PO4 3.4 g l−1, VWR; K2HPO4 2.9 g l−1, VWR; di-ammonium
citrate 0.7 g l−1, Sigma-Aldrich; sodium acetate 0.26 g l−1, Merck; Glucose 1 %, Merck;
MgSO4 0.7 mg l−1, Sigma-Aldrich; CaCl2 7 mg l−1, Sigma-Aldrich; casaminoacids 1 %,
Difco; MEM aminoacids 1x,Thermo Scientific; MEM vitamins 1x, Thermo Scientific). The
media was supplemented when required with IPTG 0.5 mM, CdCl2 0.1 μM, DMPI 8 μg ml−1
or PC190723 5 μg ml−1. Cultures were then spotted on a pad of 1.5 % agarose in the
same supplemented media and mounted in a geneframe on a microscope slide. The time
it took between the cells contacting the pad and the start of acquisition was 5 min
in all conditions.
HADA incorporation microscopy assay
To assess if MurJ activity was required for HADA incorporation, strains COL and ColDltC-sGFPi
(which expresses a cytoplasmic DltC-sGFP fusion and therefore can be easily distinguished
from COL under the microscope) were grown to an OD600nm of 0.4 at which point each
culture was separated into two flasks and either DMPI (3 μg ml−1 in DMSO) or DMSO
(0.2 % final concentration) were added to the cultures. Following 25 minutes of incubation,
HADA (500 μM) was added to each culture for 5 minutes. Cells were then harvested,
washed twice with PBS (supplemented with DMPI when applicable) and DMSO-treated COL
cells were mixed with DMPI-treated ColDltC-sGFPi cells. To exclude the possibility
that the expression of DltC-sGFP affected the results, a reverse experiment was performed
where cells of DMSO-treated ColDltC-sGFPi were mixed with DMPI-treated COL. These
mixtures of two strains were then imaged by fluorescence microscopy as described above.
Functionality test for EzrA-GFP construct
Strains COL and COLΔEzrA were grown overnight in TSB and strain ColpSGEzrA-GFP was
grown in TSB plus erythromycin 10 μg ml−1 at 37°C with aeration. Overnight cultures
were diluted 1:200 in fresh TSB and incubated at 37°C with aeration. Once the OD600nm
reached ~0.6, cells were pelleted, resuspended in PBS and spotted on a thin layer
of 1.2% agarose in PBS. Cultures were imaged by phase-contrast, single cells were
identified and cell area measured using eHooke (see below), as lack of EzrA results
in the appearance of larger cells
38
.
Imaging of FtsZ55-56sGFP treadmilling by SIM
To visualise FtsZ55-56sGFP movement in strain ColFtsZ55-56sGFP, and EzrA-GFP movement
in strain ColpSGEzrA-GFP, 50 frames of SIM images were acquired with 5 second intervals
(total time of acquisition of 250 seconds) using the 488 nm laser at 50% and a 50
msec exposure time. Following this acquisition, for FtsZ, a short timelapse of 3 images
taken 15 minutes apart was performed to check if the corresponding rings were constricting.
These experiments were performed with and without PC190723 at 5 μg ml−1. To analyse
FtsZ/EzrA movement, the 50 frames were aligned and 1 pixel lines were drawn over the
rings and then plotted in a kymograph.
Visualisation of divisome ring constriction by SIM
In order to follow FtsZ55-56sGFP or EzrA-GFP ring constriction over time, ColFtsZ55-56sGFP
or ColpSGEzrA-GFP dividing cells were imaged by SIM every 5 minutes for 1 hour using
the 488 nm laser at 50% power and a 50 msec exposure time. These experiments were
performed with and without PC190723 (5 μg ml−1; laser power 50%) and with DMPI for
FtsZ only (8 μg ml−1; laser power 100%). Following SIM image reconstruction, cropped
stacks containing individual cells were used to plot Z-ring constriction kymographs
over the 1 hour period by drawing a 3 pixel line across the diameter of the cell,
crossing the fluorescent signal, using Fiji software
39
. The percentage of cells for which the FtsZ ring did not constrict, constricted with
defects or constricted in relation to their initial ring size, in the presence of
PC190723, was plotted using GraphPad Prism 6.
In order to follow constriction of FtsW-sGFP and MurJ-sGFP rings in strains ColFtsW-sGFP
and ColMurJ-sGFP respectively, cultures were spotted on an M9 pad, with and without
PC190723, and imaged by SIM. The 488 nm laser was used at 100% intensity, with an
exposure time of 50 msec. To decrease photodamage due to high laser power, images
were acquired every 10 min (instead of 5 min) during 1 hour. These settings were also
applied for ColFtsZ55-56sGFP for comparison. For MurJ-sGFP timelapses were also performed
with a 5 min interval to confirm the absence of biphasic behaviour of the constricting
ring. Only cells with MurJ-sGFP signal absent in the first frame but present in the
second frame were analysed to ensure that the entire constriction process was observed.
Following SIM image reconstruction, cropped stacks containing individual cells were
used to plot constriction kymographs as described above.
Timelapse stacks of ColFtsZ55-56sGFP, ColFtsW-sGFP and ColMurJ-sGFP in the presence
of PC190723 were used to count the number of cells that had the fusion at midcell
in the first frame and determine the percentage of those cells that constricted, constricted
with defects or did not constrict in the presence of PC190723 for 60 min. Data was
plotted using GraphPad Prism 6.
To observe constriction of FtsW-sGFP and MurJ-sGFP rings in cells expressing FtsZ-mCherry,
strains ColWgZm and ColJgZm were imaged by SIM in M9 media supplemented with IPTG,
every 10 min for 1 h, using the 488 nm laser and the 561 nm laser (100% laser power,
50 msec and 50% laser power, 50 msec respectively). Cells of ColWgZm where FtsZ-mCherry
showed biphasic constriction behaviour, and cells of ColJgZm where MurJ-sGFP signal
appeared on the third frame, were used to measure the ring diameter for each protein
in all frames.
Inhibition of the cell cycle assays
An overnight culture of strain COL was back-diluted 1:200 and grown until OD600nm
~ 0.4 at which point either DMPI
12
(3 μg ml−1), PC190723 (2.5 μg ml−1), oxacillin (1000 μg ml−1, Sigma-Aldrich) or DMSO
(0.2 %) were added to the medium. Cells were then grown for 30 minutes with each inhibitor,
harvested and labelled with Nile Red, as described above, before being imaged by SIM.
Cells were sorted into each phase of the cell cycle (Phase1, Phase2 or Phase3), as
previously described
9
. Assays were done in triplicate.
Automatic cell imaging analysis
Analysis of phase-contrast and fluorescence images was performed using eHooke, an
in-house developed software. For cell segmentation, eHooke uses phase-contrast images
and applies the isodata algorithm
40
for automatic thresholding to find a pixel intensity value that separates the pixels
corresponding to the background from those corresponding to cells. Using this threshold,
the software then creates a binary mask which is used to compute the Euclidean Distances
41
of each pixel in order to find the centres of individual regions inside the mask.
The software then expands those centres to define individual cell regions using the
watershed algorithm
42
.
In order to measure cell areas and volumes, eHooke first defines each individual cell
region, computes the area by counting the number of pixels inside the region and the
volume by measuring the long and short axes of the cell. Cell volume is then derived
assuming a prolate spheroid shape as described before
9
.
To calculate fluorescent ratios (FR) between septal and membrane signal, eHooke was
used to define the different regions of the cell, namely membrane, cytoplasm and septum
in images obtained by wide-field fluorescence microscopy. The membrane is defined
by dilating the outline of the cell towards its inside. To separate the septum from
the cytoplasm the software uses the isodata algorithm
40
to find the brightest region inside the cell. This region is then defined as the septum.
To measure the median fluorescence, only the 25% brightest pixels of the septum were
considered, in order to remove possible misidentified pixels from the measurement.
Only cells with a closed septum were selected for measurements. FR values were then
calculated according to the equation FR =[Median(Septum)-Background]/[Median(Membrane)-Background].
In order to measure the Pearson’s Correlation Coefficient (PCC) between two fluorescent
proteins in a strain, images of each fluorescence channel were aligned and loaded
side-by-side in eHooke. Following automatic cell segmentation, cells showing an FtsZ
signal at the septum were selected for PCC measurements. The pixels corresponding
to each cell were isolated and PCC values between channels were then calculated using
the following equation, adapted from
43
:
PCC
=
∑
i
(
X
i
-
X
¯
)
(
Y
i
-
Y
¯
)
∑
i
(
X
i
-
X
¯
)
2
∑
i
(
Y
i
-
Y
¯
)
2
, where Xi and Yi correspond to each pixel intensity for two fluorescence channels
and X̄ and Ȳ correspond to the mean intensities of those channels.
Code availability
Code is available in https://github.com/BacterialCellBiologyLab/Bruno-Saraiva-2017
Statistical Analysis
Statistical analyses were done using GraphPad Prism 6 (GraphPad Software). Unpaired
student’s t-tests were used to evaluate the differences of cellular volumes as well
as to compare fluorescence ratios between peripheral and septal wall signal intensity.
Mann-Whitney U tests were used to compare differences between PCC non-normal distributions
obtained in colocalisation experiments. P values ≤0.05 were considered as significant
for all analysis performed and were indicated with asterisks: *P≤0.05, **P≤0.01 and
***P≤0.001.
Data availability
Source data for figures 1–3 and 5 and Extended Data figures 1–4, 7 and 9 are provided
with the paper.
Extended Data
Extended Data Figure 1
Switching fluorescent tags has no effect on protein colocalisation data
COL strains expressing FtsZ-mCherry/FtsW-sGFP (a) or FtsZ-mCherry/MurJ-sGFP (b) were
compared to strains expressing FtsZ-CFP/FtsW-mCherry or FtsZ-CFP/MurJ-mCherry, respectively
(described in Fig. 2b and c). Scale bars, 2 μm. c, Pearson’s correlation coefficient
(PCC) values between fluorescence channels for each protein fusion pair were calculated
for cells showing septal FtsZ localisation. From left to right, N=138, 136, 133, 139
cells. Negative PCC values are represented as 0. Data are represented as box-and-whisker
plots where boxes correspond to the first to third quartiles, lines inside the boxes
indicate the median and ends of whiskers and outliers follow a Tukey representation.
Statistical analysis was performed using a two-sided Mann-Whitney U test (ns, not
significant). Images in (a,b) are representative of three biological replicates.
Extended Data Figure 2
Antisense RNA fragments targeting the DivIB/DivIC/FtsL complex increased cell volume
and decreased protein expression
a, Western blot showing total protein extracts of ColJZpAS-DivIB following 1 hour
of antisense induction and control ColJZpEPSA probed with antibodies against either
PBP2A (loading control - upper bands) or DivIB (lower bands). b, Western blot showing
total protein extracts of ColJZpAS-DivIC following 1 hour of antisense induction and
control ColJZpEPSA probed with antibodies against either PBP2A (loading control –
upper bands) or DivIC (lower bands). Images in (a,b) are representative of three biological
replicates. For gel source data, see Supplementary Figure 1. c, Cell volume of cells
expressing antisense RNA against ftsL, divIB or divIC, or carrying vector pEPSA (Left
to right, N=421, 379, 279, 361 cells). Data represented in column graphs where the
height of the column represents the mean and the whiskers are the standard deviation.
Statistical analysis was performed using a two-sided unpaired t-test (***P<0.001,
1st vs 2nd column, P = 3.50E-06; 1st vs 3rd column, P = 3.80E-08; 1st vs 4th column,
P = 1.27E-29).
Extended Data Figure 3
FtsW and PBP1 recruitment to the divisome is independent of FtsL/DivIB/DivIC complexes
Strains ColWZpAS-FtsL and ColP1ZpAS-FtsL, harbouring FtsZ-CFP/FtsW-mCherry and FtsZ-mCherry/sGFP-PBP1
fluorescent fusion pairs, respectively, were depleted of FtsL expression using antisense
RNA and imaged by wide field fluorescence microscopy. a, Frequency of FtsZ-CFP and
FtsW-mCherry co-occurrence in ColWZpAS-FtsL when compared to control ColWZpEPSA (N=200
for each). b, Frequency of FtsZ-mCherry and sGFP-PBP1 co-occurrence in ColP1ZpAS-FtsL
and in control ColP1ZpEPSA (N=200 for each). Very large FtsL-depleted cells were observed
where either FtsW-mCherry (c) or sGFP-PBP1 (d) co-localised with the FtsZ fusion at
the septum (arrows). e,f, Inhibition of divisome assembly at an early stage by depletion
of FtsA expression in either ColWZpAS-FtsA or ColP1ZpAS-FtsA prevented the recruitment
of FtsW-mCherry (e) or sGFP-PBP1 (f) to the septum, concomitant with FtsZ destabilisation.
Images in (c–f) are representative of three biological replicates. Scale bars, 1 μm.
Extended Data Figure 4
Inhibition of MurJ activity does not prevent its recruitment to midcell but impairs
PG synthesis
a, Fluorescence microscopy images of ColMurJ-mCherry cells grown in the presence (left)
or absence (right) of MurJ inhibitor DMPI for 30 minutes at 2X MIC. Scale bar, 2 μm.
b,c Fluorescence microscopy images showing mixed cultures of either (b) DMPI-treated
ColDltC-sGFPi cells mixed with COL cells or (c) DMPI-treated COL cells mixed with
ColDltC-sGFPi cells, following incubation with HADA. The two cultures, which can be
easily distinguished due to GFP expression in ColDltC-sGFPi, were mixed on the same
slide to decrease fluorescence variation of HADA signal due to imaging conditions.
Data shows that HADA incorporation (i.e. PG synthesis) is greatly reduced in the presence
of DMPI. Phase contrast/GFP channel overlays are shown on the left and phase contrast/HADA
channel overlays are shown on the right. Scale bars, 1 μm. d, e HADA fluorescence
signal measured at the midcell (Midcell), the periphery (Peripheral) or over the entire
cell (Total) of DMPI-treated ColDltC-sGFPi cells mixed with COL cells (d) or DMPI-treated
COL cells mixed with ColDltC-sGFPi cells (e). Images in (a–c) are representative of
three biological replicates. Data in (d,e) are represented as column plots (N=100
cells for each column) where the height of the column is the mean and the whiskers
indicate standard deviation. Statistical analysis was performed using two-sided unpaired
t-tests (***, P<0.001; panel d: P = 2.34E-38 for midcell; P = 1.81E-29 for peripheral;
P = 9.22E-34 for total; panel e: P = 1.74E-33 for midcell; P = 8.77E-25 for peripheral;
P = 7.60E-26 for total).
Extended Data Figure 5
Effect of antibiotics on cell cycle progression of S. aureus
SIM images of Nile Red stained COL cells treated with DMPI (MurJ inhibitor), PC190723
(FtsZ inhibitor), oxacillin (Oxa, cell wall synthesis inhibitor), DMSO or TSB (mock-treated
controls) for the duration of one cell cycle (30 min). Images are representative of
three biological replicates. Scale bars, 1 μm.
Extended Data Figure 6
Additional kymographs showing constriction of FtsZ55-56sGFP and MurJ-sGFP rings
a, Kymographs of 10 cells per column showing constriction of FtsZ55-56sGFP rings obtained
by imaging ColFtsZ55-56sGFP cells every 5 min for a total of 60 min (laser power 50%),
in the absence (Control) or presence of either PC190723 (+PC) or DMPI (+DMPI). Since
S. aureus cells are not synchronised, cells at all stages of cytokinesis can be observed.
Larger FtsZ55-56sGFP rings had a biphasic behaviour (no/slow constriction followed
by fast constriction) while smaller rings, further ahead in the cell cycle, were only
observed undergoing the fast constriction step. Addition of PC190723 inhibited constriction
of larger rings (see top two kymographs), but not of smaller rings, which were able
to complete cytokinesis. Addition of DMPI completely blocked constriction of FtsZ55-56sGFP
rings of all sizes. b, Kymographs showing constriction of MurJ-sGFP rings in ColMurJ-sGFP
cells imaged every 5 min for a total of 60 min (laser power 100%). Cells where MurJ-sGFP
signal appears on the second frame were chosen for analysis to ensure that the entire
constriction process was imaged. Fast constriction started immediately upon MurJ-sGFP
arrival to the division septum and therefore rings did not show biphasic behaviour.
Data are representative of three biological replicates. Scale bars, 0.5 μm.
Extended Data Figure 7
Z-ring protein EzrA shows impaired treadmilling in the presence of PC190723 and biphasic
ring constriction
a, ColpSGEzrA-GFP cells, expressing a functional EzrA fusion to GFP, were imaged by
SIM every 5 sec in the absence (EzrA control) or presence (EzrA + PC) of PC190723.
Kymographs were obtained by extracting fluorescence intensity values along the black
line indicated in cells in the left panels. Similarly to what was observed for FtsZ55-56sGFP,
addition of PC190723 abolished EzrA movement (vertical lines in the kymographs). b,
ColpSGEzrA-GFP cells were imaged by SIM every 5 min in the absence (left) or presence
(right) of PC190723 and kymographs showing constriction of EzrA-GFP rings were plotted.
In control conditions the larger EzrA rings showed biphasic constriction behaviour
while in the presence of PC190723 only the rings in the second stage of cytokinesis
were able to constrict. Data in (a, b) are representative of two biological replicates.
Scale bars, 1 μm. c, To test the functionality of the EzrA-GFP construct, strains
COL, ColpSGEzrA-GFP and COLΔEzrA (lacking ezrA) were imaged by phase contrast and
cell area was measured. The lack of EzrA in COLΔEzrA (N=959) resulted in cell enlargement,
while the size distribution of ColpSGEzrA-GFP (N=957) cells mimicked that of parental
strain COL (N=851), indicating that the EzrA fluorescent fusion is functional.
Extended Data Figure 8
Kymographs showing constriction of FtsZ55-56sGFP, FtsW-sGFP and MurJ-sGFP rings during
cell division
Strains ColFtsZ55-56sfGFP, ColFtsW-sGFP and ColMurJ-sGFP were imaged every 10 min
in the absence (control) or presence (+PC) of PC190723 for a total of 60 min. MurJ-sGFP
control kymographs were performed on cells where MurJ-sGFP signal appears on the second
frame, to ensure that the entire constriction process was observed (i.e. that the
absence of a biphasic behaviour did not result from only imaging cells in later stages
of cell division). FtsZ55-56sGFP and FtsW-sGFP rings showed a biphasic constriction
behaviour (no/slow constriction followed by fast constriction). Addition of PC190723
inhibited constriction of larger FtsZ55-56sfGFP and FtsW-sGFP rings (see top kymographs),
but not of smaller rings which were undergoing fast constriction. MurJ-sGFP rings
only displayed fast constriction and therefore were always able to constrict in the
presence of PC190723. Data are representative of three biological replicates. Scale
bars, 0.5 μm.
Extended Data Figure 9
Additional graphs of FtsZ, MurJ and FtsW ring diameter during constriction
a, Graphs of ring diameters of FtsZ-mCherry (red lines) and MurJ-sGFP (blue lines)
in strain ColJgZm. SIM images were taken every 10 min and measurements of ring diameter
of FtsZ-mCherry and MurJ-sGFP were performed in cells where MurJ-sGFP signal first
appeared after 20 minutes. b, Graphs of ring diameters of FtsZ-mCherry (red lines)
and FtsW-sGFP (blue lines) in strain ColWgZm. SIM images were taken every 10 min and
measurements of ring diameter of FtsZ-mCherry and FtsW-sGFP were performed in cells
where FtsZ-mCherry ring diameter was constant for at least the first 20 minutes.
Extended Data Figure 10
Model for cytokinesis in S. aureus
(i) Cells in Phase 1 of the cell cycle (before septum synthesis is initiated) synthesise
peptidoglycan at the cell periphery. (ii) In preparation for division, FtsZ and early
components of the divisome assemble at midcell. (iii) At this stage, cells initiate
the first, slow step of cytokinesis, which is dependent on FtsZ treadmilling. FtsZ
may be the driving force for the initial invagination of the membrane. (iv) MurJ then
arrives to the divisome, in a process dependent on the presence of the sub-complex
DivIB/DivIC/FtsL, bringing the PG precursor (lipid II) flippase activity to midcell.
The major S. aureus PG synthase, PBP2, is recruited to midcell through substrate (translocated
lipid II) recognition, and massive PG synthesis is initiated to synthesise the septum.
From this point onwards, cytokinesis no longer depends on FtsZ treadmilling and is
most likely driven by PG synthesis.
Supplementary Material
Supplementary Information Guide
Supplementary Table 1
Related collections
Most cited references36
- Record: found
- Abstract: found
- Article: not found
New vector for efficient allelic replacement in naturally nontransformable, low-GC-content, gram-positive bacteria.
- Record: found
- Abstract: found
- Article: not found
In Situ probing of newly synthesized peptidoglycan in live bacteria with fluorescent D-amino acids.
Erkin Kuru, H Velocity Hughes, Pamela Brown … (2012)
- Record: found
- Abstract: found
- Article: not found
How to get (a)round: mechanisms controlling growth and division of coccoid bacteria.
Morten Kjos, Mariana Pinho, Jan-Willem Veening (2013)