24
views
0
recommends
+1 Recommend
0 collections
    0
    shares
      • Record: found
      • Abstract: found
      • Article: found
      Is Open Access

      Prevalence of zero-sanitation in India: Patterns of change across the states and Union Territories, 1993-2021

      research-article
      1 , 2 , 3 , 4 , 5
      Journal of Global Health
      International Society of Global Health

      Read this article at

      Bookmark
          There is no author summary for this article yet. Authors can add summaries to their articles on ScienceOpen to make them more accessible to a non-specialist audience.

          Abstract

          Background

          Ensuring universal access to safe sanitation by 2030 is a development priority for India. Doing so can help ensure improved physical and mental health outcomes. While the proportion of people in India with safe sanitation has risen dramatically over the past thirty years, much less is known about who has been most at risk for not having access to safe sanitation across India’s states and Union Territories (UT) over this time period. We introduce the concept of zero-sanitation to fill this gap.

          Methods

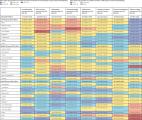
          Data from five National Family Health Surveys (NFHS) conducted in 1993, 1999, 2006, 2016, and 2021 from 36 states and UT were used for this study. The study population consisted for all household individuals regardless of age in each survey round. Zero-sanitation was defined as those who have no access to a household toilet, and thus defecate in the open. We analyzed the percent prevalence of zero-sanitation in every state / UT at each time period in both urban and rural communities, as well as the population headcount burden in 2021. We calculated the absolute change on an annual basis to assess the change in percentage points of zero-sanitation across time periods at the all-India and state / UT levels.

          Results

          The all-India prevalence of zero-sanitation declined from 70.3% (95% confidence interval (CI) = 70.2%-70.5%) in 1993 to 17.8% (95% CI = 17.7%-17.9%) in 2021. The median percent prevalence of zero-sanitation across states and UTs was 65.9% in 1993. By 2021, the median percent prevalence of zero-sanitation across states and UTs was 5.7%. This reduction corresponded with a reduction in the between state / UT inequality in zero-sanitation. Nevertheless, as of 2021, the prevalence of zero-sanitation was still above 20% in Bihar, Jharkhand, Madhya Pradesh, Odisha, Rajasthan, and Uttar Pradesh. Additionally, as of 2021, almost 92% of individuals who were defecating in the open were experiencing zero-sanitation. Zero-sanitation remains most common in states such as Bihar, Punjab, Uttar Pradesh, and Assam. Nevertheless, at this current rate of improvement, every state and UT except for Sikkim and Chandigarh are on track to end open defecation by 2030.

          Conclusions

          The concept of zero-sanitation is a useful tool in helping policy makers assess the extent to which sanitation coverage remains incomplete. When viewed through this lens, we see that open defecation remains most common among those who do not have a toilet. Addressing the myriad social determinants of sanitation access can help fill these gaps and ensure equitable sanitation coverage throughout India.

          Related collections

          Most cited references41

          • Record: found
          • Abstract: found
          • Article: found
          Is Open Access

          Sanitation and Health

          As one article in a four-part PLoS Medicine series on water and sanitation, David Trouba and colleagues discuss the importance of improved sanitation to health and the role that the health sector can play in its advocacy.
            Bookmark
            • Record: found
            • Abstract: found
            • Article: found
            Is Open Access

            Use of quantitative molecular diagnostic methods to investigate the effect of enteropathogen infections on linear growth in children in low-resource settings: longitudinal analysis of results from the MAL-ED cohort study

            Summary Background Enteropathogen infections in early childhood not only cause diarrhoea but contribute to poor growth. We used molecular diagnostics to assess whether particular enteropathogens were associated with linear growth across seven low-resource settings. Methods We used quantitative PCR to detect 29 enteropathogens in diarrhoeal and non-diarrhoeal stools collected from children in the first 2 years of life obtained during the Etiology, Risk Factors, and Interactions of Enteric Infections and Malnutrition and the Consequences for Child Health and Development (MAL-ED) multisite cohort study. Length was measured monthly. We estimated associations between aetiology-specific diarrhoea and subclinical enteropathogen infection and quantity and attained length in 3 month intervals, at age 2 and 5 years, and used a longitudinal model to account for temporality and time-dependent confounding. Findings Among 1469 children who completed 2 year follow-up, 35 622 stool samples were tested and yielded valid results. Diarrhoeal episodes attributed to bacteria and parasites, but not viruses, were associated with small decreases in length after 3 months and at age 2 years. Substantial decrements in length at 2 years were associated with subclinical, non-diarrhoeal, infection with Shigella (length-for-age Z score [LAZ] reduction −0·14, 95% CI −0·27 to −0·01), enteroaggregative Escherichia coli (−0·21, −0·37 to −0·05), Campylobacter (−0·17, −0·32 to −0·01), and Giardia (−0·17, −0·30 to −0·05). Norovirus, Cryptosporidium, typical enteropathogenic E coli, and Enterocytozoon bieneusi were also associated with small decrements in LAZ. Shigella and E bieneusi were associated with the largest decreases in LAZ per log increase in quantity per g of stool (−0·13 LAZ, 95% CI −0·22 to −0·03 for Shigella; −0·14, −0·26 to −0·02 for E bieneusi). Based on these models, interventions that successfully decrease exposure to Shigella, enteroaggregative E coli, Campylobacter, and Giardia could increase mean length of children by 0·12–0·37 LAZ (0·4–1·2 cm) at the MAL-ED sites. Interpretation Subclinical infection and quantity of pathogens, particularly Shigella, enteroaggregative E coli, Campylobacter, and Giardia, had a substantial negative association with linear growth, which was sustained during the first 2 years of life, and in some cases, to 5 years. Successfully reducing exposure to certain pathogens might reduce global stunting. Funding Bill & Melinda Gates Foundation.
              Bookmark
              • Record: found
              • Abstract: found
              • Article: found
              Is Open Access

              The burden of child and maternal malnutrition and trends in its indicators in the states of India: the Global Burden of Disease Study 1990–2017

              Summary Background Malnutrition is a major contributor to disease burden in India. To inform subnational action, we aimed to assess the disease burden due to malnutrition and the trends in its indicators in every state of India in relation to Indian and global nutrition targets. Methods We analysed the disease burden attributable to child and maternal malnutrition, and the trends in the malnutrition indicators from 1990 to 2017 in every state of India using all accessible data from multiple sources, as part of Global Burden of Diseases, Injuries, and Risk Factors Study (GBD) 2017. The states were categorised into three groups using their Socio-demographic Index (SDI) calculated by GBD on the basis of per capita income, mean education, and fertility rate in women younger than 25 years. We projected the prevalence of malnutrition indicators for the states of India up to 2030 on the basis of the 1990–2017 trends for comparison with India National Nutrition Mission (NNM) 2022 and WHO and UNICEF 2030 targets. Findings Malnutrition was the predominant risk factor for death in children younger than 5 years of age in every state of India in 2017, accounting for 68·2% (95% UI 65·8–70·7) of the total under-5 deaths, and the leading risk factor for health loss for all ages, responsible for 17·3% (16·3–18·2) of the total disability-adjusted life years (DALYs). The malnutrition DALY rate was much higher in the low SDI than in the middle SDI and high SDI state groups. This rate varied 6·8 times between the states in 2017, and was highest in the states of Uttar Pradesh, Bihar, Assam, and Rajasthan. The prevalence of low birthweight in India in 2017 was 21·4% (20·8–21·9), child stunting 39·3% (38·7–40·1), child wasting 15·7% (15·6–15·9), child underweight 32·7% (32·3–33·1), anaemia in children 59·7% (56·2–63·8), anaemia in women 15–49 years of age 54·4% (53·7–55·2), exclusive breastfeeding 53·3% (51·5–54·9), and child overweight 11·5% (8·5–14·9). If the trends estimated up to 2017 for the indicators in the NNM 2022 continue in India, there would be 8·9% excess prevalence for low birthweight, 9·6% for stunting, 4·8% for underweight, 11·7% for anaemia in children, and 13·8% for anaemia in women relative to the 2022 targets. For the additional indicators in the WHO and UNICEF 2030 targets, the trends up to 2017 would lead to 10·4% excess prevalence for wasting, 14·5% excess prevalence for overweight, and 10·7% less exclusive breastfeeding in 2030. The prevalence of malnutrition indicators, their rates of improvement, and the gaps between projected prevalence and targets vary substantially between the states. Interpretation Malnutrition continues to be the leading risk factor for disease burden in India. It is encouraging that India has set ambitious targets to reduce malnutrition through NNM. The trends up to 2017 indicate that substantially higher rates of improvement will be needed for all malnutrition indicators in most states to achieve the Indian 2022 and the global 2030 targets. The state-specific findings in this report indicate the effort needed in each state, which will be useful in tracking and motivating further progress. Similar subnational analyses might be useful for other low-income and middle-income countries. Funding Bill & Melinda Gates Foundation; Indian Council of Medical Research, Department of Health Research, Ministry of Health and Family Welfare, Government of India.
                Bookmark

                Author and article information

                Journal
                J Glob Health
                J Glob Health
                JGH
                Journal of Global Health
                International Society of Global Health
                2047-2978
                2047-2986
                28 July 2023
                2023
                : 13
                : 04082
                Affiliations
                [1 ]Global Health & Social Medicine, Harvard Medical School, Boston, Massachusetts, USA
                [2 ]Center for Geographic Analysis, Harvard University, Cambridge, Massachusetts, USA
                [3 ]Division of Health Policy & Management, College of Health Science, Korea University
                [4 ]Harvard Center for Population and Development Studies, Cambridge, Massachusetts, USA
                [5 ]Department of Social and Behavioral Sciences, Harvard T.H. Chan School of Public Health, Boston, Massachusetts
                Author notes
                Correspondence to:
Dr. S V Subramanian
Harvard Center for Population and Development Studies, Cambridge, Massachusetts
USA
 svsubram@ 123456hsph.harvard.edu 
Dr. Rockli Kim
Division of Health Policy and Management, College of Health Science, Korea University, 145 Anam-ro, Seongbuk-gu, Seoul
South Korea
 rocklikim@ 123456korea.ac.kr
                Author information
                http://orcid.org/0000-0002-2195-4319
                http://orcid.org/0000-0001-8346-8634
                http://orcid.org/0000-0002-9864-3957
                http://orcid.org/0000-0003-2365-4165
                Article
                jogh-13-04082
                10.7189/jogh.13.04082
                10373110
                13ee381f-4891-40a7-8a1c-07b372dfcc5d
                Copyright © 2023 by the Journal of Global Health. All rights reserved.

                This work is licensed under a Creative Commons Attribution 4.0 International License.

                History
                Page count
                Figures: 5, Tables: 4, Equations: 3, References: 52, Pages: 13
                Categories
                Articles

                Public health
                Public health

                Comments

                Comment on this article