- Record: found
- Abstract: found
- Article: not found
Commonality despite exceptional diversity in the baseline human antibody repertoire
research-article

Bryan Briney
1
,
2
,
3
,
4 ,
Anne Inderbitzin
1
,
5 ,
Collin Joyce
1
,
2
,
3
,
4 ,
Dennis R. Burton
1
,
2
,
4
,
6
21 January 2019
Read this article at

There is no author summary for this article yet. Authors can add summaries to their articles on ScienceOpen to make them more accessible to a non-specialist audience.
Abstract
In principle, humans can make an antibody response to any non-self-antigen molecule
in the appropriate context. This is achieved by a large naïve antibody repertoire
whose diversity is expanded by somatic hypermutation (SHM) following antigen exposure.
1
The diversity of the naive human antibody repertoire is estimated to be at least 1012
unique antibodies.
2
Since the number of peripheral blood B cells in an healthy adult human is on the order
of 5×10⁹, the circulating B cell population samples only a small fraction of this
diversity. Full-scale analyses of human antibody repertoires have been prohibitively
difficult, primarily due to their massive size. The amount of information encoded
by all the rearranged antibody and T cell receptor genes in one person -- the “genome”
of the adaptive immune system -- exceeds the size of the human genome by more than
four orders of magnitude. Further, because much of the B lymphocyte population is
localized in organs or tissues that cannot be comprehensively sampled from living
subjects, human repertoire studies have focused on circulating B cells.
3
Here, we examine the circulating B cell populations of ten human subjects and present
the largest single collection of adaptive immune receptor sequences described to date,
comprising almost 3 billion antibody heavy chain sequences. This dataset allows genetic
study of the baseline human antibody repertoire at unprecedented depth and granularity,
revealing largely unique repertoires for each individual studied, a subpopulation
of universally shared antibody clonotypes, and exceptional overall repertoire diversity.
Eighteen sequencing libraries were generated for each of ten subjects (Figure ED1).
These libraries yielded 2.90×10⁹ raw reads. Following annotation,
4
which included duplicate removal using unique molecular identifiers,
5
we obtained 3.64×10⁸ productive antibody sequences (Table ED1).
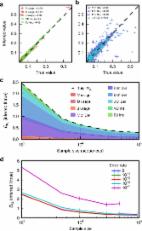
Amplification was reproducible, with similar gene usage between replicates (Figures
1A, ED2). The frequencies of IgM-encoding (0.62–0.94) and IgG-encoding (0.06–0.38)
sequences were consistent with the expected frequency of circulating B cells expressing
these isotypes (Figure 1B).
6
Although V-gene, J-gene and CDRH3 length (VJ-CDR3len) distributions were similar between
subjects (Figures 1C, E-F), differences were large enough that individual repertoires
could conceivably be distinguished using only these features. We reduced sequence
subsamples to VJ-CDR3len frequency distributions and quantified similarity using the
Morisita-Horn similarity index.
7,8
Subject repertoires were clearly distinguishable using as few as 104 sequences (Figures
1D, ED4) and did not cluster by age, gender or ethnicity (Figure 1G). The IgG+ repertoires
were least similar, suggesting that subjects’ unique immunological histories are a
significant contributor to repertoire individuality (Figure 1H). A one-versus-rest
support vector machine (SVM) classifier trained on VJ-CDR3len data from 5 of the 6
biological replicates from each subject accurately assigned the remaining replicate
using test/train datasets of as few as 500 sequences from each replicate (Figure 1I).
To estimate repertoire diversity while minimizing the effects of sequencing and amplification
error, we first considered clonotype diversity. An antibody clonotype is a collection
of sequences using the same V/J-genes and encoding an identical CDRH3 amino acid sequence.
9
For each subject, all sequences from each biological replicate were collapsed into
a set of unique clonotypes. Any clonotypes repeatedly observed after pooling deduplicated
biological replicates must be derived from different cells, providing a straightforward
means of quantifying multiple occurrence. For clarity, clonotypes or sequences present
in multiple biological replicates from a single subject will be called “repeatedly
observed”, while clonotypes or sequences found in multiple subjects will be called
“shared”.
Rarefaction curves indicated a low frequency of repeatedly observed clonotypes, supported
by capture-recapture sampling (3.9–11.7% recapture; Figure 2A, ED6). To estimate repertoire
diversity, we selected two estimators: Chao2 and Recon. Chao2 is a non-parametric
estimator that uses repeat occurrence data from multiple samples to estimate species
richness.
10
Recon uses maximum likelihood to estimate species richness, assuming only that the
overall size of the repertoire is large (relative to sampling depth) and well mixed.
11
These estimates represent the total diversity capable of being generated by the humoral
immune system. Accordingly, these estimates may greatly exceed the actual number of
B cells present in a single individual at any one time. The estimators produced similar
estimates of clonotype diversity for each subject, with identical rank order (Figure
2B). Recon consistently estimated about 2-fold greater repertoire diversity (2×10⁷-1×10⁹)
than Chao2 (1×10⁷-5×10⁸), consistent with reports that Chao2 underestimates richness
for samples with a non-negligible frequency of rare species.
12,13
Pooling unique clonotypes from multiple subjects allowed us to estimate cohort-wide
diversity (Figure 2C). Chao2 (5×10⁹) and Recon (5×10⁹) produced nearly identical estimates
for the complete 10-subject pool. Estimates of cohort-wide clonotype diversity exceed
individual subject estimates by less than two orders of magnitude, suggesting a relatively
high frequency of shared clonotypes. We next sought to estimate the sequence diversity
for each individual, again using both Chao2 and Recon estimators. As expected, the
estimates for sequences were substantially higher than for clonotypes, with Chao2
(2×10⁸-2×10⁹) and Recon (1×10⁸-2×10⁹) producing comparable estimates for each subject.
Unlike the cohort-wide clonotype estimates, Recon estimated much lower cohort-wide
sequence diversity (1×10¹⁰) than Chao2 (1×10¹¹; Figure 2E). The light chain repertoire
is estimated to be approximately four orders of magnitude less diverse than the heavy
chain repertoire (Figure ED7) and pairing of heavy and light chains is approximately
random,
14
producing a total paired sequence diversity estimate of 1016 to 1018. The most commonly
cited estimate for antibody repertoire diversity, 1012 unique sequences,
2
considers only the unmutated naïve repertoire. As such, our sequence diversity estimates,
which include both the naïve and memory sequences, are not directly comparable to
this previous estimate. Clonotype diversity estimates, which incorporate only V and
J gene assignments and the CDRH3 amino acid sequence, minimize the influence of SHM
and are more suitable for comparison with prior estimates of naïve repertoire diversity.
The cohort-wide paired clonotype diversity using either estimator, under the same
assumptions about light chain diversity and random pairing, is estimated at 3×10¹⁵,
over three orders of magnitude greater than previously estimated for the naïve repertoire.
While it is known that convergent antibodies may arise from different individuals
in response to immunological exposure and a low frequency of CDRH3 sharing has been
observed in healthy adult repertoires,
9,15
the overall prevalence of repertoire sharing is unknown. For each combination of two
or more subjects, we computed the frequency of shared clonotypes (Figure 3A). Pairs
of subjects shared, on average, 0.95% of their respective clonotypes and 0.022% of
clonotypes were shared by all ten subjects. We next used two approaches to quantify
the expected frequency of clonotype sharing by chance. Hypergeometric distributions,
based on cohort-wide clonotype diversity (Chao2) and the number of unique clonotypes
for each subject, indicated a low likelihood that the observed sharing was due to
chance (8.8×10⁻⁶, Bonferroni-corrected p=0.05 is 1.1×10⁻³). We also generated synthetic
antibody sequences using IGoR
16
to determine the expected frequency of clonotype sharing due to coincident V(D)J recombination.
Synthetic sequence sets were generated using three different recombination models:
1) IGoR’s default model, inferred from unproductive antibody rearrangements and is
thus focused only on parameters related to V(D)J recombination; 2) subject-specific
recombination models inferred from unmutated sequences from each subject; and 3) a
combined-subject recombination model inferred from a pool of unmutated sequences drawn
from all subjects. For each model, 10 batches of 108 sequences were generated, for
a total of 3 billion synthetic sequences. In the sequence sets generated with IGoR’s
default model, clonotype sharing was 7-fold lower than in human repertoires (0.0032%;
Figure 3B) indicating that coincident V(D)J recombination alone is not sufficient
to explain the observed sharing. The subject-derived synthetic sequence sets showed
much more sharing (0.1% and 0.16%, respectively; Figure 3B, ED8). In addition to containing
information about V(D)J recombination, the subject-derived models also implicitly
encode information about selection processes involved in B cell development. The increased
clonotype sharing frequency in subject-derived synthetic datasets indicates that the
sieving effect of B cell development produces naive repertoires that are more similar
than recombination alone would be expected to produce. Combined with our observation
that naive-enriched repertoires are more similar than class-switched repertoires (Figure
1H), a model emerges in which individual repertoires are quite dissimilar after V(D)J
recombination, are homogenized during B cell development, and become increasingly
individualized following differential responses to immunological exposure.
While the CDRH3 length distributions of unique and repeatedly observed clonotypes
were similar, short CDRH3s were much more common in shared clonotypes (Figure 3C-D).
The skew toward short CDRH3s in the shared population is likely due to the increased
probability of similar recombination events among shorter CDRH3s. In contrast, repeatedly
observed clonotypes are more often the result of clonal expansion, as evidenced their
increased mutation frequency (Figure 3I). Shared nucleotide sequences showed a strong
inverse relationship between mutation frequency and the number of shared subjects
(Figure 3K); virtually all sequences shared by 4 or more subjects were unmutated.
Thus, while coincident recombination infrequently produces identical antibody sequences,
the likelihood of coincident recombination linked to an identical set of somatic mutations
is exceptionally low.
Antibody CDRH3s can be divided into two primary regions: the framework-proximal “torso”
and the more variable “head”.
17,18
When comparing size-matched samples of shared and unshared clonotypes, we noted less
diversity in the head regions of shared clonotypes. Further, head region diversity
in shared clonotypes was inversely related to CDRH3 length, a relationship not seen
in unshared clonotypes or synthetic repertoires (Figure 3E). This inverse relationship,
along with the skewed distribution of CDRH3 lengths in shared clonotypes (Figure 3D),
indicates two distinct processes shaping the shared clonotype population. The shortest
shared CDRH3s encode head region diversity similar to unshared CDRH3s and synthetic
CDRH3s of the same length (Figure 3F). Thus, short CDRH3s are likely shared primarily
due to their lower CDRH3 diversity and concomitantly higher likelihood of independent
generation by coincident recombination. In contrast, longer shared CDRH3s are less
diverse than unshared or shared synthetic populations (Figure 3G) and more commonly
encode head regions enriched in polar, uncharged residues and lacking hydrophobic
residues (Figure 3H). This implies the existence of a mechanism by which these shared
clonotypes are selected or enriched post-recombination based on the biochemical properties
of their CDRH3 regions.
In summary, sequencing the circulating B cell population of ten individuals at unprecedented
depth has revealed repertoires that are highly individualized and extremely diverse.
We estimate cohort-wide repertoire diversity of approximately 5×10⁹ unique heavy chain
clonotypes and as many as 1×10¹¹ unique heavy chain sequences. This indicates that
the paired antibody diversity available to the circulating repertoire is very large,
perhaps in the region of 1016-1018 unique antibody sequences. Despite enormous diversity,
clonotypes are shared more frequently than would be expected from coincident V(D)J
recombination. Further, we found that clonotype sharing likely is driven primarily
by selection processes related to early B cell development rather than convergent
responses to common antigens. The possible clinical and diagnostic applications of
adaptive immune repertoire sequencing are myriad, however, much work remains. The
results described here are confined to circulating B cells, which represent a minority
of the total B cell population. The repertories of circulating and tissue-resident
B cells are known to differ,
19
and these differences may influence overall repertoire diversity and sharing. Further,
we have only studied ten individuals from a limited age range (18–30 years) and geographic
region at a single time point. Much larger cohorts representing diverse ethnicities,
geographies and ages will be required to capture the true population-wide repertoire
diversity. Nevertheless, large-scale sequencing of the human adaptive immune repertoire
holds immense potential. Our use of high-level antibody feature frequencies to differentiate
repertoires raises the possibility of identifying and classifying discrete repertoire
perturbations associated with autoimmune disease and chronic infection. Further, because
the adaptive immune receptor repertoire encodes a comprehensive record of an individual’s
immunological encounters, leveraging large-scale adaptive immune receptor sequencing
as a means to diagnose infection or deconvolute infection histories is appealing.
Finally, the individuality of each subject’s baseline repertoire suggests that personalization
of vaccine delivery and therapeutic intervention may produce substantial benefits
in the treatment and prevention of infectious diseases.
METHODS
Leukapheresis samples
Full leukopaks (3 blood volumes) were obtained from ten human subjects (Hemacare).
Samples were collected at Hemacare’s Southern California donor center. Sample collection
was performed under a protocol approved by the Institutional Research Boards of Scripps
Research and Hemacare. Informed consent was obtained from each subject. All subjects
were healthy, HIV-negative adults between the ages of 18–30 with no reported acute
illness in the 14 days prior to leukapheresis. The subject pool was gender balanced
and evenly divided between African-American and Caucasian individuals (ethnicity was
self-reported; Extended Data Table 1). Immediately upon receipt of the leukopak, peripheral
blood mononuclear cells (PBMCs) were purified by gradient centrifugation and cryopreserved.
Amplification strategy and primer bias
We elected to use RNA as the template for antibody variable gene amplification, as
this focuses our analysis on productive heavy chain rearrangements and permits the
use of amplification primers that anneal to the CH1 region (due to the presence of
an intron between the JH gene and CH region, the use of CH1 primers is not feasible
when amplifying from DNA). The decision to use RNA has some inherent downsides, however,
primarily the likelihood of over-representation of transcriptionally active B cells
(namely, memory B cells and plasmablasts). It should be noted that the use of molecular
barcodes, which allow identification and collapsing of reads that originate from the
same RNA molecule, will not correct this problem. To reduce the influence of multiplexed
primer sets on the resulting composition of antibody genes that are amplified, we
designed an amplification strategy that limits the use of multiplexed primers that
anneal to the variable (V) gene region in an attempt to reduce primer bias during
amplification. Following cDNA synthesis, 2nd strand synthesis was performed using
multiplexed V gene primers that encode an overhang that comprises a portion of the
Illumina adapters required for next-generation sequencing. V gene primers were then
enzymatically removed before subsequent amplification of the antibody genes using
the conserved overhang as the primer annealing site. Thus, the multiplexed V gene
primers were only used for a single round of amplification.
Antibody gene amplification
For each subject, total RNA was separately isolated from 6 aliquots of approximately
5×10⁸ cryopreserved PBMCs (RNeasy Maxi, Qiagen). For each RNA aliquot, antibody genes
were amplified in triplicate (18 total samples per subject), with each of the technical
replicates processed independently and starting with a separate aliquot of the RNA
sample. To minimize the likelihood of cross-contamination between subjects, RT and
PCR reactions for each subject were processed in isolation, such that samples from
two different subjects were never in proximity during amplification reaction preparation.
All primers
20
are listed in Extended Data Table 2. In order to increase the sequencer-perceived
nucleotide diversity during each sequencing cycle, “offsets” were added to the RT
and 2nd strand synthesis primers. Three sets of these primers were synthesized, with
each set containing either 2, 4 or 6 random nucleotides at the offset position (see
Extended Data Table 2). These offsets stagger the conserved constant and framework
regions and result in much higher diversity during each sequencing cycle and minimize
the required PhiX spike. cDNA synthesis was performed on 11ul of RNA using 10pmol
of each primer in a 20ul total reaction (SuperScript III, Thermo Fisher Scientific)
using the manufacturer’s protocol and the following thermal cycling program: 55C for
60 minutes, 70C for 15 minutes. Residual primers and dNTPs were degraded enzymatically
(ExoSAP-IT, Thermo Fisher Scientific) according to the manufacturer’s protocol. The
entire enzyme-treated cDNA synthesis product was used in a 100ul second strand synthesis
reaction using 10pmol of each primer (HotStarTaq Plus, Qiagen) using the following
thermal cycling protocol: 95C for 5 minutes, 55C for 30 seconds, 72C for 10 minutes.
Residual primers and dNTPs were again degraded enzymatically (ExoSAP-IT) and dsDNA
was purified using 0.8 volumes of SPRI beads (AmpureXP, Beckman Coulter Genomics)
and eluted in 50uL of water. Antibody genes were amplified using 40uL of eluted dsDNA
and 10pmol of each primer in a 100ul total reaction volume (HotStarTaq Plus) using
the following thermal cycling program: 95C for 5 minutes; 25 cycles of: 95C for 30
seconds, 58C for 30 seconds, 72C for 2 minutes; 72C for 10 minutes. DNA was purified
from the PCR reaction product using 0.8 volumes of SPRI beads (AmpureXP) and eluted
in 50uL of water. 10ul of the eluted PCR product was used in a final indexing PCR
(HotStarTaq Plus) using 10pmol of each primer in 100ul total reaction volume and using
the following thermal cycling program: 95C for 5 minutes; 10 cycles of: 95C for 30
seconds, 58C for 30 seconds, 72C for 2 minutes; 72C for 10 minutes. PCR products were
purified with 0.7 volumes of SPRI beads (SPRIselect, Beckman Coulter Genomics) and
the entire set of samples from a single subject were eluted in a single 120ul volume
of water.
Sequencing
SPRI-purified sequencing libraries were initially quantified using fluorometry (Qubit,
Thermo Fisher Scientific) before size determination using a bioanalyzer (Agilent 2100).
Libraries were re-quantified using qPCR (KAPA Biosystems) before sequencing on an
Illumina HiSeq 2500 using 2×250bp Rapid Run chemistry.
Raw sequence processing
Raw paired FASTQ files were quality checked with FASTQC (www.bioinformatics.babraham.ac.uk/projects/fastqc/).
Because the 5’ end of each paired read encodes the unique molecular identifier (UMI),
reads were quality trimmed only at the 3’ end using Sickle (www.github.com/najoshi/sickle),
using a window size of 0.1 times the length of the read, minimum average window quality
score of 20, and a minimum read length after trimming of 50 nucleotides. Because UMIs
are located on the ‘outside’ of the gene-specific primers used for amplification (see
Extended Data Figure 1B), primer trimming was delayed until after UMI processing.
Processed reads were quality checked again using FASTQC, and paired reads were merged
with PANDAseq using the default (simple_bayesian) merging algorithm.
21
Molecular barcodes
Although sequencing libraries were constructed to encode molecular barcodes on both
ends of the amplicon, we observed low-level PCR recombination
22
which produced “barcode swapping”, causing the frequency of these amplification artifacts
to be amplified. In essence, a partial amplification product, composed of a CDRH3
and an incomplete VH gene, was able to prime a different antibody sequence and continue
amplification, producing a hybrid VH gene. This hybrid amplicon encodes the 3’ molecular
barcode from the primary antibody recombination and the 5’ molecular barcode from
the second. The barcode swapping creates a unique barcode pair, forcing the hybrid
sequence to be binned and processed separately. To minimize the effects of such barcode
swapping, we binned sequences using only the 3’ molecular barcode. Because the likelihood
of UMI collisions was relatively high given the sequencing depth, the CDRH3 nucleotide
sequences of each UMI bin containing more than one sequence were clustered at high
identity (90%) and a consensus sequence was computed for each cluster. For UMI bins
containing only a single sequence, the lone sequence was used as the representative
for the respective UMI bin. Because our sequencing depth was approximately equal to
the number of input cells (~3×10⁸ sequencing reads from ~3×10⁸ input B cells), the
majority of UMI bins contained only a single sequencing read. As such, the UMIs were
not used primarily for error correction, but as a means for correcting differential
representation arising from stochastic or primer-driven amplification biases. Mutation
frequencies in the IgM and IgG sequence populations (Extended Data Figure 3) provide
empirical evidence of a low amplification/sequencing error rate that corroborates
sequencer-derived quality metrics.
Germline gene assignment and annotation
Adapters and V-gene amplification primers (used for second strand synthesis) were
removed using cutadapt.
23
cDNA synthesis primers, which anneal to the CH1 region, were not removed because this
region is needed to determine the isotype. Sequences were annotated with abstar
4
and two output formats were generated: a comprehensive JSON-formatted output, which
was imported into a MongoDB database; and a minimal CSV-formatted output, which is
tabular and suitable for direct parsing or conversion to Parquet for querying on a
Spark cluster.
Antibody clonotypes
Antibody clonotypes, defined as a collection of sequences that use the same V and
J germline segments and encode an identical CDRH3 amino acid sequence, were used throughout
this study to reduce the influence of sequencing or amplification error. Although
collapsing the V/J regions to just the germline assignment removes the possibility
of double-counting sequences that differ only by error(s) in the V- or J-gene region,
it does not eliminate the impact of error in the CDRH3. To gauge the effect of sequencing
and amplification error in the CDRH3 on clonotype diversity, we collapsed sequences
into clonotypes allowing either no mismatches in the CDRH3 amino acid sequence or
allowing a single mismatch in the CDRH3. The total number of 1-mismatch clonotypes
was lower than the number of 0-mismatch clonotypes by only 5.9% on average (3.4–9.5%),
which is as expected when collapsing a sequence population containing expanded antibody
lineages (Extended Data Figure 5) and indicates that CDRH3 sequencing errors do not
contribute meaningfully to clonotype diversity. Thus, only 0-mismatch clonotypes were
used for all further experiments utilizing clonotypes.
Estimation of light chain diversity relative to heavy chain diversity
Estimation of light chain diversity is, in some ways, more complex than estimating
heavy chain diversity due to the relatively high frequency of coincidentally identical
recombinations.
24
Rather than sequencing unpaired light chains and attempting to discern independent
rearrangements from distinct copies of RNA derived from the same recombination event,
we leveraged a novel dataset of paired antibody heavy and light chains to estimate
the diversity of light chains relative to the diversity of heavy chains.
24
For each of the three subjects for which paired heavy/light sequencing data was available,
we estimated the total richness using Chao2 and Recon estimators. Each subject was
sequenced in duplicate, and separated estimates were computed for each sequencing
replicate. Because the sequencing depth was far lower in the paired data set than
in the large-scale experiment described here, we extrapolated the richness estimates
so that the paired richness estimates were more comparable with the large-scale estimates.
Although such an extrapolation may introduce a non-trivial amount of variance into
the richness estimates, we believe that this provides the most accurate estimate of
relative light chain diversity that is currently available. Diversity estimates and
the associated extrapolations can be found in Extended Data Figure 7. The highest
ratio of heavy chain to light chain richness (indicating the lowest diversity of light
chains relative to heavy chains) was observed with the Chao2 estimator (3.8×10³).
Conservatively, we rounded this ratio up to the nearest order of magnitude (104) when
computing the total paired repertoire diversity estimates.
Generating synthetic repertoires based on a probabilistic model of V(D)J recombination
We created a total of 3 billion synthetic antibody sequences using IGoR
16
with one of three different approaches. First, we created 10 sequence batches, each
containing 108 synthetic antibody sequences, using IGoR’s default recombination model,
which was inferred from unproductive antibody rearrangements. The reason for using
unproductive rearrangements for inferring IGoR’s default recombination model is that
productive rearrangements are subject to a variety of selection processes during B
cell maturation (negative selection of autoreactive clones, requirement for productive
pairing with a light chain, etc), whereas unproductive rearrangements are subjected
to none of these selection processes. Thus, a model inferred from unproductive rearrangements
incorporates only information about the V(D)J recombination process. Second, we inferred
subject-specific recombination models using 5×10⁵ randomly selected IgM sequences
that were entirely unmutated in the V-gene region. Ten synthetic sequence batches,
each containing 108 sequences, were then generated, one batch per subject. Finally,
we inferred a combined-subject recombination model using a pool of 5×10⁵ umutated
IgM sequences from all 10 subjects (5×10⁴ sequences per subject, randomly selected
from the sequences used to generate the subject-specific models). As with IGoR’s default
model, 10 separate batches of 108 synthetic sequences were generated with the combined-subject
model. All synthetic sequences were processed in the same manner as the observed antibody
sequences, except that the adapter trimming and UMI-based correction steps were not
performed. Kullback-Leibler divergence between models or model “events” was computed
with the pygor package, which is distributed with IGoR (Extended Data Figure 8).
Morisita-Horn similarity
Antibody sequences from each subject were reduced to just the V-gene, J-gene and CDRH3
length (VJ-CDR3len) and were randomly sub-sampled with replacement at sample sizes
ranging from 101-107. The frequency of each VJ-CDR3len was computed, and the frequency
distributions from two donors was used to compute the Morisita-Horn similarity index:
C
H
=
2
∑
i
=
1
S
x
i
y
i
(
∑
i
=
1
S
x
i
2
X
2
+
∑
i
=
1
S
y
i
2
Y
2
)
X
Y
where x
i
is the number of times VJ-CDR3len i is represented in one sample of size X and y
i
is the number of times VJ-CDR3len i is represented in a second sample of size Y.
Rarefaction
For each subject, all unique clonotypes from each of the biological replicates were
pooled. For varying sample sizes (ranging from 0.1 to 1.0, as a fraction of the total
number of pooled clonotypes), samples were randomly drawn without replacement and
the number of unique clonotypes in the sample was computed. For each sample size,
a total of 10 independent samplings were performed, with the exception of the 1.0
fraction, which was only sampled once (as samplings of the entire dataset will always
produce the same result).
Classification of repertoires by subject
Repertoires were classified using one-vs-rest support vector machine classifier. Classifier
training and evaluation were performed in Python using the scikit-learn framework.
All code used for classification can be found at www.github.com/briney/grp_paper.
It is important to note that this classification was performed using only 10 subjects
and expanding the subject pool to thousands or millions of individuals while maintaining
classifier accuracy would likely require much larger training datasets and/or the
inclusion of additional sequence features to supplement the V-gene, J-gene, and CDRH3
length. Additionally, because the repertoire of each subject will be altered by new
immunological encounters and ongoing turnover in the naive B cell population, it is
possible that these high-level sequence feature frequencies will change substantially
over time.
Statistical calculations
Statistical calculations were performed in Python using SciPy (www.scipy.org) or Seaborn
(www.seaborn.pydata.org).
Extended Data
Extended Data Figure 1.
Nearly full-length antibody gene amplification from biological and technical replicate
samples.
a) Schematic of biological and technical replicate samples. Biological replicates
(columns) are derived from distinct cell aliquots, so identical clonotypes or sequences
found in multiple biological replicates must arise from different cells. Technical
replicates (rows) were amplified using discrete RNA aliquots from a single cell aliquot.
b) Strategy for nearly full-length antibody heavy chains. Black arrows indicate primers.
Primers in the cDNA synthesis step anneal to the heavy chain constant region (CH)
and add the first unique molecular identifier (UMI) and the Illumina read 1 primer
annealing site. Primers in the 2nd strand synthesis step anneal to the framework 1
(FR1) region of the variable gene and add a second UMI and the Illumina read 2 primer
annealing site.
Extended Data Figure 2.
V/J frequency correlations of technical and biological replicates.
For each subject, the frequency of V/J combinations was compared for technical replicates
(left panels) or biological replicates (right panels). The coefficient of determination
(r
2
) is shown for each plot.
Extended Data Figure 3.
Nucleotide mutation frequencies.
a) The distribution of nucleotide mutations in sequences encoding IgM are shown. On
the right, the number of unmutated sequences containing no mutations in the variable
gene segment is also plotted. b) The distribution of nucleotide mutations in sequences
encoding IgG are shown. On the right, the mean mutation frequency for the IgG population
of each subject is shown. Each line represents a single subject. For legibility, the
legend is split between the two plots. Although only five subjects are shown in the
legend of each plot, data from all ten subjects is present in each plot.
Extended Data Figure 4.
Cross-subject repertoire similarity.
Pairwise Morisita-Horn similarity comparisons between each subject and all other subjects.
Similarity was computed using the frequency of V-gene, J-gene and CDRH3 length combinations.
Each line represents the mean of 20 independent repertoire samplings (with replacement).
The shading surrounding the mean line indicates the 95% confidence interval.
Extended Data Figure 5.
Collapsing sequences into clonotypes.
a) To demonstrate the effect of collapsing an expanded clonal lineage into clonotypes,
we selected a previously reported lineage of Zika-specific monoclonal antibodies isolated
from the plasmablast population of an acutely infected patient.
25
Of 119 sequences, 89 were unique at the nucleotide level. b) Sequences encoding the
same V-gene, J-gene and an identical CDRH3 amino acid sequence were collapsed into
clonotypes, and the sequence phylogeny was colored by clonotype. 119 total sequences
were collapsed into 18 clonotypes. c) Sequences were collapsed into clonotypes, allowing
a single mismatch in the CDRH3 amino acid sequence, and the sequence phylogeny was
colored by clonotype. 119 total sequences were collapsed into 10 clonotypes. d) The
clonotype fraction (number of clonotypes divided by the total number of filtered sequences)
when collapsing clonotypes while allowing zero or one mismatch in the CDRH3 amino
acid sequence for each subject in this study. e) Number of total clonotypes recovered
when allowing zero or one mismatch in the CDRH3 amino acid sequence for each subject
in this study.
Extended Data Figure 6.
Capture-recapture frequency.
a) Recapture frequency for each subject. Lines represent the mean of 10 random samplings
(without replacement) for all subsample fractions except compete sampling (1.0). b)
Mean recapture frequency for each subsample fraction.
Extended Data Figure 7.
Relative light chain diversity estimation.
Using previously reported datasets of paired heavy and light antibody chains, clonotype
diversity was estimated for heavy and light chains using both Chao2 and Recon estimators.
Estimates are shown in filled or unfilled points. Lines indicate the least squares
polynomial best fit (degree=2) and is extrapolated to include both the lowest (1.17×10⁸)
and highest (9.06×10⁸) number of UMI-corrected sequences from the 10 sequenced subjects.
Extended Data Figure 8.
Variance between inferred V(D)J recombination models.
a) Frequency of clonotype sharing between observed human subjects (black), synthetic
datasets generated with IGoR’s default recombination model (red), synthetic datasets
generated with subject-specific recombination models (blue) or synthetic datasets
generated with a combined subjects recombination model (purple). b) Combined Kullback-Leibler
divergence (KL divergence) between pairs of subject-specific models (blue), between
subject-specific models and IGoR’s default model (red), or between subject-specific
models and the combined-subject model (purple). c) Combined KL divergence between
pairs of subject-specific models, separated by “event” type.
Extended Data Table 1.
Per-subject demographic information and sequencing statistics.
All ethnicities are self-reported.
Subject
Age
Gender
Blood Type
Ethnicity
Raw reads
Consensus sequences
Consensus
0 mismatch
1 mismatch
316188
30
female
A-POS
AA
320,844,194
11,767,640
2,061,409
1,865,584
326650
18
female
O-POS
C
218,356,368
24,592,893
8,295,298
7,935,396
326651
19
male
O-POS
AA
298,965,776
86,637,579
31,470,867
30,168,620
326713
25
female
O-POS
AA
228,526,194
90,598,768
41,809,045
40,405,491
326780
29
male
O-NEG
C
295,183,125
17,991,497
4,400,086
4,084,795
326797
21
female
A-POS
C
341,880,369
39,963,919
8,483,433
8,009,495
326907
29
male
AB-POS
C
275,955,787
35,726,036
8,021,582
7,621,784
326907
29
female
O-NEG
AA
267,970,240
13,528,917
3,236,704
3,030,208
327059
26
male
B-POS
AA/C
332,209,280
30,967,338
9,227,298
8,655,199
D103
25
male
O-NEG
C
322,781,254
11,746,606
2,914,936
2,696,342
AA: African-American, C: Caucasian
Extended Data Table 2.
Primers used for antibody gene amplification.
Regions in parenthesis indicate “offset” positions. Random offset nucleotides are
added in multiples of 2. Xs indicate the position of Illumina TruSeq indexes.
Name
Sequence
Step
lgM-RT
ACACTCTTTCCCTACACGACGCTCTTCCGATCTNNNNNNNNNNNN(NNNNNN)GGTTGGGGCGGATGCACTCC
RT
lgG-RT
ACACTCTTTCCCTACACGACGCTCTTCCGATCTNNNNNNNNNNNN(NNNNNN)SGATGGGCCCTTGGTGGARGC
RT
VH1-2SS
AGACGTGTGCTCTTCCGATCT(NNNNNN)GGCCTCAGTGAAGGTCTCCTGCAAG
2nd strand synthesis
VH2-2SS
AGACGTGTGCTCTTCCGATCT(NNNNNN)GTCTGGTCCTACGCTGGTGAACCC
2nd strand synthesis
VH3-2SS
AGACGTGTGCTCTTCCGATCT(NNNNNN)CTGGGGGGTCCCTGAGACTCTCCTG
2nd strand synthesis
VH4-2SS
AGACGTGTGCTCTTCCGATCT(NNNNNN)CTTCGGAGACCCTGTCCCTCACCTG
2nd strand synthesis
VH5-2SS
AGACGTGTGCTCTTCCGATCT(NNNNNN)CGGGGAGTCTCTGAAGATCTCCTGT
2nd strand synthesis
VH6-2SS
AGACGTGTGCTCTTCCGATCT(NNNNNN)TCGCAGACCCTCTCACTCACCTGTG
2nd strand synthesis
R1-fwd
GTGACTGGAGTTCAGACGTGTGCTCTTCCGATC
PCR1
R1-rev
ACACTCTTTCCCTACACGACG
PCR1
R2-fwd
CAAGCAGAAGACGGCATACGAGAGATCGGTCTCGGCATTCCTGCTGAAGATXXXXXXGTGACTGGAGTTCAGACGTGTGCTCTTCCGATC
PCR2
R2-rev
AATGATACGGCGACCACCGAGATCTACACTCTTTCCCTACACGACG
PCR2
Supplementary Material
Reporting summary
Related collections
Most cited references14
- Record: found
- Abstract: found
- Article: not found
Clonal selection and learning in the antibody system.
K Rajewsky (1996)
- Record: found
- Abstract: found
- Article: not found
DNA recombination during PCR.
J-P Vartanian, A Meyerhans, S Wain-Hobson (1990)
- Record: found
- Abstract: found
- Article: found
High-throughput immune repertoire analysis with IGoR
Quentin Marcou, Thierry Mora, Aleksandra Walczak (2018)