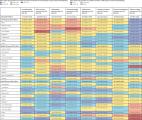
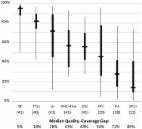
INTRODUCTION The proportion of pregnant women receiving 4 or more antenatal care visits (ANC 4+) has pride of place as a global benchmark indicator, standing in as a proxy for adequacy of antenatal care (ANC). It has been used as an indicator both for Millennium Development Goal 5 (improve maternal health) 1 and for the United Nations Secretary General's Commission for Information and Accountability for Women's and Children's Health. 2 In the late 1990s, José Villar led a multicountry study, 3 under the auspices of the World Health Organization (WHO), comparing a more goal-oriented, abbreviated, 4-visit schedule with conventional ANC. Conventional ANC comprised about 12 visits (one visit each month during the first 6 months of pregnancy, once every 2–3 weeks for the next 2 months, and once a week thereafter until delivery). On most measures, there were no differences in maternal or perinatal outcomes. These findings have been the basis for adoption of the ANC 4+ indicator as a marker of receipt of adequate antenatal care. Since that time, along with skilled birth attendance, ANC 4+ has been the most frequently used summary measure of maternal health program performance. This has had the unfortunate consequence of drawing the attention of program managers away from the content and process of care and toward mere contact. But content and process of care matter. As Bhutta and colleagues have documented in their comprehensive review, 4 there is significant scope for improving health outcomes, even with a simple package of antenatal interventions that can be delivered by health auxiliaries consisting of: Tetanus toxoid Intermittent presumptive/preventive treatment of malaria Iron–folate and calcium supplementation Deworming Detection and treatment of preeclampsia, syphilis, and asymptomatic bacteriuria Counseling about essential newborn care practices (immediate and exclusive breastfeeding, clean delivery, and thermal protection) and care-seeking for institutional delivery and danger signs Focusing on the proportion of pregnant women making at least 4 antenatal visits to measure program performance has drawn the attention away from the content of care to mere contact. Clearly, it is not mere contact that results in better outcomes; it is the actual substance of care delivered. Using data from the Demographic and Health Surveys (DHS), this paper explores the extent to which the ANC 4+ indicator tells us anything useful about the substance of care and proposes an alternative indicator to measure program performance. METHODS Recent DHS data from 41 countries were analyzed, retaining information on pregnancies during the preceding 2 years for which the mother reported receiving 4 or more ANC visits. From these data, we determined the proportion of survey respondents who reported receipt of 8 specific clinical preventive services: Blood pressure measurement Full protection against tetanus First antenatal visit at less than 4 months gestation Urine testing Counseling about danger signs HIV counseling and testing Iron–folate supplementation for at least 90 days At least 2 doses of sulfadoxine/pyramethamine (SP) for presumptive/preventive malaria treatment Surveys retained for this analysis had to have values for at least 5 of these interventions of interest. Among the surveys retained, the main distinction in which data were included was the presence or absence of HIV- and malaria-related indicators. A “quality–coverage gap” was calculated for each of these services—across the 41 surveys—as the difference between expected (100%) and actual coverage. We also present additional DHS analysis on coverage for this set of services using, as the denominator, all women having a birth in the 2 years preceding the survey (regardless of the number of ANC visits received). For each country survey, a simple mean was calculated across the set of retained antenatal indicators listed above as well as the proportion of women who reported receiving all the interventions. The country surveys were conducted by MEASURE DHS, a project of the Bureau for Global Health at the U.S. Agency for International Development (USAID). All the datasets are available online at www.dhsprogram.com. Analysis was done using Stata 12.1. In line with DHS practice, women not providing a response or answering “do not know” to questions on services received were retained in the denominators for calculation of the indicators (that is, it was assumed that they did not receive those services). 5 Results from each country were calculated using the weighting and sampling information and procedures specified in the DHS datasets and documentation. RESULTS Quality of Care Among Those Receiving 4+ Visits The analysis presented in Table 1 can be considered as characterizing the quality of care received, among women who reported receiving 4 or more ANC visits. Colombia, the Dominican Republic, and Nepal performed well; average coverage across the indicators measured in those surveys was 83%–85% (a quality–coverage gap of 15%–17%). Although Nepal performed as well as the other 2 countries with regard to average coverage, a considerably smaller proportion of pregnant women in Nepal reported 4+ visits (53% versus 87% in Colombia and 96% in the Dominican Republic). Timor-Leste, Indonesia, and Lesotho were the median performers across the 41 countries, with average coverage across indicators of 58% (average quality–coverage gap of 42%). The poorest performing countries were the Democratic Republic of Congo and Burundi, with an average coverage across indicators of 32% and 36% (quality–coverage gaps of 68% and 64%, respectively). TABLE 1. Receipt of Specific Services Among Pregnant Women With 4+ ANC Visitsa (%) Survey ANC4+ ANC<4mo IFA90+ TT2+ DSs BP Ur HIV SP2+ AVG Colombia 2010 87 82 62 83 100 98 85 85 Dominican Rep 2007 96 84 66 92 70 99 97 86 85 Nepal 2011 53 72 78 97 87 94 72 83 Maldives 2009 87 93 65 86 51 97 95 81 Honduras 2005–06 79 79 73 75 68 97 79 78 Rwanda 2010 36 73 74 88 43 96 75 Peru 2007–08 88 75 17 69 84 98 81 71 India 2005–06 36 80 32 93 34 89 85 69 Philippines 2008 76 61 35 80 75 96 60 68 Senegal 2010–11 48 78 68 75 48 98 88 39 47 68 Burkina Faso 2010 33 65 50 91 56 97 89 41 50 67 Ghana 2008 76 65 44 77 75 98 93 32 51 67 Bolivia 2008 72 76 10 66 70 98 77 66 Cambodia 2010 64 81 14 94 83 96 42 48 65 Guyana 2009 77 53 30 42 64 96 94 78 65 Haiti 2005–06 51 73 32 76 50 98 76 36 63 Pakistan 2006–07 29 70 29 84 33 92 70 63 Cameroon 2011 59 47 65 87 50 96 89 30 35 62 Swaziland 2006–07 77 27 30 82 54 98 91 53 62 Malawi 2010 43 23 27 90 81 85 31 88 61 61 Timor-Leste 2009–10 54 64 20 91 61 95 20 58 Indonesia 2007 81 84 31 56 43 95 42 58 Lesotho 2009 66 40 9 84 59 97 73 46 58 Namibia 2006–07 70 36 29 56 63 97 92 73 11 57 Benin 2006 59 61 61 74 42 99 93 20 4 57 Ethiopia 2011 17 40 81 29 83 56 49 56 Zambia 2007 57 26 41 83 75 79 21 39 74 55 Kenya 2008–09 44 26 3 83 53 89 76 83 20 54 Liberia 2007 66 72 13 86 40 87 52 14 52 Tanzania 2010 39 26 2 93 56 71 58 75 34 52 Guinea 2005 46 49 35 86 29 93 65 5 52 Zimbabwe 2010–11 59 25 5 64 66 88 60 82 10 50 Uganda 2011 46 33 6 90 57 66 28 78 31 49 Nigeria 2008 44 28 22 77 64 86 75 26 10 48 Congo (Brazzaville) 2005 72 55 17 54 40 95 95 8 3 46 Mali 2006 36 57 24 78 32 92 53 11 17 46 Sierra Leone 2008 56 39 15 87 60 87 42 12 14 44 Madagascar 2008–09 46 42 8 79 52 83 34 8 8 39 Niger 2006 15 46 25 57 28 90 46 5 13 39 Burundi 2010 33 39 7 91 40 50 12 46 1 36 Dem Rep Congo 2007 47 28 2 47 42 73 51 8 8 32 Mean 57 55 30 79 58 91 67 49 25 60 Abbreviations: ANC4+, 4 or more antenatal care visits; ANC<4mo, first antenatal care visit before 4 months gestation; BP, blood pressure; DSs, counseled on pregnancy danger signs; HIV, HIV counseling and testing; IFA, iron–folic acid supplementation for 90+ days; SP2+, at least 2 doses of sulfadoxine/pyramethamine for malaria prevention; TT2+, protected against tetanus; Ur, urine specimen taken. AVG: Average coverage across the 8 interventions (or fewer, if specific intervention(s) not included in the survey). Country data are presented in order, from highest average coverage to lowest. a Self-reported receipt of services among women delivering during the 2 years preceding the survey and reporting 4+ ANC visits. As seen in the Figure, with the exception of blood pressure measurement, there were marked quality–coverage gaps for each of these elements of care for most countries, ranging from 18% to 86%. The greatest gap was for 2 commodity-dependent functions—iron–folate supplementation (72%) and presumptive/preventive treatment for malaria with SP (86%). (HIV testing and tetanus toxoid are also commodity-dependent, but supply is commonly managed under separate, vertical systems; iron–folate and SP provision normally does not benefit from such special logistical arrangements.) FIGURE. Coverage for Key ANC Services Among Pregnant Women With 4+ ANC Visits,a Across 41 Demographic and Health Surveys a Self-reported receipt of services among women delivering during the 2 years preceding the survey and reporting 4+ ANC visits. Abbreviations: ANC, antenatal care; ANC<4mo, first antenatal care visit before 4 months gestation; BP, blood pressure; DSs, counseled on pregnancy danger signs; HIV, HIV counseling and testing; IFA, iron–folic acid supplementation for 90+ days; SP2+, at least 2 doses of sulfadoxine/pyramethamine for malaria prevention; TT2+, protected against tetanus; Ur, urine specimen taken. The horizontal line in the middle of each solid box indicates the median; the top and bottom borders of the box mark the 75th and 25th percentiles, respectively. The “whiskers,” or lines, below and above the box mark the minimum and maximum values, respectively. Numbers in parentheses in the x-axis refer to the number of surveys providing data for that particular indicator. The greatest quality–coverage gaps were for iron–folate supplementation and preventive treatment for malaria, both of which depend on reliable commodity supplies. Effective Coverage at Population Level Whereas Table 1 presented intervention-specific coverage among those reporting 4 or more ANC visits (that is, those who are supposedly “covered” with respect to ANC services), Table 2 presents data calculated for all women delivering over the previous 2 years as the denominator, reflecting effective coverage at the population level. Specifically, mean coverage across all the antenatal indicators offers an alternative summary measure that could be considered for antenatal program performance. TABLE 2. Receipt of Specific Services Among All Pregnanciesa (%) Survey ANC4+ ANC<4mo IFA90+ TT2+ DSs BP Ur HIV SP2+ AVG ALL Dominican Rep 2007 96 81 65 91 69 99 96 86 84 34 Maldives 2009 87 90 64 86 51 97 95 81 28 Colombia 2010 87 74 59 79 96 94 80 80 34 Honduras 2005–06 79 65 61 71 60 89 68 69 10 Rwanda 2010 36 40 84 71 84 36 92 68 8 Peru 2007–08 88 68 15 66 78 93 75 66 7 Nepal 2011 53 50 52 84 66 76 51 63 22 Guyana 2009 77 46 29 42 62 94 91 71 62 4 Philippines 2008 76 50 28 74 67 89 52 60 10 Ghana 2008 76 54 36 70 67 94 86 27 46 60 5 Senegal 2010–11 48 58 56 70 42 93 80 30 40 59 3 Swaziland 2006–07 77 22 25 78 50 96 86 50 58 2 Burkina Faso 2010 33 40 34 86 50 93 81 31 39 57 1 Bolivia 2008 72 60 8 58 60 89 65 57 3 Cambodia 2010 64 63 10 88 73 84 34 38 56 2 Malawi 2010 43 12 15 87 78 82 27 85 55 55 1 Namibia 2006–07 70 30 24 56 58 92 88 68 11 53 0 Indonesia 2007 81 74 25 50 39 88 37 52 4 Lesotho 2009 66 30 6 75 49 88 63 42 50 1 Zambia 2007 57 18 28 79 70 75 19 39 66 49 1 Cameroon 2011 59 32 43 74 40 79 72 23 26 49 2 Haiti 2005–06 51 61 18 62 38 82 55 24 49 8 Timor-Leste 2009–10 54 43 12 78 48 82 15 46 1 Benin 2006 59 40 42 61 34 88 81 14 3 45 0 Tanzania 2010 39 14 1 91 50 64 47 68 27 45 0 Liberia 2007 66 59 11 77 38 79 46 0 44 2 Kenya 2008–09 44 14 1 72 40 77 61 70 15 44 0 Uganda 2011 46 20 3 85 49 55 21 72 27 42 0 Zimbabwe 2010–11 59 16 3 54 55 75 50 68 8 41 0 India 2005–06 36 43 15 76 19 48 44 41 4 Sierra Leone 2008 56 29 13 81 56 81 37 10 12 40 0 Congo (Brazzaville) 2005 72 42 13 45 34 82 82 7 0 38 0 Guinea 2005 46 32 19 22 72 47 4 32 0 Madagascar 2008–09 46 25 4 68 43 71 23 6 7 31 0 Burundi 2010 33 19 3 87 35 44 9 40 0 30 0 Nigeria 2008 44 16 12 48 38 53 46 15 6 29 0 Mali 2006 36 30 12 57 21 64 31 6 11 29 0 Dem Rep Congo 2007 47 18 1 37 33 62 42 6 7 26 0 Pakistan 2006–07 29 31 12 60 17 52 32 0 0 25 2 Ethiopia 2011 17 10 49 9 31 17 16 22 1 Niger 2006 15 13 7 23 12 41 18 1 0 14 0 Mean 57 40 21 69 49 78 55 43 20 50 Abbreviations: ANC4+, 4 or more antenatal care visits; ANC<4mo, first antenatal care visit before 4 months gestation; BP, blood pressure; DSs, counseled on pregnancy danger signs; HIV, HIV counseling and testing; IFA, iron–folic acid supplementation for 90+ days; SP2+, at least 2 doses of sulfadoxine/pyramethamine for malaria prevention; TT2+, protected against tetanus; Ur, urine specimen taken. AVG: Average coverage across the 8 interventions (or fewer, if specific intervention(s) not included in the survey). Country data are presented in order, from highest average coverage to lowest. a Self-reported receipt of services among all women delivering during the 2 years preceding the survey. The 2 tables (Table 1, reflecting ANC quality, and Table 2, reflecting population effective coverage) show somewhat similar rankings. For example, the top 7 performers are the same on these 2 measures. Most countries were underperformers—in the sense that average population effective coverage for actual content was lower than for ANC 4+. For only 8 of the 41 countries was average coverage higher than the proportion of women reporting 4 or more visits (Table 2). (This is reflected in the generally large quality–coverage gaps for individual interventions.) Four of the 10 highest-performing countries, with respect to average coverage across the specific elements of care, also had ANC 4+ values greater than 85% (Dominican Republic, Maldives, Colombia, and Peru) (Table 2). On the other hand, 2 of these 10 countries had comparatively low ANC 4+ values: Rwanda (36%) and Nepal (53%). Very low average coverage was generally associated with low ANC 4+. However, there were several cases of relatively low coverage on specific antenatal content in countries with relatively high ANC 4+ (for example, Congo Brazzaville, with average coverage of 38% and ANC 4+ of 72%; Indonesia, with average coverage of 52% and ANC 4+ of 81%; and Namibia, with average coverage of 53% and ANC 4+ of 70%). Correlation Between Number of Visits and Care Received Certainly, in general, the more ANC visits one has, the higher the likelihood of receiving specific elements of care. So, not surprisingly, ANC 4+ and mean coverage across the 8 elements of care correlate relatively well (Pearson r2 = 0.56). In other words, 56% of the variance in mean coverage is accounted for by the value of ANC 4+. The number of visits does matter, in the sense that each visit provides an opportunity for provision of needed care. Fewer visits means fewer opportunities. Mean number of visits correlates similarly well (r2 = 0.53), and has the advantage that its use as an indicator would not (inappropriately) signal that any particular number of visits is automatically sufficient. Regardless of degree of association, whether with ANC 4+ or mean number of visits, as is evident in the data presented here, there is no necessary relationship with reliable delivery of the content of care. Receipt of the Full Set of Interventions Among all pregnancies during the 2 years preceding the survey, the proportion of women who reported receiving all 8 services (or fewer, if a particular indicator was not included in the survey) was zero in over one-third of the surveys (15 of 41) (Table 2). In only 4 countries was the proportion 20% or higher (Dominican Republic, Maldives, Colombia, and Nepal). In Honduras and the Philippines, the proportion was 10%; in Rwanda and Haiti, 8%; and in Peru, 7%. In none of the other countries was it above 5%. DISCUSSION As this analysis demonstrates, there are large quality–coverage gaps for most of the antenatal interventions assessed. Such gaps mean ineffective care, and ineffective care means missed opportunities to achieve better outcomes. Focusing on mere contact rather than on the content of care means that we have taken our eye off what really matters. Most ANC services assessed had large quality–coverage gaps, reflecting ineffective care. ANC 1 (any ANC) and ANC visit within the first 4 months of gestation are programmatically useful indicators (although not sufficient, in themselves, as summary measures of program performance); they point to how adequately services are reaching intended beneficiaries. The same cannot be said for ANC 4+. This indicator has been used as an overall proxy for delivery of a package of needed antenatal care. As demonstrated by the analysis here, it serves this role poorly. For most of the elements of care, there were marked quality–coverage gaps. And high ANC 4+ coverage can be completely compatible with a large quality–coverage gap (for example, see Congo Brazzaville, Indonesia, Namibia, and Swaziland, in Table 1). Furthermore, its widespread use as the single benchmark indicator for antenatal care has the very unwelcome effect of directing the attention of clinicians and program managers toward optimizing the number of antenatal visits rather than ensuring delivery of the important substance of that care. This effect is exacerbated when attendance at 4 ANC visits is incentivized under conditional cash transfer programs, or when it serves as part of the basis for performance-based financing schemes. Furthermore, continued use of this indicator reinforces the impression that an abbreviated schedule of antenatal visits is adequate. Recent further analysis 6 of the original WHO research that gave rise to the 4-visit recommendation has demonstrated a 27% higher risk of fetal death among those randomized to the abbreviated schedule. Moreover, with eclampsia/preeclampsia emerging as the leading cause of maternal death in certain countries, there is renewed recognition of the importance of more vigilant routine screening and timely response to worsening preeclampsia, which cannot be accomplished with only 4 visits over the entire pregnancy. Commenting on the secondary analysis of the WHO antenatal care trial, Justus Hofmeyr 7 makes the case that: An increased number of routine visits may detect asymptomatic conditions such as preeclampsia, fetal growth restriction or reduced fetal movements earlier, allowing more timely intervention. The importance of the content and quality of routine antenatal care should not be lost to policy makers when decisions about numbers of visits with the available resources are being made. Recent analysis found higher risk of fetal death with the abbreviated ANC schedule of visits. It is time to drop the use of ANC 4+. It does not reliably tell us how adequate ANC services are, and relying on it encourages program managers and clinicians to focus on mere contact rather than on the content of care. Furthermore, as we have noted, 4 visits are not enough. Alternative Indicators to Measure ANC Program Performance ANC 4+ has been retained, to date, as the key global benchmark indicator for antenatal care not because there are passionate defenders of its validity but because there is a perception that there is no readily available alternative. But there is. In principle, an attractive option would be the proportion of women who report receiving the full set of specific elements of care measured. This can be readily determined from survey data. Kyei and colleagues 8 have done such analysis based on data from the 2007 Zambia DHS, using an overlapping, but not identical, set of ANC-related indicators to those used here.* In their study, “good-quality ANC” was defined as attending at least 4 ANC visits with a skilled provider and receiving at least 8 of the 10 antenatal interventions used in their analysis; “moderate-quality ANC” required 4 visits and 5–7 of the 10 antenatal interventions. In this paper, similar analysis found that in about one-third of the surveys (15 of 41), the proportion of women receiving all 8 services (or fewer, if a particular indicator was not included in the survey) was zero. So the utility of this specific measure is constrained by its lack of discriminating power. A further limitation is that, unlike a simple average across indicators—which can be easily calculated from corresponding indicators already tracked by routine health information systems—a measure of receipt of a full set of services at the level of the individual woman would, for the foreseeable future, only be feasible in periodic population surveys and special studies. So we propose adopting, as a summary measure of antenatal program performance at the population level, the simple average of a set of available indicators for receipt of specific services (such as presented in this paper). For use at the global level, to ensure strict comparability, it may be necessary to restrict this composite indicator to content elements that are common across all countries. This would imply retaining HIV- and malaria-related interventions in the summary measure only for within-country use, in settings where this is warranted by local epidemiology and public health priorities. We propose that the same approach be used for periodic population surveys and for ongoing monitoring using routine health information systems. An alternative indicator to ANC 4+ to measure program performance could be a simple average of receipt of a set of key antenatal services. Certainly, the specific components of an average measure merit further debate and discussion. There may be other interventions tracked by health management information systems and measured by DHS or other periodic surveys that could be included (for example, those in the analysis done by Kyei and colleagues 8 ). Likewise, average total number of ANC visits could be included in the summary average measure. Such an average coverage measure would reflect much better how well the needs of the population are actually being met, with regard to the substance of antenatal care, than does the ANC 4+ indicator. This brings us to an important issue of terminology. Shengelia and colleagues 9 have provided a formal description of “effective coverage,” which comprises individual-level need, utilization, and quality. Bryce and colleagues 10 have criticized this concept as unnecessarily complex and not readily measurable. In the global child health sphere, use of the term “coverage” is relatively unproblematic, as it is normally used to refer to delivery of specific technical interventions. However, in global maternal health discourse, “coverage” commonly refers to mere contact (notably ANC 4+ and skilled birth attendance), and these measures are used as proxies for adequate delivery of needed care to a population. For maternal health, a shift toward use of indicators of overall program performance that take account of the actual substance of care provided is certainly called for. For that purpose, we would endorse use of indicators that track “effective coverage,” as the term is used by Kyei and colleagues 8 —“the proportion of the population who need a service that receive it with sufficient quality [for it] to be effective.” In the case of antenatal care, using a more appropriate summary metric for overall program performance, as proposed here, would help effect a much-needed shift in focus, putting the content back into contact.