There is no author summary for this article yet. Authors can add summaries to their articles on ScienceOpen to make them more accessible to a non-specialist audience.
Abstract
Introduction:
Clinical and Translational Science Award Program (CTSA)-funded institutions were charged
with developing clinical and translational science programs and transforming clinical
research at their institutions. Community engagement (CE) was recognized as a key
component and catalyst of that transformation. CE hub capacities for working with
communities and translating knowledge into practice have been illustrated through
their COVID-19 responses.
Methods:
CE hub leaders met and discussed their CTSA’s early responses regarding the COVID-19
pandemic. The 2-hour discussion was distilled into themes which were sent to the CE
hub leaders with a request for written accounts describing actions taken to engage
local partners, communities, and institutions. The written reports form the basis
for this compendium.
Results:
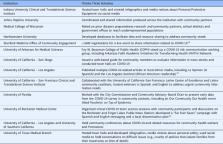
Eighteen institutions submitted written reports describing activities in relation
to six themes: (1) listen to the community and respond to concerns, (2) collect data
to understand the impact of COVID-19 on distinct communities and groups, (3) communicate
science and address misinformation, (4) collaborate with health departments, (5) engage
hubs and underrepresented populations in COVID-19 research, and (6) support our own
well-being and that of others.
Conclusions:
Bidirectional interactions comprise the foundation of CE, which requires trusted partnerships
that sustain communication through a series of activities and goals. The nimble responses
to the pandemic substantiate the need for CE programs to maintain the infrastructure
necessary to achieve the primary CTSA goals of improving health within and across
communities and localities as well as expanding research participation of community
members.
On April 10, 2020, this report was posted online as an MMWR Early Release. Community transmission of coronavirus disease 2019 (COVID-19) was first detected in the United States in February 2020. By mid-March, all 50 states, the District of Columbia (DC), New York City (NYC), and four U.S. territories had reported cases of COVID-19. This report describes the geographic distribution of laboratory-confirmed COVID-19 cases and related deaths reported by each U.S. state, each territory and freely associated state,* DC, and NYC during February 12–April 7, 2020, and estimates cumulative incidence for each jurisdiction. In addition, it projects the jurisdiction-level trajectory of this pandemic by estimating case doubling times on April 7 and changes in cumulative incidence during the most recent 7-day period (March 31–April 7). As of April 7, 2020, a total of 395,926 cases of COVID-19, including 12,757 related deaths, were reported in the United States. Cumulative COVID-19 incidence varied substantially by jurisdiction, ranging from 20.6 cases per 100,000 in Minnesota to 915.3 in NYC. On April 7, national case doubling time was approximately 6.5 days, although this ranged from 5.5 to 8.0 days in the 10 jurisdictions reporting the most cases. Absolute change in cumulative incidence during March 31–April 7 also varied widely, ranging from an increase of 8.3 cases per 100,000 in Minnesota to 418.0 in NYC. Geographic differences in numbers of COVID-19 cases and deaths, cumulative incidence, and changes in incidence likely reflect a combination of jurisdiction-specific epidemiologic and population-level factors, including 1) the timing of COVID-19 introductions; 2) population density; 3) age distribution and prevalence of underlying medical conditions among COVID-19 patients ( 1 – 3 ); 4) the timing and extent of community mitigation measures; 5) diagnostic testing capacity; and 6) public health reporting practices. Monitoring jurisdiction-level numbers of COVID-19 cases, deaths, and changes in incidence is critical for understanding community risk and making decisions about community mitigation, including social distancing, and strategic health care resource allocation. This analysis includes all laboratory-confirmed COVID-19 cases † reported to CDC during February 12–April 7 from health departments in all 50 U.S. states, eight U.S. territories and freely associated states, DC, and NYC. Beginning on March 3, jurisdictions reported aggregate numbers of cases and deaths daily. Cases and deaths reported by the state of New York are exclusive of those reported by NYC. National and jurisdiction-specific case doubling times for the 10 jurisdictions with the most cases were estimated for April 7 by calculating the number of days before April 7 in which the observed cases were equal to half that reported on April 7. National and jurisdiction-specific cumulative incidences were estimated using 2018 population estimates. § Absolute 7-day changes in cumulative incidence were calculated by subtracting the jurisdiction-specific cumulative incidence on March 31 from that observed on April 7. As of April 7, a total of 395,926 COVID-19 cases were reported in the United States (Table). Cases were reported by all 50 states, DC, NYC, Guam, the Northern Mariana Islands, Puerto Rico, and the U.S. Virgin Islands. Two thirds of all COVID-19 cases (66.7%) were reported by eight jurisdictions: NYC (76,876), New York (61,897), New Jersey (44,416), Michigan (18,970), Louisiana (16,284), California (15,865), Massachusetts (15,202), and Pennsylvania (14,559) (Figure 1). The overall cumulative COVID-19 incidence in the United States was 119.6 cases per 100,000 population on April 7 (Table). Among jurisdictions in the continental United States, cumulative incidence was lowest in Minnesota (20.6) and highest in NYC (915.3). Nine reporting jurisdictions had rates above the national rate: NYC (915.3), New York (555.5), New Jersey (498.6), Louisiana (349.4), Massachusetts (220.3), Connecticut (217.8), Michigan (189.8), DC (172.4), and Rhode Island (133.7). TABLE Reported COVID-19 cases and deaths and estimated cumulative incidence,* March 31 and April 7, 2020, and change in cumulative incidence from March 31 to April 7, 2020 — U.S. jurisdictions Jurisdiction March 31 April 7 March 31–April 7 No. of cases Cumulative incidence* No. of cases No. (%) of deaths Cumulative incidence* Absolute change in cumulative incidence* States, District of Columbia, and New York City Alabama 999 20.4 2,197 39 (1.8) 44.9 24.5 Alaska 133 18.0 213 6 (2.8) 28.9 10.8 Arizona 1,289 18.0 2,575 73 (2.8) 35.9 17.9 Arkansas 560 18.6 993 18 (1.8) 32.9 14.4 California 8,131 20.6 15,865 374 (2.4) 40.1 19.6 Colorado 2,966 52.1 5,429 179 (3.3) 95.3 43.2 Connecticut 3,128 87.6 7,781 277 (3.6) 217.8 130.2 Delaware 319 33.0 928 16 (1.7) 95.9 63.0 District of Columbia 495 70.5 1,211 24 (2.0) 172.4 101.9 Florida 6,490 30.5 14,302 296 (2.1) 67.1 36.7 Georgia 4,585 43.6 9,713 351 (3.6) 92.3 48.7 Hawaii 185 13.0 362 5 (1.4) 25.5 12.5 Idaho 525 29.9 1,210 15 (1.2) 69.0 39.0 Illinois 5,994 47.0 13,549 380 (2.8) 106.3 59.3 Indiana 2,159 32.3 5,507 173 (3.1) 82.3 50.0 Iowa 497 15.7 1,048 26 (2.5) 33.2 17.5 Kansas 428 14.7 900 27 (3.0) 30.9 16.2 Kentucky 591 13.2 1,149 65 (5.7) 25.7 12.5 Louisiana 5,237 112.4 16,284 582 (3.6) 349.4 237.1 Maine 303 22.6 519 12 (2.3) 38.8 16.1 Maryland 1,660 27.5 5,529 124 (2.2) 91.5 64.0 Massachusetts 6,620 95.9 15,202 356 (2.3) 220.3 124.3 Michigan 7,615 76.2 18,970 845 (4.5) 189.8 113.6 Minnesota 689 12.3 1,154 39 (3.4) 20.6 8.3 Mississippi 1,073 35.9 2,003 67 (3.3) 67.1 31.1 Missouri 1,327 21.7 3,037 53 (1.7) 49.6 27.9 Montana 203 19.1 332 6 (1.8) 31.3 12.1 Nebraska 177 9.2 478 10 (2.1) 24.8 15.6 Nevada 1,113 36.7 2,087 71 (3.4) 68.8 32.1 New Hampshire 367 27.1 747 13 (1.7) 55.1 28.0 New Jersey 18,696 209.9 44,416 1,232 (2.8) 498.6 288.7 New Mexico 315 15.0 794 13 (1.6) 37.9 22.9 New York† 32,656 293.1 61,897 1,378 (2.2) 555.5 262.4 New York City 41,771 497.3 76,876 4,111 (5.3) 915.3 418.0 North Carolina 1,584 15.3 3,221 46 (1.4) 31.0 15.8 North Dakota 126 16.6 237 4 (1.7) 31.2 14.6 Ohio 2,199 18.8 4,782 167 (3.5) 40.9 22.1 Oklahoma 565 14.3 1,472 67 (4.6) 37.3 23.0 Oregon 690 16.5 1,181 33 (2.8) 28.2 11.7 Pennsylvania 4,843 37.8 14,559 240 (1.6) 113.7 75.9 Rhode Island 520 49.2 1,414 30 (2.1) 133.7 84.6 South Carolina 1,083 21.3 2,417 51 (2.1) 47.5 26.2 South Dakota 108 12.2 320 6 (1.9) 36.3 24.0 Tennessee 2,239 33.1 4,139 72 (1.7) 61.1 28.1 Texas 3,266 11.4 8,262 154 (1.9) 28.8 17.4 Utah 934 29.5 1,804 13 (0.7) 57.1 27.5 Vermont 293 46.8 575 23 (4.0) 91.8 45.0 Virginia 1,484 17.4 3,645 75 (2.1) 42.8 25.4 Washington 4,896 65.0 8,682 394 (4.5) 115.2 50.2 West Virginia 162 9.0 412 4 (1.0) 22.8 13.8 Wisconsin 1,351 23.2 2,578 92 (3.6) 44.3 21.1 Wyoming 120 20.8 221 0 (—) 38.3 17.5 Territories and freely associated states American Samoa 0 0.0 0 0 (—) 0.0 0.0 Federated States of Micronesia 0 0.0 0 0 (—) 0.0 0.0 Guam 71 42.8 122 4 (3.3) 73.6 30.8 Marshall Islands 0 0.0 0 0 (—) 0.0 0.0 Northern Mariana Islands 2 3.5 8 2 (25.0) 14.1 10.5 Palau 0 0.0 0 0 (—) 0.0 0.0 Puerto Rico 239 7.5 573 23 (4.0) 17.9 10.5 U.S. Virgin Islands 30 28.0 45 1 (2.2) 42.1 14.0 U.S. Total 186,101 56.2 395,926 12,757 (3.2) 119.6 63.4 * Cases per 100,000 population. † Excludes New York City. FIGURE 1 Cumulative number of reported COVID-19 cases, by jurisdiction — selected U.S. jurisdictions,* ,† April 7, 2020 Abbreviation: COVID-19 = coronavirus disease 2019 * Restricted to U.S. reporting jurisdictions with ≥5,000 COVID-19 cases reported as of April 7, 2020. † Data from New York are exclusive of New York City. The figure is a bar chart showing the cumulative number of reported COVID-19 cases in selected U.S. jurisdictions, by jurisdiction, as of April 7, 2020. On April 7, nationwide case doubling time was approximately 6.5 days. Among the 10 jurisdictions reporting the most cases, doubling time ranged from 5.5 days in Louisiana to 8.0 days in NYC. During March 31–April 7, the overall cumulative incidence of COVID-19 increased by 63.4 cases per 100,000 (Table). This increase ranged from 8.3 in Minnesota to 418.0 in NYC. During the 7-day period, increases in 11 jurisdictions exceeded the national increase: NYC (418.0), New Jersey (288.7), New York (262.4), Louisiana (237.1), Connecticut (130.2), Massachusetts (124.3), Michigan (113.6), DC (101.9), Rhode Island (84.6), Pennsylvania (75.9), and Maryland (64.0) (Figure 2). FIGURE 2 Cumulative incidence* of COVID-19, by report date — selected U.S. jurisdictions, † , § March 10–April 7, 2020 Abbreviation: COVID-19 = coronavirus disease 2019. * Cases per 100,000 population. † Restricted to the 11 jurisdictions reporting the largest absolute increase in COVID-19 cumulative incidence during the most recent 7-day reporting period, March 31–April 7, 2020. § Data from New York are exclusive of New York City. The figure is a line graph showing the cumulative incidence of COVID-19 for selected U.S. jurisdictions, by report date, during March 10–April 7, 2020. By April 7, 55 (98.2%) of the 56 jurisdictions reporting COVID-19 cases also reported at least one related death (Table); however, approximately half (52.7%) of all deaths (12,757) were reported from three jurisdictions: NYC (4,111), New York (1,378), and New Jersey (1,232) (Figure 3). Other jurisdictions reporting ≥300 deaths included Michigan (845), Louisiana (582), Washington (394), Illinois (380), California (374), Massachusetts (356), and Georgia (351). Case-fatality ratios ranged from 0.7% in Utah to 5.7% in Kentucky. FIGURE 3 Number of reported COVID-19–related deaths, by jurisdiction — selected U.S. jurisdictions,* ,† April 7, 2020 Abbreviation: COVID-19 = coronavirus disease 2019. * Restricted to U.S. reporting jurisdictions with ≥5,000 COVID-19 cases reported as of April 7, 2020. † Data from New York are exclusive of New York City. The figure is a bar chart showing the number of reported COVID-19–related deaths in selected U.S. jurisdictions, by jurisdiction, as of April 7, 2020. Discussion As of April 7, 2020, a total of 395,926 COVID-19 cases, including 12,757 deaths, were reported in the United States. The national cumulative incidence of 119.6 COVID-19 cases per 100,000 obscures significant geographic variation across reporting jurisdictions, with cumulative incidence in the continental U.S. ranging from 20.6 to 915.3 cases per 100,000. Increases in cumulative incidence during the most recent 7-day period (March 31–April 7) also varied widely, from 8.3 to 418.0 cases per 100,000. Geographic variation in numbers of COVID-19 cases and deaths, cumulative incidence, and changes in cumulative incidence likely reflects differences in epidemiologic and population factors as well as clinical and public health practices. Differences in the timing of introduction and early transmission of SARS-CoV-2 (the virus that causes COVID-19) across jurisdictions might explain some of the observed geographic variation. The first documented U.S. cases of COVID-19 were among travelers returning from China and their immediate household contacts ( 4 ). During the third week of February, California, Oregon, and Washington reported the first U.S. cases with no known travel to China or exposure to a person with confirmed COVID-19. Case investigations indicated community transmission in these jurisdictions. Although one case of COVID-19 with an unknown exposure was reported during the fourth week of February in Florida, other cases with unknown exposure (i.e., community transmission) were not widely reported elsewhere until early March. Because COVID-19 is primarily transmitted by respiratory droplets, population density might also play a significant role in the acceleration of transmission. Cumulative incidence in urban areas like NYC and DC exceeds the national average. Louisiana, which experienced a temporarily high population density because of an influx of visitors during Mardi Gras celebrations in mid-February, has a higher cumulative incidence and greater increase in cumulative incidence than other states in the South. Mardi Gras, which concluded on February 25, occurred at a time when cancelling mass gatherings (e.g., festivals, conferences, and sporting events) was not yet common in the United States. ¶ The differential implementation and timing of community mitigation strategies across jurisdictions might have contributed to observed variation in incidence and changing incidences in this analysis. Community mitigation strategies, including school and workplace closures, cancellation of mass gatherings, and shelter-in-place orders, are recommended public health practices to reduce transmission during pandemics ( 5 ). COVID-19 modeling estimates suggest that mitigation could lead to substantial reductions in rates of infection, hospitalization, critical care, and death in North America ( 6 ). The effectiveness of these strategies to mitigate rates of infection and poor outcomes relies on their timely implementation before high levels of community transmission have been observed ( 7 , 8 ). Differences in the availability of and approaches to SARS-CoV-2 testing, including testing patients across the spectrum of illness severity, likely contribute to geographic differences in COVID-19 incidence across jurisdictions. For example, the state of New York (excluding NYC) reported administering 4.9 tests per 1,000 population, which was higher than the national average of 1.6 (CDC, unpublished data, March 25, 2020); this expanded level of testing might have contributed to better ascertainment of cases and might partially explain the state’s higher case count and cumulative incidence. Jurisdictions that expanded public health and commercial laboratory testing later in March might also observe increases in cases and incidence as testing expands. Differences in the numbers of deaths across jurisdictions might reflect the degree to which COVID-19 has been introduced into populations at high risk for severe outcomes (e.g., older adults or those with a high prevalence of underlying medical conditions). In Washington, which reported rapid spread of COVID-19 in several skilled nursing and long-term care facilities ( 2 , 9 ), the high number of deaths observed (394 [4.5%] among 8,682 cases) partially reflects the age and underlying medical conditions of populations affected by the outbreak ( 1 , 3 ). Geographic differences in reported case-fatality ratios might also reflect differences in testing practices; jurisdictions with relatively high proportions of deaths might be those where testing has been more limited and restricted to the most severely ill. The findings in this report are subject to at least three limitations. First, reported COVID-19 cases are likely underestimated because of incomplete detection of cases and delays in case reporting. Reported deaths are also likely underestimated because of incomplete follow-up on all reported COVID-19 cases as well as death among persons infected with SARS-CoV-2 who did not receive a COVID-19 diagnosis. Second, the degree to which cases might go undetected or unreported varies across jurisdictions and might contribute significantly to the geographic variation observed in this analysis. Jurisdiction-level testing practices differ widely, and rapid increases in COVID-19 case detection have placed a high demand on health department infrastructure, leading to differential delays in case reporting. Finally, estimates of incidence, case-fatality ratios, and changes in incidence at the state and territorial levels might not be directly comparable across jurisdictions; further, COVID-19 “hotspots” and the effects of community mitigation efforts occurring within smaller geographic areas might be muted at this higher level of analysis. Approximately 396,000 COVID-19 cases and 12,800 related deaths were reported in the United States as of April 7. The nation’s 60 reporting jurisdictions are experiencing various levels of COVID-19 transmission, resulting in substantial geographic differences in numbers of cases and deaths, incidence, and changes in incidence. Monitoring changes in numbers of reported cases and disease incidence within jurisdictions over time is critical to understanding and responding to the evolving local epidemiology of this outbreak. A clear picture of the magnitude and changing incidence within a jurisdiction will inform decisions regarding implementation of community mitigation strategies, including social distancing, and strategic allocation of human and capital resources, such as those supporting the health care infrastructure. Summary What is already known about this topic? Community transmission of COVID-19 was first detected in the United States in February 2020. By mid-March, all 50 states, the District of Columbia, New York City, and four U.S. territories had reported cases of COVID-19. What is added by this report? As of April 7, cumulative incidence of COVID-19 ranged widely across U.S. jurisdictions (from 20.6 to 915.3 cases per 100,000) and 7-day increases in incidence varied considerably (from 8.3 to 418.0). This report highlights geographic differences in cases, deaths, incidence, and changing incidence. What are the implications for public health practice? Monitoring jurisdiction-level numbers of COVID-19 cases, deaths, and changes in incidence is critical for understanding community risk and making decisions about community mitigation, including social distancing, and strategic health care resource allocation.
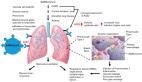
Severe acute respiratory syndrome coronavirus 2 (SARS-CoV-2), a betacoronavirus that causes the novel coronavirus disease 2019 (COVID-19), is highly transmissible and pathogenic for humans and may cause life-threatening disease and mortality, especially in individuals with underlying comorbidities. First identified in an outbreak in Wuhan, China, COVID-19 is affecting more than 185 countries and territories around the world, with more than 15,754,651 confirmed cases and more than 640,029 deaths. Since December 2019, SARS-CoV-2 transmission has become a global threat, which includes confirmed cases in all 50 states within the United States (US). As of 25 July 2020, the Johns Hopkins Whiting School of Engineering Center for Systems Science and Engineering reports more than 4,112,651 cases and 145,546 deaths. To date, health disparities are associated with COVID-19 mortality among underserved populations. Here, the author explores potential underlying reasons for reported disproportionate, increased risks of mortality among African Americans and Hispanics/Latinos with COVID-19 compared with non-Hispanic Whites. The author examines the underlying clinical implications that may predispose minority populations and the adverse clinical outcomes that may contribute to increased risk of mortality. Government and community-based strategies to safeguard minority populations at risk for increased morbidity and mortality are essential. Underserved populations living in poverty with limited access to social services across the US are more likely to have underlying medical conditions and are among the most vulnerable. Societal and cultural barriers for ethnic minorities to achieve health equity are systemic issues that may be addressed only through shifts in governmental policies, producing long-overdue, substantive changes to end health care inequities.
Community engagement (CE) and community-engaged research (CEnR) are increasingly viewed as the keystone to translational medicine and improving the health of the nation. In this article, the authors seek to assist academic health centers (AHCs) in learning how to better engage with their communities and build a CEnR agenda by suggesting five steps: defining community and identifying partners, learning the etiquette of CE, building a sustainable network of CEnR researchers, recognizing that CEnR will require the development of new methodologies, and improving translation and dissemination plans. Health disparities that lead to uneven access to and quality of care as well as high costs will persist without a CEnR agenda that finds answers to both medical and public health questions. One of the biggest barriers toward a national CEnR agenda, however, are the historical structures and processes of an AHC-including the complexities of how institutional review boards operate, accounting practices and indirect funding policies, and tenure and promotion paths. Changing institutional culture starts with the leadership and commitment of top decision makers in an institution. By aligning the motivations and goals of their researchers, clinicians, and community members into a vision of a healthier population, AHC leadership will not just improve their own institutions but also improve the health of the nation-starting with improving the health of their local communities, one community at a time.
Title:
Journal of Clinical and Translational Science
Publisher:
Cambridge University Press
(Cambridge, UK
)
ISSN
(Electronic):
2059-8661
Publication date
(Electronic, collection):
2021
Publication date
(Electronic, pub):
14
June
2021
Volume: 5
Issue: 1
Electronic Location Identifier: e133
Affiliations
[
1
]Department of Family Medicine and Community Health, University of Minnesota, Medical School , Minneapolis, MN, USA
[
2
]
The PACER Group
[
3
]Department of Epidemiology, Colleges of Medicine and Public Health and Health Professions,
University of Florida , Gainesville, FL, USA
Author notes
Address for correspondence: M. M. Eder, PhD, University of Minnesota , Medical School, Department of Family Medicine
and Community Health, 717 Delaware St SE, Minneapolis, MN55414, USA. Email:
meder@
123456umn.edu
This is an Open Access article, distributed under the terms of the Creative Commons
Attribution licence (
http://creativecommons.org/licenses/by/4.0/), which permits unrestricted re-use, distribution, and reproduction in any medium,
provided the original work is properly cited.
History
Date
received
: 12
January
2021
Date
revision received
: 28
May
2021
Date
accepted
: 06
June
2021
Page count
Tables: 6,
References: 30,
Pages: 8
Categories
Subject:
Research Article
Subject:
Implementation, Policy and Community Engagement
scite shows how a scientific paper has been cited by providing the context of the citation, a classification describing whether it supports, mentions, or contrasts the cited claim, and a label indicating in which section the citation was made.