161
views
0
recommends
+1 Recommend
3 collections
    0
    shares
      • Record: found
      • Abstract: found
      • Article: found
      Is Open Access

      Measuring performance on the Healthcare Access and Quality Index for 195 countries and territories and selected subnational locations: a systematic analysis from the Global Burden of Disease Study 2016

      research-article
      GBD 2016 Healthcare Access and Quality Collaborators
      Lancet (London, England)
      Elsevier

      Read this article at

      ScienceOpenPublisherPMC
      Bookmark
          There is no author summary for this article yet. Authors can add summaries to their articles on ScienceOpen to make them more accessible to a non-specialist audience.

          Summary

          Background

          A key component of achieving universal health coverage is ensuring that all populations have access to quality health care. Examining where gains have occurred or progress has faltered across and within countries is crucial to guiding decisions and strategies for future improvement. We used the Global Burden of Diseases, Injuries, and Risk Factors Study 2016 (GBD 2016) to assess personal health-care access and quality with the Healthcare Access and Quality (HAQ) Index for 195 countries and territories, as well as subnational locations in seven countries, from 1990 to 2016.

          Methods

          Drawing from established methods and updated estimates from GBD 2016, we used 32 causes from which death should not occur in the presence of effective care to approximate personal health-care access and quality by location and over time. To better isolate potential effects of personal health-care access and quality from underlying risk factor patterns, we risk-standardised cause-specific deaths due to non-cancers by location-year, replacing the local joint exposure of environmental and behavioural risks with the global level of exposure. Supported by the expansion of cancer registry data in GBD 2016, we used mortality-to-incidence ratios for cancers instead of risk-standardised death rates to provide a stronger signal of the effects of personal health care and access on cancer survival. We transformed each cause to a scale of 0–100, with 0 as the first percentile (worst) observed between 1990 and 2016, and 100 as the 99th percentile (best); we set these thresholds at the country level, and then applied them to subnational locations. We applied a principal components analysis to construct the HAQ Index using all scaled cause values, providing an overall score of 0–100 of personal health-care access and quality by location over time. We then compared HAQ Index levels and trends by quintiles on the Socio-demographic Index (SDI), a summary measure of overall development. As derived from the broader GBD study and other data sources, we examined relationships between national HAQ Index scores and potential correlates of performance, such as total health spending per capita.

          Findings

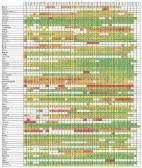
          In 2016, HAQ Index performance spanned from a high of 97·1 (95% UI 95·8–98·1) in Iceland, followed by 96·6 (94·9–97·9) in Norway and 96·1 (94·5–97·3) in the Netherlands, to values as low as 18·6 (13·1–24·4) in the Central African Republic, 19·0 (14·3–23·7) in Somalia, and 23·4 (20·2–26·8) in Guinea-Bissau. The pace of progress achieved between 1990 and 2016 varied, with markedly faster improvements occurring between 2000 and 2016 for many countries in sub-Saharan Africa and southeast Asia, whereas several countries in Latin America and elsewhere saw progress stagnate after experiencing considerable advances in the HAQ Index between 1990 and 2000. Striking subnational disparities emerged in personal health-care access and quality, with China and India having particularly large gaps between locations with the highest and lowest scores in 2016. In China, performance ranged from 91·5 (89·1–93·6) in Beijing to 48·0 (43·4–53·2) in Tibet (a 43·5-point difference), while India saw a 30·8-point disparity, from 64·8 (59·6–68·8) in Goa to 34·0 (30·3–38·1) in Assam. Japan recorded the smallest range in subnational HAQ performance in 2016 (a 4·8-point difference), whereas differences between subnational locations with the highest and lowest HAQ Index values were more than two times as high for the USA and three times as high for England. State-level gaps in the HAQ Index in Mexico somewhat narrowed from 1990 to 2016 (from a 20·9-point to 17·0-point difference), whereas in Brazil, disparities slightly increased across states during this time (a 17·2-point to 20·4-point difference). Performance on the HAQ Index showed strong linkages to overall development, with high and high-middle SDI countries generally having higher scores and faster gains for non-communicable diseases. Nonetheless, countries across the development spectrum saw substantial gains in some key health service areas from 2000 to 2016, most notably vaccine-preventable diseases. Overall, national performance on the HAQ Index was positively associated with higher levels of total health spending per capita, as well as health systems inputs, but these relationships were quite heterogeneous, particularly among low-to-middle SDI countries.

          Interpretation

          GBD 2016 provides a more detailed understanding of past success and current challenges in improving personal health-care access and quality worldwide. Despite substantial gains since 2000, many low-SDI and middle-SDI countries face considerable challenges unless heightened policy action and investments focus on advancing access to and quality of health care across key health services, especially non-communicable diseases. Stagnating or minimal improvements experienced by several low-middle to high-middle SDI countries could reflect the complexities of re-orienting both primary and secondary health-care services beyond the more limited foci of the Millennium Development Goals. Alongside initiatives to strengthen public health programmes, the pursuit of universal health coverage hinges upon improving both access and quality worldwide, and thus requires adopting a more comprehensive view—and subsequent provision—of quality health care for all populations.

          Funding

          Bill & Melinda Gates Foundation.

          Related collections

          Most cited references54

          • Record: found
          • Abstract: found
          • Article: found
          Is Open Access

          Global, regional, and national incidence, prevalence, and years lived with disability for 328 diseases and injuries for 195 countries, 1990–2016: a systematic analysis for the Global Burden of Disease Study 2016

          Summary Background As mortality rates decline, life expectancy increases, and populations age, non-fatal outcomes of diseases and injuries are becoming a larger component of the global burden of disease. The Global Burden of Diseases, Injuries, and Risk Factors Study 2016 (GBD 2016) provides a comprehensive assessment of prevalence, incidence, and years lived with disability (YLDs) for 328 causes in 195 countries and territories from 1990 to 2016. Methods We estimated prevalence and incidence for 328 diseases and injuries and 2982 sequelae, their non-fatal consequences. We used DisMod-MR 2.1, a Bayesian meta-regression tool, as the main method of estimation, ensuring consistency between incidence, prevalence, remission, and cause of death rates for each condition. For some causes, we used alternative modelling strategies if incidence or prevalence needed to be derived from other data. YLDs were estimated as the product of prevalence and a disability weight for all mutually exclusive sequelae, corrected for comorbidity and aggregated to cause level. We updated the Socio-demographic Index (SDI), a summary indicator of income per capita, years of schooling, and total fertility rate. GBD 2016 complies with the Guidelines for Accurate and Transparent Health Estimates Reporting (GATHER). Findings Globally, low back pain, migraine, age-related and other hearing loss, iron-deficiency anaemia, and major depressive disorder were the five leading causes of YLDs in 2016, contributing 57·6 million (95% uncertainty interval [UI] 40·8–75·9 million [7·2%, 6·0–8·3]), 45·1 million (29·0–62·8 million [5·6%, 4·0–7·2]), 36·3 million (25·3–50·9 million [4·5%, 3·8–5·3]), 34·7 million (23·0–49·6 million [4·3%, 3·5–5·2]), and 34·1 million (23·5–46·0 million [4·2%, 3·2–5·3]) of total YLDs, respectively. Age-standardised rates of YLDs for all causes combined decreased between 1990 and 2016 by 2·7% (95% UI 2·3–3·1). Despite mostly stagnant age-standardised rates, the absolute number of YLDs from non-communicable diseases has been growing rapidly across all SDI quintiles, partly because of population growth, but also the ageing of populations. The largest absolute increases in total numbers of YLDs globally were between the ages of 40 and 69 years. Age-standardised YLD rates for all conditions combined were 10·4% (95% UI 9·0–11·8) higher in women than in men. Iron-deficiency anaemia, migraine, Alzheimer’s disease and other dementias, major depressive disorder, anxiety, and all musculoskeletal disorders apart from gout were the main conditions contributing to higher YLD rates in women. Men had higher age-standardised rates of substance use disorders, diabetes, cardiovascular diseases, cancers, and all injuries apart from sexual violence. Globally, we noted much less geographical variation in disability than has been documented for premature mortality. In 2016, there was a less than two times difference in age-standardised YLD rates for all causes between the location with the lowest rate (China, 9201 YLDs per 100 000, 95% UI 6862–11943) and highest rate (Yemen, 14 774 YLDs per 100 000, 11 018–19 228). Interpretation The decrease in death rates since 1990 for most causes has not been matched by a similar decline in age-standardised YLD rates. For many large causes, YLD rates have either been stagnant or have increased for some causes, such as diabetes. As populations are ageing, and the prevalence of disabling disease generally increases steeply with age, health systems will face increasing demand for services that are generally costlier than the interventions that have led to declines in mortality in childhood or for the major causes of mortality in adults. Up-to-date information about the trends of disease and how this varies between countries is essential to plan for an adequate health-system response.
            Bookmark
            • Record: found
            • Abstract: found
            • Article: found
            Is Open Access

            Global, regional, and national life expectancy, all-cause mortality, and cause-specific mortality for 249 causes of death, 1980–2015: a systematic analysis for the Global Burden of Disease Study 2015

            Summary Background Improving survival and extending the longevity of life for all populations requires timely, robust evidence on local mortality levels and trends. The Global Burden of Disease 2015 Study (GBD 2015) provides a comprehensive assessment of all-cause and cause-specific mortality for 249 causes in 195 countries and territories from 1980 to 2015. These results informed an in-depth investigation of observed and expected mortality patterns based on sociodemographic measures. Methods We estimated all-cause mortality by age, sex, geography, and year using an improved analytical approach originally developed for GBD 2013 and GBD 2010. Improvements included refinements to the estimation of child and adult mortality and corresponding uncertainty, parameter selection for under-5 mortality synthesis by spatiotemporal Gaussian process regression, and sibling history data processing. We also expanded the database of vital registration, survey, and census data to 14 294 geography–year datapoints. For GBD 2015, eight causes, including Ebola virus disease, were added to the previous GBD cause list for mortality. We used six modelling approaches to assess cause-specific mortality, with the Cause of Death Ensemble Model (CODEm) generating estimates for most causes. We used a series of novel analyses to systematically quantify the drivers of trends in mortality across geographies. First, we assessed observed and expected levels and trends of cause-specific mortality as they relate to the Socio-demographic Index (SDI), a summary indicator derived from measures of income per capita, educational attainment, and fertility. Second, we examined factors affecting total mortality patterns through a series of counterfactual scenarios, testing the magnitude by which population growth, population age structures, and epidemiological changes contributed to shifts in mortality. Finally, we attributed changes in life expectancy to changes in cause of death. We documented each step of the GBD 2015 estimation processes, as well as data sources, in accordance with Guidelines for Accurate and Transparent Health Estimates Reporting (GATHER). Findings Globally, life expectancy from birth increased from 61·7 years (95% uncertainty interval 61·4–61·9) in 1980 to 71·8 years (71·5–72·2) in 2015. Several countries in sub-Saharan Africa had very large gains in life expectancy from 2005 to 2015, rebounding from an era of exceedingly high loss of life due to HIV/AIDS. At the same time, many geographies saw life expectancy stagnate or decline, particularly for men and in countries with rising mortality from war or interpersonal violence. From 2005 to 2015, male life expectancy in Syria dropped by 11·3 years (3·7–17·4), to 62·6 years (56·5–70·2). Total deaths increased by 4·1% (2·6–5·6) from 2005 to 2015, rising to 55·8 million (54·9 million to 56·6 million) in 2015, but age-standardised death rates fell by 17·0% (15·8–18·1) during this time, underscoring changes in population growth and shifts in global age structures. The result was similar for non-communicable diseases (NCDs), with total deaths from these causes increasing by 14·1% (12·6–16·0) to 39·8 million (39·2 million to 40·5 million) in 2015, whereas age-standardised rates decreased by 13·1% (11·9–14·3). Globally, this mortality pattern emerged for several NCDs, including several types of cancer, ischaemic heart disease, cirrhosis, and Alzheimer's disease and other dementias. By contrast, both total deaths and age-standardised death rates due to communicable, maternal, neonatal, and nutritional conditions significantly declined from 2005 to 2015, gains largely attributable to decreases in mortality rates due to HIV/AIDS (42·1%, 39·1–44·6), malaria (43·1%, 34·7–51·8), neonatal preterm birth complications (29·8%, 24·8–34·9), and maternal disorders (29·1%, 19·3–37·1). Progress was slower for several causes, such as lower respiratory infections and nutritional deficiencies, whereas deaths increased for others, including dengue and drug use disorders. Age-standardised death rates due to injuries significantly declined from 2005 to 2015, yet interpersonal violence and war claimed increasingly more lives in some regions, particularly in the Middle East. In 2015, rotaviral enteritis (rotavirus) was the leading cause of under-5 deaths due to diarrhoea (146 000 deaths, 118 000–183 000) and pneumococcal pneumonia was the leading cause of under-5 deaths due to lower respiratory infections (393 000 deaths, 228 000–532 000), although pathogen-specific mortality varied by region. Globally, the effects of population growth, ageing, and changes in age-standardised death rates substantially differed by cause. Our analyses on the expected associations between cause-specific mortality and SDI show the regular shifts in cause of death composition and population age structure with rising SDI. Country patterns of premature mortality (measured as years of life lost [YLLs]) and how they differ from the level expected on the basis of SDI alone revealed distinct but highly heterogeneous patterns by region and country or territory. Ischaemic heart disease, stroke, and diabetes were among the leading causes of YLLs in most regions, but in many cases, intraregional results sharply diverged for ratios of observed and expected YLLs based on SDI. Communicable, maternal, neonatal, and nutritional diseases caused the most YLLs throughout sub-Saharan Africa, with observed YLLs far exceeding expected YLLs for countries in which malaria or HIV/AIDS remained the leading causes of early death. Interpretation At the global scale, age-specific mortality has steadily improved over the past 35 years; this pattern of general progress continued in the past decade. Progress has been faster in most countries than expected on the basis of development measured by the SDI. Against this background of progress, some countries have seen falls in life expectancy, and age-standardised death rates for some causes are increasing. Despite progress in reducing age-standardised death rates, population growth and ageing mean that the number of deaths from most non-communicable causes are increasing in most countries, putting increased demands on health systems. Funding Bill & Melinda Gates Foundation.
              Bookmark
              • Record: found
              • Abstract: found
              • Article: found
              Is Open Access

              Global, regional, and national age-sex specific mortality for 264 causes of death, 1980–2016: a systematic analysis for the Global Burden of Disease Study 2016

              Summary Background Monitoring levels and trends in premature mortality is crucial to understanding how societies can address prominent sources of early death. The Global Burden of Disease 2016 Study (GBD 2016) provides a comprehensive assessment of cause-specific mortality for 264 causes in 195 locations from 1980 to 2016. This assessment includes evaluation of the expected epidemiological transition with changes in development and where local patterns deviate from these trends. Methods We estimated cause-specific deaths and years of life lost (YLLs) by age, sex, geography, and year. YLLs were calculated from the sum of each death multiplied by the standard life expectancy at each age. We used the GBD cause of death database composed of: vital registration (VR) data corrected for under-registration and garbage coding; national and subnational verbal autopsy (VA) studies corrected for garbage coding; and other sources including surveys and surveillance systems for specific causes such as maternal mortality. To facilitate assessment of quality, we reported on the fraction of deaths assigned to GBD Level 1 or Level 2 causes that cannot be underlying causes of death (major garbage codes) by location and year. Based on completeness, garbage coding, cause list detail, and time periods covered, we provided an overall data quality rating for each location with scores ranging from 0 stars (worst) to 5 stars (best). We used robust statistical methods including the Cause of Death Ensemble model (CODEm) to generate estimates for each location, year, age, and sex. We assessed observed and expected levels and trends of cause-specific deaths in relation to the Socio-demographic Index (SDI), a summary indicator derived from measures of average income per capita, educational attainment, and total fertility, with locations grouped into quintiles by SDI. Relative to GBD 2015, we expanded the GBD cause hierarchy by 18 causes of death for GBD 2016. Findings The quality of available data varied by location. Data quality in 25 countries rated in the highest category (5 stars), while 48, 30, 21, and 44 countries were rated at each of the succeeding data quality levels. Vital registration or verbal autopsy data were not available in 27 countries, resulting in the assignment of a zero value for data quality. Deaths from non-communicable diseases (NCDs) represented 72·3% (95% uncertainty interval [UI] 71·2–73·2) of deaths in 2016 with 19·3% (18·5–20·4) of deaths in that year occurring from communicable, maternal, neonatal, and nutritional (CMNN) diseases and a further 8·43% (8·00–8·67) from injuries. Although age-standardised rates of death from NCDs decreased globally between 2006 and 2016, total numbers of these deaths increased; both numbers and age-standardised rates of death from CMNN causes decreased in the decade 2006–16—age-standardised rates of deaths from injuries decreased but total numbers varied little. In 2016, the three leading global causes of death in children under-5 were lower respiratory infections, neonatal preterm birth complications, and neonatal encephalopathy due to birth asphyxia and trauma, combined resulting in 1·80 million deaths (95% UI 1·59 million to 1·89 million). Between 1990 and 2016, a profound shift toward deaths at older ages occurred with a 178% (95% UI 176–181) increase in deaths in ages 90–94 years and a 210% (208–212) increase in deaths older than age 95 years. The ten leading causes by rates of age-standardised YLL significantly decreased from 2006 to 2016 (median annualised rate of change was a decrease of 2·89%); the median annualised rate of change for all other causes was lower (a decrease of 1·59%) during the same interval. Globally, the five leading causes of total YLLs in 2016 were cardiovascular diseases; diarrhoea, lower respiratory infections, and other common infectious diseases; neoplasms; neonatal disorders; and HIV/AIDS and tuberculosis. At a finer level of disaggregation within cause groupings, the ten leading causes of total YLLs in 2016 were ischaemic heart disease, cerebrovascular disease, lower respiratory infections, diarrhoeal diseases, road injuries, malaria, neonatal preterm birth complications, HIV/AIDS, chronic obstructive pulmonary disease, and neonatal encephalopathy due to birth asphyxia and trauma. Ischaemic heart disease was the leading cause of total YLLs in 113 countries for men and 97 countries for women. Comparisons of observed levels of YLLs by countries, relative to the level of YLLs expected on the basis of SDI alone, highlighted distinct regional patterns including the greater than expected level of YLLs from malaria and from HIV/AIDS across sub-Saharan Africa; diabetes mellitus, especially in Oceania; interpersonal violence, notably within Latin America and the Caribbean; and cardiomyopathy and myocarditis, particularly in eastern and central Europe. The level of YLLs from ischaemic heart disease was less than expected in 117 of 195 locations. Other leading causes of YLLs for which YLLs were notably lower than expected included neonatal preterm birth complications in many locations in both south Asia and southeast Asia, and cerebrovascular disease in western Europe. Interpretation The past 37 years have featured declining rates of communicable, maternal, neonatal, and nutritional diseases across all quintiles of SDI, with faster than expected gains for many locations relative to their SDI. A global shift towards deaths at older ages suggests success in reducing many causes of early death. YLLs have increased globally for causes such as diabetes mellitus or some neoplasms, and in some locations for causes such as drug use disorders, and conflict and terrorism. Increasing levels of YLLs might reflect outcomes from conditions that required high levels of care but for which effective treatments remain elusive, potentially increasing costs to health systems. Funding Bill & Melinda Gates Foundation.
                Bookmark

                Author and article information

                Journal
                Lancet
                Lancet
                Lancet (London, England)
                Elsevier
                0140-6736
                1474-547X
                02 June 2018
                02 June 2018
                : 391
                : 10136
                : 2236-2271
                Author notes
                [†]

                Collaborators listed at end of the Article

                Article
                S0140-6736(18)30994-2
                10.1016/S0140-6736(18)30994-2
                5986687
                29893224
                e3fce39c-a113-47b5-9320-40fc340a6b8c
                © 2018 The Author(s). Published by Elsevier Ltd. This is an Open Access article under the CC BY 4.0 license

                This is an open access article under the CC BY license (http://creativecommons.org/licenses/by/4.0/).

                History
                Categories
                Article

                Medicine
                Medicine

                Comments

                Comment on this article