- Record: found
- Abstract: found
- Article: found
Comparison of the Complexity of Patients Seen by Different Medical Subspecialists in a Universal Health Care System
Read this article at
Key Points
Findings
In this population-based cohort study of 2.5 million Canadian adults, there were substantial differences in markers of complexity for patients seen by different types of physicians, including medical subspecialists. Patients seen by nephrologists, infectious disease specialists, and neurologists were consistently more complex, whereas patients seen by allergists, dermatologists, and family physicians consistently tended to be less complex.
Meaning
Substantial between-specialty differences were found in 9 different markers of patient complexity. The relative rank of the different specialties studied is less important than the finding that there are wide variations in complexity between specialties, which has implications for medical education and health policy.
Abstract
This cohort study compares 9 markers of patient complexity among patients treated by physicians in different specialties in Alberta, Canada, using data collected by the province’s universal health care system.
Abstract
Importance
Clinical experience suggests that there are substantial differences in patient complexity across medical specialties, but empirical data are lacking.
Objective
To compare the complexity of patients seen by different types of physician in a universal health care system.
Design, Setting, and Participants
Population-based retrospective cohort study of 2 597 127 residents of the Canadian province of Alberta aged 18 years and older with at least 1 physician visit between April 1, 2014 and March 31, 2015. Data were analyzed in September 2018.
Exposures
Type of physician seeing each patient (family physician, general internist, or 11 types of medical subspecialist) assessed as non–mutually exclusive categories.
Main Outcomes and Measures
Nine markers of patient complexity (number of comorbidities, presence of mental illness, number of types of physicians involved in each patient’s care, number of physicians involved in each patient’s care, number of prescribed medications, number of emergency department visits, rate of death, rate of hospitalization, rate of placement in a long-term care facility).
Results
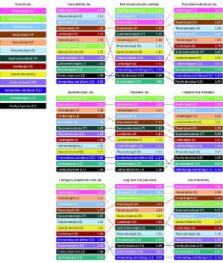
Among the 2 597 127 participants, the median (interquartile range) age was 46 (32-59) years and 54.1% were female. Over 1 year of follow-up, 21 792 patients (0.8%) died, the median (range) number of days spent in the hospital was 0 (0-365), 8.1% of patients had at least 1 hospitalization, and the median (interquartile range) number of prescribed medications was 3 (1-7). When the complexity markers were considered individually, patients seen by nephrologists had the highest mean number of comorbidities (4.2; 95% CI, 4.2-4.3 vs [lowest] 1.1; 95% CI, 1.0-1.1), highest mean number of prescribed medications (14.2; 95% CI, 14.2-14.3 vs [lowest] 4.9; 95% CI, 4.9-4.9), highest rate of death (6.6%; 95% CI, 6.3%-6.9% vs [lowest] 0.1%; 95% CI, <0.1%-0.2%), and highest rate of placement in a long-term care facility (2.0%; 95% CI, 1.8%-2.2% vs [lowest] <0.1%; 95% CI, <0.1%-0.1%). Patients seen by infectious disease specialists had the highest complexity as assessed by the other 5 markers: rate of a mental health condition (29%; 95% CI, 28%-29% vs [lowest] 14%; 95% CI, 14%-14%), mean number of physician types (5.5; 95% CI, 5.5-5.6 vs [lowest] 2.1; 95% CI, 2.1-2.1), mean number of physicians (13.0; 95% CI, 12.9-13.1 vs [lowest] 3.8; 95% CI, 3.8-3.8), mean days in hospital (15.0; 95% CI, 14.9-15.0 vs [lowest] 0.4; 95% CI, 0.4-0.4), and mean emergency department visits (2.6; 95% CI, 2.6-2.6 vs [lowest] 0.5; 95% CI, 0.5-0.5). When types of physician were ranked according to patient complexity across all 9 markers, the order from most to least complex was nephrologist, infectious disease specialist, neurologist, respirologist, hematologist, rheumatologist, gastroenterologist, cardiologist, general internist, endocrinologist, allergist/immunologist, dermatologist, and family physician.
Related collections
Most cited references18
- Record: found
- Abstract: found
- Article: not found
Evaluation and management of chronic kidney disease: synopsis of the kidney disease: improving global outcomes 2012 clinical practice guideline.
- Record: found
- Abstract: found
- Article: not found
Risk of coronary events in people with chronic kidney disease compared with those with diabetes: a population-level cohort study.

- Record: found
- Abstract: found
- Article: found