42
views
0
recommends
+1 Recommend
1 collections
    0
    shares
      • Record: found
      • Abstract: found
      • Article: not found

      Association Between State-Level Income Inequality and COVID-19 Cases and Mortality in the USA

      letter
      , MD, MPH 1 , 2 , , , MD, PhD 1 , 2 , , MD, PhD 3 , , MD, PhD 2 , 4
      Journal of General Internal Medicine
      Springer International Publishing

      Read this article at

      ScienceOpenPublisherPMC
      Bookmark
          There is no author summary for this article yet. Authors can add summaries to their articles on ScienceOpen to make them more accessible to a non-specialist audience.

          Abstract

          INTRODUCTION COVID-19, caused by the novel coronavirus SARS-CoV-2, has resulted in the largest pandemic in 100 years. The USA has been particularly impacted, reporting a third of the cases and a quarter of the deaths worldwide. In recent weeks, the unequal impact of COVID-19 across communities has become glaringly apparent. Data from New York and Chicago indicate that African American and Hispanic people experience disproportionately higher rates of COVID-19 infection and mortality. 1, 2 Inequality may compound these disparities further through economic segregation, decreased social mobility, and lower access to medical care. 3 Given that low-income individuals are more likely to be in essential occupations with a high exposure risk and have less access to healthcare, income inequality may exacerbate the impact of the COVID-19 outbreak. METHODS We examined the association between income inequality and the number of COVID-19 cases and deaths. State income inequality data—as measured by the Gini index—were extracted from the 2018 American Community Survey. The number of cases and deaths was calculated using the COVID-19 Dashboard, a data set hosted by the Center for Systems Science and Engineering at Johns Hopkins University. 4, 5 We limited our analysis to the 50 states from January 22, 2020, through April 13, 2020. First, we performed simple correlation analyses between the state-level Gini index and the number of cases and deaths per 100,000 population due to COVID-19 using the Spearman rank-order correlation test. To account for the right-skewed distribution, we log-transformed the data on the number of COVID-19 cases and deaths. Second, using multivariable regressions, we examined the associations between the state-level Gini index and log-transformed number of cases and deaths due to COVID-19 adjusting for potential confounders. The adjustment variables included the proportion of the population 65+ years, female, African American, Hispanic, and below poverty; median household income; the number of tests performed per capita; doctors per capita (2018–2019 Area Health Resource File); beds per capita (2009–2018 American Hospital Association Annual Survey); and whether a state had a stay-at-home or shelter-in-place policy (no order, order in some parts of the state, statewide order; the New York Times database). 6 This study was exempted from review by the institutional review board of UCLA. RESULTS On April 13, 2020, there were a total of 577,414 cases and 23,424 deaths across 50 states. The number of cases ranged from 28.7 to 1,006.2 cases per 100,000 (median. 73.0; IQR, 47.7–133.6). The mortality rates ranged from 0.17 to 51.7 deaths per 100,000 (median, 2.0; IQR, 1.2–4.5). 
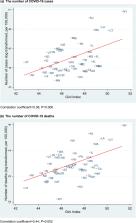
We observed positive correlations between the Gini index and the number of cases (correlation coefficient = 0.38; P = 0.006) and deaths (correlation coefficient = 0.44; P = 0.002) due to COVID-19 (Fig. 1). After adjusting for potential confounders, we found that states with a higher Gini index experienced a larger number of deaths due to COVID-19 (adjusted percent change for one unit increase in Gini index, + 27.2%; 95%CI, + 3.5% to + 56.3%; P = 0.02); the Gini index was marginally associated with the number of COVID-19 cases (+ 13.5%; 95%CI, + 0.0% to + 30.0%; P = 0.07) (Table 1). Figure 1 The unadjusted correlation between the state-level Gini index and the number of COVID-19 cases (a) and deaths (b). Table 1 The Adjusted Association Between the State-Level Gini Index and the Number of COVID-19 Cases and Deaths Change in the number of COVID-19 cases/deaths (95%CI) P value Cases per 100,000 + 13.5% (0.0% to + 30.0%) 0.07 Deaths per 100,000 + 27.2% (+ 3.5% to + 56.3%) 0.02 *Adjusted for the following state-level variables: proportion of the population over 65 years, female, African American, Hispanic, and below poverty; median household income; the number of tests performed per capita; total doctors per capita; total beds per capita; and whether a state had a stay-at-home or shelter-in-place policy on April 1, 2020 DISCUSSION We found that states with higher income inequality experienced a higher number of deaths due to COVID-19. These findings suggest that social factors such as income inequality may explain why some parts of the USA are hit harder by the COVID-19 pandemic than others. Our study has limitations. First, as is the case with observational studies, there is a possibility of residual confounding, including from comorbidities. However, we included the proportion of the population 65+ years which may be a proxy of underlying health risks of the populations. Second, the use of state-level data precluded us from making any inferences about individual-level associations between inequality and COVID-19 infections. Our findings should be informative for policymakers considering additional policies to mitigate the effects of COVID-19 on the most financially vulnerable.

          Related collections

          Most cited references2

          • Record: found
          • Abstract: found
          • Article: not found

          An interactive web-based dashboard to track COVID-19 in real time

          In December, 2019, a local outbreak of pneumonia of initially unknown cause was detected in Wuhan (Hubei, China), and was quickly determined to be caused by a novel coronavirus, 1 namely severe acute respiratory syndrome coronavirus 2 (SARS-CoV-2). The outbreak has since spread to every province of mainland China as well as 27 other countries and regions, with more than 70 000 confirmed cases as of Feb 17, 2020. 2 In response to this ongoing public health emergency, we developed an online interactive dashboard, hosted by the Center for Systems Science and Engineering (CSSE) at Johns Hopkins University, Baltimore, MD, USA, to visualise and track reported cases of coronavirus disease 2019 (COVID-19) in real time. The dashboard, first shared publicly on Jan 22, illustrates the location and number of confirmed COVID-19 cases, deaths, and recoveries for all affected countries. It was developed to provide researchers, public health authorities, and the general public with a user-friendly tool to track the outbreak as it unfolds. All data collected and displayed are made freely available, initially through Google Sheets and now through a GitHub repository, along with the feature layers of the dashboard, which are now included in the Esri Living Atlas. The dashboard reports cases at the province level in China; at the city level in the USA, Australia, and Canada; and at the country level otherwise. During Jan 22–31, all data collection and processing were done manually, and updates were typically done twice a day, morning and night (US Eastern Time). As the outbreak evolved, the manual reporting process became unsustainable; therefore, on Feb 1, we adopted a semi-automated living data stream strategy. Our primary data source is DXY, an online platform run by members of the Chinese medical community, which aggregates local media and government reports to provide cumulative totals of COVID-19 cases in near real time at the province level in China and at the country level otherwise. Every 15 min, the cumulative case counts are updated from DXY for all provinces in China and for other affected countries and regions. For countries and regions outside mainland China (including Hong Kong, Macau, and Taiwan), we found DXY cumulative case counts to frequently lag behind other sources; we therefore manually update these case numbers throughout the day when new cases are identified. To identify new cases, we monitor various Twitter feeds, online news services, and direct communication sent through the dashboard. Before manually updating the dashboard, we confirm the case numbers with regional and local health departments, including the respective centres for disease control and prevention (CDC) of China, Taiwan, and Europe, the Hong Kong Department of Health, the Macau Government, and WHO, as well as city-level and state-level health authorities. For city-level case reports in the USA, Australia, and Canada, which we began reporting on Feb 1, we rely on the US CDC, the government of Canada, the Australian Government Department of Health, and various state or territory health authorities. All manual updates (for countries and regions outside mainland China) are coordinated by a team at Johns Hopkins University. The case data reported on the dashboard aligns with the daily Chinese CDC 3 and WHO situation reports 2 for within and outside of mainland China, respectively (figure ). Furthermore, the dashboard is particularly effective at capturing the timing of the first reported case of COVID-19 in new countries or regions (appendix). With the exception of Australia, Hong Kong, and Italy, the CSSE at Johns Hopkins University has reported newly infected countries ahead of WHO, with Hong Kong and Italy reported within hours of the corresponding WHO situation report. Figure Comparison of COVID-19 case reporting from different sources Daily cumulative case numbers (starting Jan 22, 2020) reported by the Johns Hopkins University Center for Systems Science and Engineering (CSSE), WHO situation reports, and the Chinese Center for Disease Control and Prevention (Chinese CDC) for within (A) and outside (B) mainland China. Given the popularity and impact of the dashboard to date, we plan to continue hosting and managing the tool throughout the entirety of the COVID-19 outbreak and to build out its capabilities to establish a standing tool to monitor and report on future outbreaks. We believe our efforts are crucial to help inform modelling efforts and control measures during the earliest stages of the outbreak.
            Bookmark
            • Record: found
            • Abstract: found
            • Article: not found

            Population health in an era of rising income inequality: USA, 1980-2015.

            Income inequality in the USA has increased over the past four decades. Socioeconomic gaps in survival have also increased. Life expectancy has risen among middle-income and high-income Americans whereas it has stagnated among poor Americans and even declined in some demographic groups. Although the increase in income inequality since 1980 has been driven largely by soaring top incomes, the widening of survival inequalities has occurred lower in the distribution-ie, between the poor and upper-middle class. Growing survival gaps across income percentiles since 2001 reflect falling real incomes among poor Americans as well as an increasingly strong association between low income and poor health. Changes in individual risk factors such as smoking, obesity, and substance abuse play a part but do not fully explain the steeper gradient. Distal factors correlated with rising inequality including unequal access to technological innovations, increased geographical segregation by income, reduced economic mobility, mass incarceration, and increased exposure to the costs of medical care might have reduced access to salutary determinants of health among low-income Americans. Having missed out on decades of income growth and longevity gains, low-income Americans are increasingly left behind. Without interventions to decouple income and health, or to reduce inequalities in income, we might see the emergence of a 21st century health-poverty trap and the further widening and hardening of socioeconomic inequalities in health.
              Bookmark

              Author and article information

              Contributors
              coronce@mednet.ucla.edu
              ytsugawa@mednet.ucla.edu
              Journal
              J Gen Intern Med
              J Gen Intern Med
              Journal of General Internal Medicine
              Springer International Publishing (Cham )
              0884-8734
              1525-1497
              24 June 2020
              : 1-3
              Affiliations
              [1 ]GRID grid.417119.b, ISNI 0000 0001 0384 5381, VA Greater Los Angeles Healthcare System and the National Clinician Scholars Program, ; Los Angeles, CA USA
              [2 ]GRID grid.19006.3e, ISNI 0000 0000 9632 6718, Division of General Internal Medicine and Health Services Research, , David Geffen School of Medicine at UCLA, ; 1100 Glendon Avenue Suite 850, Los Angeles, CA 90024 USA
              [3 ]GRID grid.38142.3c, ISNI 000000041936754X, Department of Social and Behavioral Sciences, , Harvard T.H. Chan School of Public Health, ; Boston, MA USA
              [4 ]GRID grid.19006.3e, ISNI 0000 0000 9632 6718, Department of Health Policy and Management, , UCLA Fielding School of Public Health, ; Los Angeles, CA USA
              Author information
              http://orcid.org/0000-0002-1937-4833
              Article
              5971
              10.1007/s11606-020-05971-3
              7313247
              32583336
              bebb4f1a-73f6-4f4a-84c2-fb501c38f6b2
              © Society of General Internal Medicine 2020

              This article is made available via the PMC Open Access Subset for unrestricted research re-use and secondary analysis in any form or by any means with acknowledgement of the original source. These permissions are granted for the duration of the World Health Organization (WHO) declaration of COVID-19 as a global pandemic.

              History
              : 7 May 2020
              : 5 June 2020
              Categories
              Concise Research Report

              Internal medicine
              Internal medicine

              Comments

              Comment on this article