10
views
0
recommends
+1 Recommend
0 collections
    0
    shares
      • Record: found
      • Abstract: found
      • Article: found
      Is Open Access

      Interactive visual exploration and refinement of cluster assignments

      research-article

      Read this article at

      Bookmark
          There is no author summary for this article yet. Authors can add summaries to their articles on ScienceOpen to make them more accessible to a non-specialist audience.

          Abstract

          Background

          With ever-increasing amounts of data produced in biology research, scientists are in need of efficient data analysis methods. Cluster analysis, combined with visualization of the results, is one such method that can be used to make sense of large data volumes. At the same time, cluster analysis is known to be imperfect and depends on the choice of algorithms, parameters, and distance measures. Most clustering algorithms don’t properly account for ambiguity in the source data, as records are often assigned to discrete clusters, even if an assignment is unclear. While there are metrics and visualization techniques that allow analysts to compare clusterings or to judge cluster quality, there is no comprehensive method that allows analysts to evaluate, compare, and refine cluster assignments based on the source data, derived scores, and contextual data.

          Results

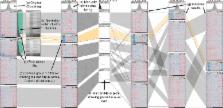
          In this paper, we introduce a method that explicitly visualizes the quality of cluster assignments, allows comparisons of clustering results and enables analysts to manually curate and refine cluster assignments. Our methods are applicable to matrix data clustered with partitional, hierarchical, and fuzzy clustering algorithms. Furthermore, we enable analysts to explore clustering results in context of other data, for example, to observe whether a clustering of genomic data results in a meaningful differentiation in phenotypes.

          Conclusions

          Our methods are integrated into Caleydo StratomeX, a popular, web-based, disease subtype analysis tool. We show in a usage scenario that our approach can reveal ambiguities in cluster assignments and produce improved clusterings that better differentiate genotypes and phenotypes.

          Electronic supplementary material

          The online version of this article (doi:10.1186/s12859-017-1813-7) contains supplementary material, which is available to authorized users.

          Related collections

          Most cited references24

          • Record: found
          • Abstract: not found
          • Article: not found

          FCM: The fuzzy c-means clustering algorithm

            Bookmark
            • Record: found
            • Abstract: found
            • Article: not found

            D³: Data-Driven Documents.

            Data-Driven Documents (D3) is a novel representation-transparent approach to visualization for the web. Rather than hide the underlying scenegraph within a toolkit-specific abstraction, D3 enables direct inspection and manipulation of a native representation: the standard document object model (DOM). With D3, designers selectively bind input data to arbitrary document elements, applying dynamic transforms to both generate and modify content. We show how representational transparency improves expressiveness and better integrates with developer tools than prior approaches, while offering comparable notational efficiency and retaining powerful declarative components. Immediate evaluation of operators further simplifies debugging and allows iterative development. Additionally, we demonstrate how D3 transforms naturally enable animation and interaction with dramatic performance improvements over intermediate representations. © 2010 IEEE
              Bookmark
              • Record: found
              • Abstract: not found
              • Conference Proceedings: not found

              Some methods for classification and analysis of multivariate observations

                Bookmark

                Author and article information

                Contributors
                kernm@in.tum.de
                alex@sci.utah.edu
                nils@hms.harvard.edu
                crj@sci.utah.edu
                Journal
                BMC Bioinformatics
                BMC Bioinformatics
                BMC Bioinformatics
                BioMed Central (London )
                1471-2105
                12 September 2017
                12 September 2017
                2017
                : 18
                : 406
                Affiliations
                [1 ]ISNI 0000 0001 2193 0096, GRID grid.223827.e, Scientific Computing and Imaging Institute, , University of Utah, ; 72 Sout Central Campus Drive, Salt Lake City, 84112 USA
                [2 ]ISNI 0000000123222966, GRID grid.6936.a, Department of Informatics, , Technical University of Munich, ; Garching bei München, 85747 Germany
                [3 ]ISNI 000000041936754X, GRID grid.38142.3c, Department of Biomedical Informatics, , Harvard Medical School, ; Boston, 02115 USA
                Author information
                http://orcid.org/0000-0001-6930-5468
                Article
                1813
                10.1186/s12859-017-1813-7
                5596943
                28899361
                b1ee6930-ad3d-40a9-86aa-153fc3b31d65
                © The Author(s) 2017

                Open Access This article is distributed under the terms of the Creative Commons Attribution 4.0 International License ( http://creativecommons.org/licenses/by/4.0/), which permits unrestricted use, distribution, and reproduction in any medium, provided you give appropriate credit to the original author(s) and the source, provide a link to the Creative Commons license, and indicate if changes were made. The Creative Commons Public Domain Dedication waiver ( http://creativecommons.org/publicdomain/zero/1.0/) applies to the data made available in this article, unless otherwise stated.

                History
                : 7 April 2017
                : 29 August 2017
                Funding
                Funded by: National Institutes of Health (US)
                Award ID: U01 CA198935
                Funded by: National Institutes of Health
                Award ID: P41 GM103545-17
                Funded by: National Institutes of Health
                Award ID: R00 HG007583
                Categories
                Software
                Custom metadata
                © The Author(s) 2017

                Bioinformatics & Computational biology
                cluster analysis,visualization,biology visualization,omics data

                Comments

                Comment on this article