7
views
0
recommends
+1 Recommend
0 collections
    0
    shares
      • Record: found
      • Abstract: found
      • Article: found
      Is Open Access

      D-GENIES: dot plot large genomes in an interactive, efficient and simple way

      research-article
      ,
      PeerJ
      PeerJ Inc.
      Dot plot, Genome assessment, Interactive user interface, Large genomes

      Read this article at

      Bookmark
          There is no author summary for this article yet. Authors can add summaries to their articles on ScienceOpen to make them more accessible to a non-specialist audience.

          Abstract

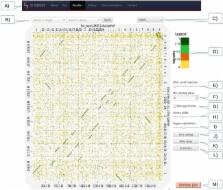
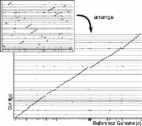
          Dot plots are widely used to quickly compare sequence sets. They provide a synthetic similarity overview, highlighting repetitions, breaks and inversions. Different tools have been developed to easily generated genomic alignment dot plots, but they are often limited in the input sequence size. D-GENIES is a standalone and web application performing large genome alignments using minimap2 software package and generating interactive dot plots. It enables users to sort query sequences along the reference, zoom in the plot and download several image, alignment or sequence files. D-GENIES is an easy-to-install, open-source software package (GPL) developed in Python and JavaScript. The source code is available at https://github.com/genotoul-bioinfo/dgenies and it can be tested at http://dgenies.toulouse.inra.fr/.

          Related collections

          Most cited references5

          • Record: found
          • Abstract: found
          • Article: not found

          D³: Data-Driven Documents.

          Data-Driven Documents (D3) is a novel representation-transparent approach to visualization for the web. Rather than hide the underlying scenegraph within a toolkit-specific abstraction, D3 enables direct inspection and manipulation of a native representation: the standard document object model (DOM). With D3, designers selectively bind input data to arbitrary document elements, applying dynamic transforms to both generate and modify content. We show how representational transparency improves expressiveness and better integrates with developer tools than prior approaches, while offering comparable notational efficiency and retaining powerful declarative components. Immediate evaluation of operators further simplifies debugging and allows iterative development. Additionally, we demonstrate how D3 transforms naturally enable animation and interaction with dramatic performance improvements over intermediate representations. © 2010 IEEE
            Bookmark
            • Record: found
            • Abstract: found
            • Article: not found

            A dot-matrix program with dynamic threshold control suited for genomic DNA and protein sequence analysis.

            Graphical dot-matrix plots can provide the most complete and detailed comparison of two sequences. Presented here is DOTTER2, a dot-plot program for X-windows which can compare DNA or protein sequences, and also DNA versus protein. The main novel feature of DOTTER is that the user can vary the stringency cutoffs interactively, so that the dot-matrix only needs to be calculated once. This is possible thanks to a 'Greyramp tool' that was developed to change the displayed stringency of the matrix by dynamically changing the greyscale rendering of the dots. The Greyramp tool allows the user to interactively change the lower and upper score limit for the greyscale rendering. This allows exploration of the separation between signal and noise, and fine-grained visualisation of different score levels in the dot-matrix. Other useful features are dot-matrix compression, mouse-controlled zooming, sequence alignment display and saving/loading of dot-matrices. Since the matrix only has to be calculated once and since the algorithm is fast and linear in space, DOTTER is practical to use even for sequences as long as cosmids. DOTTER was integrated in the gene-modelling module of the genomic database system ACEDB3. This was done via the homology viewer BLIXEM in a way that also allows segments from the BLAST suite of searching programs to be superimposed on top of the full dot-matrix. This feature can also be used for very quick finding of the strongest matches. As examples, we analyse a Caenorhabditis elegans cosmid with several tandem repeat families, and illustrate how DOTTER can improve gene modelling.
              Bookmark
              • Record: found
              • Abstract: found
              • Article: found
              Is Open Access

              r2cat: synteny plots and comparative assembly

              Summary: Recent parallel pyrosequencing methods and the increasing number of finished genomes encourage the sequencing and investigation of closely related strains. Although the sequencing itself becomes easier and cheaper with each machine generation, the finishing of the genomes remains difficult. Instead of the desired whole genomic sequence, a set of contigs is the result of the assembly. In this applications note, we present the tool r2cat (related reference contig arrangement tool) that helps in the task of comparative assembly and also provides an interactive visualization for synteny inspection. Availability: http://bibiserv.techfak.uni-bielefeld.de/r2cat Contact: peter.husemann@cebitec.uni-bielefeld.de
                Bookmark

                Author and article information

                Contributors
                Journal
                PeerJ
                PeerJ
                PeerJ
                PeerJ
                PeerJ
                PeerJ Inc. (San Francisco, USA )
                2167-8359
                4 June 2018
                2018
                : 6
                : e4958
                Affiliations
                Plate-forme bio-informatique Genotoul, Mathématiques et Informatique Appliquées de Toulouse, INRA , Castanet Tolosan, France
                Author information
                http://orcid.org/0000-0001-7126-5477
                Article
                4958
                10.7717/peerj.4958
                5991294
                29888139
                9152ce03-09d3-4993-b82d-c7a514c5a7c5
                © 2018 Cabanettes and Klopp

                This is an open access article distributed under the terms of the Creative Commons Attribution License, which permits unrestricted use, distribution, reproduction and adaptation in any medium and for any purpose provided that it is properly attributed. For attribution, the original author(s), title, publication source (PeerJ) and either DOI or URL of the article must be cited.

                History
                : 12 March 2018
                : 22 May 2018
                Funding
                Funded by: France Génomique National infrastructure (funded as part of Investissement d’Avenir Program managed by Agence Nationale pour la Recherche, contract ANR-10-INBS-0009)
                This work was supported by the France Génomique National infrastructure (funded as part of Investissement d’Avenir Program managed by Agence Nationale pour la Recherche, contract ANR-10-INBS-0009). The funders had no role in study design, data collection and analysis, decision to publish, or preparation of the manuscript.
                Categories
                Bioinformatics
                Genomics
                Computational Science

                dot plot,genome assessment,interactive user interface,large genomes

                Comments

                Comment on this article