
Introduction
Cardiovascular disease (CVD) is the leading cause of death worldwide, killing 17.9 million people each year [1]. Many randomized clinical trials (RCTs) are conducted to evaluate the efficacy and safety of CVD treatment interventions, as well as primary and secondary prevention of CVDs, including drugs such as statins [2, 3] and polypills [4], dietary interventions (such as the Mediterranean diet and dietary supplements [5–7]), and behaviors [8] or lifestyles (such as weight loss [9]). The importance of RCTs with large sample sizes is well-recognized. Although RCTs generate the most credible and highest-level evidence for assessing the prevention and treatment effects of CVD, their applications are limited by cost, duration, lack of generalizability, ethical concerns, and technical feasibility [10, 11].
Real-world studies (RWSs) have been recognized as an appealing alternative to RCTs in recent years [10, 12]. Real-world data (RWD), collected in routine health care from multiple sources, include electronic health records (EHRs), registry cohorts, health claims, records from home-use settings or mobile devices, etc. [13]. RWSs use RWD to generate various levels of real-world evidence (RWE) [14]. Whereas analysis of confirmatory RCTs relies on traditional statistical methods, interest is growing in the application of machine learning (ML) to address challenges in RWD analysis, such as high-dimensional, complex, and unknown data patterns, and the rapid growth of data volume [15, 16].
ML is a family of methods focusing on classification and prediction [17]. As computational capacity has increased, ML methods have ushered in a new era of medical research analysis (Figure 1). Numerous successful applications of ML methods have been reported in data governance, risk factor identification, and outcome prediction based on RWD. Because they excel in the discovery of potential influencing factors and non-linear relationships, ML methods could increase the efficiency of analysis in RWSs.

The Number of Articles in PubMed Published in 2005–2022 Associated with Cardiovascular Disease and Machine Learning.
A recent retrospective analysis of transversal RWS in more than 11,000 patients above 65 years of age has been performed with principal component analysis (PCA), clustering, synthetic minority oversampling, and logistic regression to diagnose cardiac amyloidosis, a rare disease in which poor diagnostic capability results in treatment delays [18]. Analyses of data with high dimensionality, low prevalence, and missing data in EHRs containing structured and unstructured records have relied on the processing and pipelines of data governance and analysis by ML algorithms to transform the investigation of cardiac amyloidosis to meet patient needs. Among 13,602 patients with heart failure, multiple ML methods, including support vector machine (SVM), artificial neural network (NN), random forest (RF), and extreme gradient boosting models, have been used for prognosis prediction, with a reported area under the receiver operating characteristic curve (AUC) above 0.85, thereby meeting clinical requirements [19]. Thus, RWS and ML are critical tools to fill knowledge gaps and meet medical needs for research on CVDs, which are among the most complex diseases.
This study reviews the ML methods commonly used in CVD studies. Although not exhaustive, this review may serve as a reference for application in RWSs of CVDs. The article is organized as follows. The principles and algorithms of several commonly used ML methods are first introduced. Subsequently, an example analysis of the Systolic Blood Pressure Intervention Trial (SPRINT) data is provided to illustrate the basic procedures of applying ML methods. Finally, the advantages and limitations of ML methods are discussed.
Machine Learning Methods
ML algorithms were first proposed in the 1950s [20]. Currently, owing to a boom in novel learning algorithmics, vastly improved computational power, and enormous and still-increasing RWD [21], data-intensive ML can now mine clinical data in large volumes and/or across large time scales. ML methods can be categorized into supervised and unsupervised learning methods depending on whether the outcome variable is specified (labeled/unlabeled).
Unsupervised Learning
The main task of unsupervised ML is to explore hidden data patterns and to group unlabeled data into sub-populations by clustering and/or dimensionality reduction with feature/variable selection. Because unsupervised learning methods can identify the underlying data structure without a need for human intervention, they are suitable for exploratory analysis [22].
Clustering Analysis
Clustering analysis is not a specific algorithm but a general task to classify objects into two or multiple sub-groups. The first definition of cluster analysis was originally proposed by Driver and Kroeber in 1932 [23]. Clustering analysis aims to find distinct groups or “clusters” of individuals or characters on the basis of the distance among them.
Two types of clustering are primarily used: sample clustering and variable clustering [24]. Variable clustering uses similarity metrics, such as correlation coefficients, to find similar variables. When two variables are found in a cluster, one variable can be considered a “surrogate” for the other. Sample clustering procedures are used to classify individuals into different subgroups according to the distance between individuals.
For clustering algorithms, the definition of the distance is used as the similarity measure of data points or samples. Some commonly used distance measures are displayed in Table 1. We denote x and y as samples with N features/variables. xi and yi are the numerical values of the i th feature. In most cases, data should be normalized before clustering to eliminate the effects of heterogeneity and variation. The Manhattan distance, Euclidean distance, and Chebyshev distance are special cases of Minkowski distances (p=1, 2, and ∞, respectively) [25–28].
Distance Measures.
| Distance | Measurement* |
|---|---|
| Euclidean distance |

|
| Manhattan distance |

|
| Chebyshev distance |

|
| Minkowski distances |

|
* x and y are samples with N variables. xi and yi are the numerical values of the i th variable. p can be a constant or ∞.
Hierarchical clustering [29], the earliest clustering method used by biologists and social scientists [30], aims to create clusters in a hierarchical tree-like structure. The algorithm defines the distance for each pair of data points, selects the closest data pair, groups them, and updates the representation value of the data pair with the mean or median at each step. These steps are then repeated to include all samples in the hierarchical clustering tree.
One of the most commonly used clustering methods is k-means clustering [31]. First, k, the number of clusters, is determined a priori. K cluster centers are selected randomly. Subsequently, each data point is categorized according to its closest center, which is represented by the mean or median of all data points assigned. Finally, repetition of categorization and updating of the center presentation is performed until convergence to k optimal clusters, and each cluster center does not change or change slightly. The k-means++ algorithm optimizes cluster center selection by selecting the first center randomly and taking the distance as the probability for selecting the other k-1 cluster centers [32].
Because CVDs are have multiple causes, the interactions among risk factors are complex. Clustering can be used for combinations of risk factors. As shown in Table 2, Bel-Serrat et al. [33] have investigated the association of lifestyle behaviors with CVD risk factors. Hierarchical and k-means clustering have been performed for measurements, including dietary consumption, physical activity performance, and video viewing in children. Clusters are converted into dummy variables and described characteristics. This research has indicated that lower levels of video viewing and consumption of sugar-sweetened beverages are associated with healthier cardiovascular outcomes than diets rich in fruits and vegetables or physical exercise.
Summary of Machine Learning Algorithm Applications in Cardiovascular Diseases.
| ML Methods | Investigator | Application |
|---|---|---|
| K-means clustering and hierarchical clustering | Bel-Serrat et al. | Association of multiple lifestyle behaviors and CVD risk factors in children [31]. |
| Principal component analysis | Peterson et al. | Establishment of cardiometabolic risk patterns with multiple measurements in children [32]. |
| Random forest | Aryal et al. | Prediction of gut microbiome-based diagnostic screening in CVD [33]. |
| Support vector machine | Kim et al. | Prediction of cardiovascular disease prevalence according to smartwatch measurements [34]. |
| Neural networks | Narula et al. | Discrimination of hypertrophic cardiomyopathy from physiological hypertrophy with expert-annotated speckle-tracking echocardiographic datasets [35]. |
All these methods have advantages and disadvantages, and should be selected according to the properties of the application data. K-means clustering is intuitive, straightforward, and easy to perform. However, the value of k is pre-specified by users and may depend on the visualization. Clustering results are strongly influenced by k, which has no objective optimal value. Modifications have been proposed for the optimal selection of k [31]. Instead of specifying a single value of k, a set of values might be considered in applications. For hierarchical clustering, a noniterative, single-pass greedy algorithm, the measure of distance depends on specific data and should be chosen carefully. Hierarchical clustering has an intuitionistic tree-like structure output but is challenged to find the optimal cluster segmentation, which only depends on professional knowledge.
Dimensionality Reduction
Informally, the “curse of dimensionality” induces decreased computational power, high variance, or overfitting, with an exponential increase in features/variables [34, 35]. Although higher dimensions theoretically include more information, the benefits are countered by noise, redundancy, and sparsity in practice. To avoid the curse of dimensionality, dimensional reduction can be considered for initial exploratory analyses. Common approaches include PCA [36] and singular value decomposition [37]. Herein, we focus primarily on the PCA algorithm.
PCA [36] is one of the most commonly used statistical algorithms to reduce dimensionality. PCA was originally invented by Pearson in 1901 and was further developed by Hotelling into its present form [38]. The purpose of PCA is to decrease dimensionality while minimizing information loss. The aim is accomplished by linear transformation and combining original variables into a new coordinate system.
We denote a feature space with N features (
X
N
, variables). Linear combinations of features with maximum variance are sought, which are presented as  where
a
is a vector of constants
a
=(a
1, …, ap
). The variance of each linear combination can be written as
where
a
is a vector of constants
a
=(a
1, …, ap
). The variance of each linear combination can be written as  with S from a covariance or correlation matrix, and ′ denoting transposition. With common restriction of
a
as a unit vector, the solution of the maximum variance searching could be reduced to maximize the equation
a
′
Sa
–λ(
a
′
a
–1), which, with a derivation process, can be presented as
Sa
–λa
=0.
a
is the eigenvector, λ is the eigenvalue, and linear combination is the corresponding principal component. The first principal component has the greatest variance, followed by the second principal component. This greatest linear combination searching process lasts until principal component N. To reduce dimensions, the first n principal components are selected for subsequent analysis with some information loss. Visualization of cumulative information (percentage of explained variances) with ordered principal components can be used for the selection of n. On the basis of the original and widely used PCA, novel methods for further dimensional reduction have been proposed, such as kernel PCA [39], t-distributed stochastic neighbor embedding [40], and nonmetric multidimensional scaling [34, 41, 42].
with S from a covariance or correlation matrix, and ′ denoting transposition. With common restriction of
a
as a unit vector, the solution of the maximum variance searching could be reduced to maximize the equation
a
′
Sa
–λ(
a
′
a
–1), which, with a derivation process, can be presented as
Sa
–λa
=0.
a
is the eigenvector, λ is the eigenvalue, and linear combination is the corresponding principal component. The first principal component has the greatest variance, followed by the second principal component. This greatest linear combination searching process lasts until principal component N. To reduce dimensions, the first n principal components are selected for subsequent analysis with some information loss. Visualization of cumulative information (percentage of explained variances) with ordered principal components can be used for the selection of n. On the basis of the original and widely used PCA, novel methods for further dimensional reduction have been proposed, such as kernel PCA [39], t-distributed stochastic neighbor embedding [40], and nonmetric multidimensional scaling [34, 41, 42].
PCA is intuitive, easy to apply, and not limited by the number of variables. However, PCA has several drawbacks. The underlying assumption of PCA is that the relationships among variables are linear. In the case of non-linearity, PCA may produce inaccurate results. Additionally, PCA can efficiently reduce the dimensions for related features, but it does not perform well for uncorrelated situations.
Large datasets are increasingly being used in the exploration of CVD. PCA is an optimal choice for dimensionality reduction. Peterson et al. [43] have used PCA to determine a continuous metabolic syndrome score (MetScore) as a cardiometabolic risk pattern involving waist circumference, fasting glucose, systolic blood pressure, triglycerides, and glucose. They have further examined the associations of MetScore with age, body mass index, cardiorespiratory fitness, physical activity, and parental factors. The authors have reported an independent contribution of cardiorespiratory fitness, physical activity, and family-oriented healthful lifestyles in improving the health of 6th graders.
Unsupervised ML is suitable for identifying subgroups of populations with specific patient profiles, which may be used in precision medicine. The more detailed the information, the more accurate the prediction. However, for RWD containing thousands of measures of complex information, the visualization, analysis, and interpretability of data are challenging, owing to the curse of dimensionality. Application of clustering or PCA can provide a partial solution, and some algorithms have been proposed for prediction with high dimensions [44, 45].
Supervised Learning
In contrast to unsupervised algorithms, supervised algorithms predict an outcome class (probability) or value with a pre-specified label. Supervised learning algorithms are trained with input datasets to detect the underlying patterns and relationships with labels (supervisory signal).
Random Forest
RF, proposed by Breiman in 2001 [46], has become a preferable classification and regression algorithm in recent years [44]. RF is essentially a combination of multiple decision trees that performs aggregation of predictions by averaging or voting. The growth steps of trees are as follows: first, for a dataset with M samples and N variables, a dataset with M observations is randomly sampled with replacement (bootstrap sample) from the original training dataset (bagging step). The number of the remaining sample, called the out-of-bag sample, is approximately equal to one-third of M. Subsequently, n, with a default value as the square root of N, is pre-specified for each node. For separation, n variables are randomly selected from N input covariates, and a best split is performed for maximum “purity” with these n features. Purity represents average differences and proportions of continuous and categorical predictive separation variables, respectively, which can be presented by entropy or the Gini index in RFs [47]. This separation step is iterated for each subset until too few samples remain in the final subset. Generally, this iteration yields an oversized tree with overfitting, which is observed as a small bias but a large variance. To overcome this drawback, cross-validation can be used for pruning.
RF is a constitutive supervised method combining multiple decision trees for prediction. Because no pruning is performed for decision trees, each tree is grown to the greatest extent. For the prediction step, classifying a new sample by inputting variables to the forests can yield multiple outcomes. The model chooses the classification with the most votes in the RF as the final prediction for this new sample. Further extensions of the original RF include weighted forests with tree-level weight for more accurate prediction [46, 48], online forests with a streaming input dataset [49], random survival forests incorporating survival endpoints [50], clustering forests in the context of unsupervised classification [51], ranking forests for ranking problems [52], and forests correcting for confounding bias to remove spurious association [53].
Aryal et al. [54] have investigated gut microbiome-based diagnostic screening of CVD by using multiple ML methods. With the top 500 high-variance features of operational bacterial taxonomic units, RF predicted CVD with an AUC of 0.65 [54]. Other successful applications of RF algorithms in the CVD field include CVD prediction with all collected baseline variables and top 20 predictor selection [55]; descriptor identification in coronary CT angiography imaging and fractional flow reserve features for ischemia-associated lesion prediction [56]; and mortality prediction in patients with aortic stenosis, on the basis of cardiovascular magnetic resonance data [57].
RF algorithms have several advantages. First, RF has high accuracy and efficiency. Second, it can accommodate tens of thousands of input variables, far more than the number of observations, without any variable deletion, which is an appealing characteristic for RWSs. Additionally, it can accommodate scenarios with interactions among predictive or prognostic variables. Furthermore, it returns measures of variable importance, thus helping clinicians identify important predictors or prognosis factors. However, even after removal of confounding effects, the variable importance itself does not indicate causality between outcomes and variables, and further mechanistic research is needed. Additionally, standard RF classifiers have excellent performance on balanced data but may perform poorly if classes are extremely unbalanced. For the unbalanced data common in the cardiovascular field, an over-sampled version is often used to fit the model, thus resulting in insufficient variability in the minority class and poor performance in a large range prediction. Weighted RF or AdaBoost should be considered [58, 59].
Support Vector Machine
SVM was initially proposed by Boser, Guyon, and Vapnik in 1992 [60]. Its purpose is to search for an optimal boundary (decision surface/hyperplane) in a multi-dimensional space that completely classifies data points with the largest gap (distance) between borderline features (support vectors).
Taking the two-dimensional data in Figure 2A as an example, both patients with CVD and unaffected individuals have feature data of M and N. The SVM algorithm finds the boundary that completely distinguishes the participants with largest distance between individuals with borderline non-CVD and CVD. However, patients are not always linearly separable in real-world data (Figure 2B). The SVM algorithm maps the data into a space with additional features (high dimensional features), where the separatable decision surface (hyperplane) can be selected (Figure 2C). Kernel functions are used for dimensional mapping:

Illustration of the Support Vector Machine (SVM) Algorithm. The Black Circles and Triangles Indicate Unaffected Individuals and Patients with CVD, Respectively.
A: Normal people and CVD patients are linearly separable. B: Normal people and CVD patients are nonlinearly separable. C: Normal people and CVD patients are mapped into high-dimensional space and separated by a decision surface.
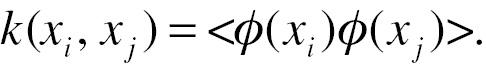
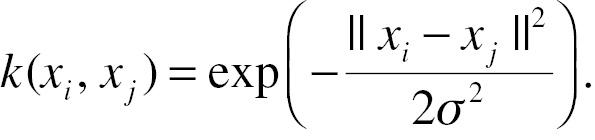
xi is the pre-mapping feature; ϕ is the mapping function; and k is the kernel function. A kernel function calculated in input feature space corresponds to a dot product in some feature space if and only if it is a symmetric positive definite function. The map can be achieved without an explicit map function, but instead, a detailed kernel function, due to that the distance from borderline points to the plane could be transformed and simplified into the dot product of the map function, i.e. kernel function. One commonly used kernel is the gaussian kernel function:
Detailed mathematical principles and proofs can be found elsewhere [45, 61]. Additionally, the SVM algorithm introduces the slack variable δ for the soft margin of the decision surface. The slack variable δ relaxes restrictions to avoid extreme inseparability. Later extensions of the SVM include multi-classes SVM [62, 63], transductive SVM [64], and Bayesian SVM [65, 66].
SVM [45] for classification and support vector regression for continuous data are widely used in computational biomedicines. SVM, as compared with logistic regression and NNs, has been found to have the best performance and highest accuracy in predicting the prevalence of CVD from health-associated data measured from smartwatches from the Korea National Health and Nutrition Examination Survey [67]. Additionally, Petrazzini et al. have applied an ML framework, including PCA, RF, and SVM, using features from EHRs to improve prediction and reclassification for coronary artery disease [68].
Like other ML methods, SVM has benefits and drawbacks. First, it can achieved robust prediction on the basis of computation with many variables and small samples, thus providing an advantage for high-dimensional RWD. Additionally, SVM was designed on the basis of sophisticated mathematical principles that can avoid overfitting. However, an important drawback of SVM is the subjective choice of kernel function, which often depends on multiple attempts. A distance maximization search yields optimal results, with the expense of high computing requirements. Additionally, the hyperplane is determined according to the sample closest to the borderline, which would generate a perfect classification with the largest margin or be affected by overlapping outliers from different classes in an infinite loop.
Neural Networks
The origin of ML algorithms can be traced to artificial NNs reported by McCulloch and Pitts in 1943 [69, 70]. The name and structure of NNs are inspired by biological neurons in the human brain, which transmit signals between neurons. NNs are suitable for modeling complex patterns and prediction problems. NNs contain multiple layers, including an input layer, one or more hidden layers, and an output layer. For example, in Figure 3, x
1 represents input feature variables, a
1 and z
1 are hidden nodes, and  is the output outcome.

Illustration of an Artificial Neural Network Algorithm. x
1 is an Input Feature Variable; w
11, w
12, w
22, and w
2 are Parameters; a
1 and z
1 are Hidden Nodes; and is the Output Outcome.
In this three-layer NN, the potential formulation follows:

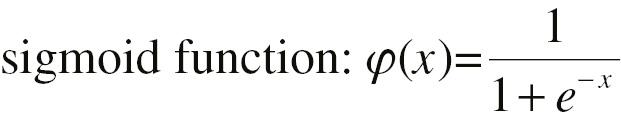
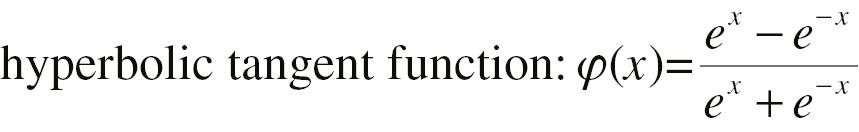
Here, w 12, b 1, w 22, b 2, w 1, w 2, and b 3 are parameters to be estimated. φ(·) is a non-linear step function, which can be a sigmoid function or hyperbolic tangent function with an S shape.
NNs contain two core parts. First, users must decide on the number of layers and nodes in advance, without having an objective or standard answer to this question. These numbers are often determined on the basis of experience. Some researchers believe that this aspect is one of the major drawbacks of NNs. Second, a training dataset with m data points is input into the algorithm to estimate parameters with the cost (or loss) function:

Additionally, a regularization term can be added to the cost function as a penalized part of model simplification. The updated cost function is:
Here, γ is the weight decay parameter. The gradient descent method can be used for parameter estimation. As the foundation of deep learning, later extensions have included feed-forward NNs [71], recurrent NNs [72], modular NNs [73], deep NNs [74], and convolutional NNs (CNNs) [75, 76], with applications as diverse as medicine and multiple domains in daily life.
Recently, derivative algorithms based on NN have been used in cardiac mechanics [77], genetic variants [78], and electrocardiographic diagnosis [79]. Narula et al. [80] have investigated the application of ML methods, SVM, RF, and NNs, to identify physiological and pathological patterns of hypertrophic remodeling. Expert-annotated speckle-tracking echocardiographic datasets have been used to develop a machine-learning-based automated system for the interpretation of echocardiographic images.
NNs, as one of the most important ML algorithms, have advantages and disadvantages. NNs can recognize and learn non-linear and complex relationships for modeling, and many achievements have been made in recognition and prediction. NNs can accommodate non-structural data and output multiple classifications. However, NNs generally require much more data for learning than the other algorithms described above, thus limiting its applications. The “black box” property of NNs includes multiple unexplainable parameters, thus hindering parameter modifications and interpretation. Moreover, the gradient descent method is prone to local minima during model training.
Application of Machine Learning Methods to Real Data
SPRINT data were used to perform analysis with ML algorithms in RWD to demonstrate one application. SPRINT was a randomized, controlled, open-label trial aimed at specifying appropriate targets for systolic blood pressure to decrease cardiovascular morbidity and mortality in people without diabetes. Details of this trial, which included 9361 people with a systolic blood pressure of 130 mmHg or higher, have been described previously [81].
Although SPRINT was designed to be a clinical trial, its long-term follow-up and diverse treatment regimen make it a good example for demonstrating the application of ML methods in RWS analysis. All information collected at baseline was applied to predict composite CVD outcomes, including myocardial infarction, stroke, heart failure, non-MI acute coronary syndrome, or CVD death. On the basis of the updated 2020 SPRINT data, the incidence of composite outcomes was 7.8%, with 726 events. Considering the imbalanced distribution of the outcomes, we randomly sampled 1452 observations from the non-event population, thus resulting in an example with 2178 participants. Baseline information, including demographics, medical history, clinical status, anthropometry, laboratory, and ECG data, was merged with more than 120 variables (Supplementary Table 1). The example was divided into a training and test dataset with 70% and 30% participants, respectively. The supervised methods RF, SVM, and NNs were used. R software (version 4.1.2) was used for analysis (Supplementary Methods).
The RF prediction showed an accuracy of 0.71. The top ten variables and the ROC curve are displayed in Figure 4. SVM and NN prediction was further performed, thus achieving an accuracy of 0.70 and 0.68, respectively. We present this example only as an illustration of how to apply ML methods in CVD research. ML methods focus primarily on data mining with continuous and categorical data. In the field of cardiovascular disease, survival outcomes are common, which can be transformed to categorical data, including mortality and morbidity. Moreover, restricted mean survival time and pseudo-survival methods can be used in outcome calculations for further application of ML methods. Some algorithms can also be extended to survival data, such as random survival forests. In this application, we tested random survival forests for SPRINT data and found AUC values of 0.71 at 4 years and 0.63 at 5 years after treatment. Additionally, both internal and external validation are critical for RWE in CVDs.

Discussion
Herein, we provided a summary of recent ML algorithms, introduced the principles underlying these methods, cited relative applications of CVDs, and demonstrated an application of ML in CVDs. We believe that more ML methods using large databases will be applied to provide RWE in the CVD field, thereby supporting clinical diagnosis, treatment selection, and prognosis prediction. Future research should routinely focus on ensemble learning of ML methods and is expected to be widely applicable in medical domains.
RWE, a growing focus in medical research, comprises information produced from RWSs [14]. Causal inference, particularly causal models, is an important component of RWE [82]. However, although many examples of RWSs have been considered in regulatory decisions, RWSs are themselves a method for generating evidence, including observational studies and pragmatic clinical trials. The generation and application of RWE commonly includes comparison of effectiveness and safety for regulatory decisions, market assessment, health economic evaluation, clinical trial design, and identification of predictive and prognostic factors for disease exploration and improved healthcare delivery. The generation of high-level evidence based on RWSs relies on not only scientific design but also appropriate analysis methods [82]. ML methods are useful and effective tools for the generation of RWE [83]. Supervised methods can be applied for risk prediction and identification of predictive and prognostic factors whereas unsupervised algorithms can be used for dimensional reduction and classification.
Traditional statistical methods apply expert opinions or rules to collected data for analysis. In contrast, ML algorithms learn patterns from data and feed them back to search for potential relationships, which are then further validated by other research with high-level evidence, to ultimately guide clinical decision-making. The difference highlights ML algorithms’ ability to transcend human abilities to solve problems in complex diseases, particularly CVDs, on the basis of ECG and medical images. Traditional imaging diagnosis relies on the professional experience of physicians. However, ML can perform image recognition effectively via CNNs. The use of ML algorithms may help physicians identify potential disease areas, and analyze image data in clinical records. Additionally, RWSs are characterized by high dimensionality, missing and unstructured, which remains unsolved for traditional statistical methods. ML methods may help partially or comprehensively address these issues. Most methods in this review can be applied to high-dimensional data. Regarding missing, imputation with ML algorithms have been reviewed in other articles [84, 85].
In the past 5 years, more than 4000 articles on ML applications in CVDs have been published, according to PubMed (Figure 1), almost all of which have been associated with CVD diagnosis, classification, and prognostication [86]. The introduction of ML into CVD research has facilitated the extraction of features from EHRs, medical images, and laboratory tests [87]. ML methods can be applied to rare or complex diseases to achieve timely treatment and better prognosis, thus filling medical gaps. More than half of the present applications focus on atherosclerosis, heart failure, hypertension, and other cardiac risk factors [86]. Other CVD areas require further research, and acceptance and use of a wider range of ML methods.
In the future, the ability of ML in data preparation and analysis should be optimized for better performance and interpretability. ML has limitations but also opportunities for exploration. First, room for improvement exists regarding the accuracy, robustness, and interpretability of these methods for various applications. Ensemble learning, with sophisticated mathematical theories, has been used to build a unified framework integrating data fusion, modeling, and mining [88]. It combines several models via voting in an adaptive manner to improve machine learning results, and has been found to have better predictive performance than a single model, particularly for imbalanced and noisy data [89]. More ensemble methods are warranted to achieve better performance. Second, most ML methods are “black boxes” with poor interpretability, thus limiting their applications. Classification based on ML without proper interpretation is difficult for clinicians and patients to accept. Additionally, the identification of risk factors and the estimation of treatment effects are important. Furthermore, most ML methods can be applied independently. Future systems should be capable of utilizing multiple ML methods collaboratively and using massive different joint data to explore potential correlation and causality [21].
Future applications should also consider deep learning, which is part of the broader family of ML. Deep learning is based on NNs with multiple layers and presentation learning with higher-level feature extraction [90]. Deep learning methods have dramatically improved accuracy in the digital processing of image, video, speech, and audio data with CNNs and recurrent NNs [91]. These methods, including natural language processing, are expected to greatly advance medicine. For example, multiple algorithms may be used to analyze free text and generate structured presentations for EHRs [92], and to extract features from medical images, including positron emission tomography/CT [93], electroencephalography [94], and electrocardiography [95] images with CNNs [96].
Conclusion
Herein, we provided a review of ML algorithms, including supervised and unsupervised methods. This tutorial may serve as a reference for the application of ML in CVD research. In summary, ML algorithms bring new strengths to mining RWD, but some limitations remain. Future work is warranted in both method development and CVD applications.