7
views
0
recommends
+1 Recommend
0 collections
    0
    shares
      • Record: found
      • Abstract: found
      • Article: found
      Is Open Access

      Whole-genome mapping of quantitative trait loci and accuracy of genomic predictions for resistance to columnaris disease in two rainbow trout breeding populations

      research-article

      Read this article at

      Bookmark
          There is no author summary for this article yet. Authors can add summaries to their articles on ScienceOpen to make them more accessible to a non-specialist audience.

          Abstract

          Background

          Columnaris disease (CD) is an emerging problem for the rainbow trout aquaculture industry in the US. The objectives of this study were to: (1) identify common genomic regions that explain a large proportion of the additive genetic variance for resistance to CD in two rainbow trout ( Oncorhynchus mykiss) populations; and (2) estimate the gains in prediction accuracy when genomic information is used to evaluate the genetic potential of survival to columnaris infection in each population.

          Methods

          Two aquaculture populations were investigated: the National Center for Cool and Cold Water Aquaculture (NCCCWA) odd-year line and the Troutlodge, Inc., May odd-year (TLUM) nucleus breeding population. Fish that survived to 21 days post-immersion challenge were recorded as resistant. Single nucleotide polymorphism (SNP) genotypes were available for 1185 and 1137 fish from NCCCWA and TLUM, respectively. SNP effects and variances were estimated using the weighted single-step genomic best linear unbiased prediction (BLUP) for genome-wide association. Genomic regions that explained more than 1% of the additive genetic variance were considered to be associated with resistance to CD. Predictive ability was calculated in a fivefold cross-validation scheme and using a linear regression method.

          Results

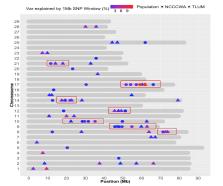
          Validation on adjusted phenotypes provided a prediction accuracy close to zero, due to the binary nature of the trait. Using breeding values computed from the complete data as benchmark improved prediction accuracy of genomic models by about 40% compared to the pedigree-based BLUP. Fourteen windows located on six chromosomes were associated with resistance to CD in the NCCCWA population, of which two windows on chromosome Omy 17 jointly explained more than 10% of the additive genetic variance. Twenty-six windows located on 13 chromosomes were associated with resistance to CD in the TLUM population. Only four associated genomic regions overlapped with quantitative trait loci (QTL) between both populations.

          Conclusions

          Our results suggest that genome-wide selection for resistance to CD in rainbow trout has greater potential than selection for a few target genomic regions that were found to be associated to resistance to CD due to the polygenic architecture of this trait, and because the QTL associated with resistance to CD are not sufficiently informative for selection decisions across populations.

          Electronic supplementary material

          The online version of this article (10.1186/s12711-019-0484-4) contains supplementary material, which is available to authorized users.

          Related collections

          Most cited references27

          • Record: found
          • Abstract: found
          • Article: not found

          Best linear unbiased estimation and prediction under a selection model.

          Mixed linear models are assumed in most animal breeding applications. Convenient methods for computing BLUE of the estimable linear functions of the fixed elements of the model and for computing best linear unbiased predictions of the random elements of the model have been available. Most data available to animal breeders, however, do not meet the usual requirements of random sampling, the problem being that the data arise either from selection experiments or from breeders' herds which are undergoing selection. Consequently, the usual methods are likely to yield biased estimates and predictions. Methods for dealing with such data are presented in this paper.
            Bookmark
            • Record: found
            • Abstract: found
            • Article: not found

            Hot topic: a unified approach to utilize phenotypic, full pedigree, and genomic information for genetic evaluation of Holstein final score.

            The first national single-step, full-information (phenotype, pedigree, and marker genotype) genetic evaluation was developed for final score of US Holsteins. Data included final scores recorded from 1955 to 2009 for 6,232,548 Holsteins cows. BovineSNP50 (Illumina, San Diego, CA) genotypes from the Cooperative Dairy DNA Repository (Beltsville, MD) were available for 6,508 bulls. Three analyses used a repeatability animal model as currently used for the national US evaluation. The first 2 analyses used final scores recorded up to 2004. The first analysis used only a pedigree-based relationship matrix. The second analysis used a relationship matrix based on both pedigree and genomic information (single-step approach). The third analysis used the complete data set and only the pedigree-based relationship matrix. The fourth analysis used predictions from the first analysis (final scores up to 2004 and only a pedigree-based relationship matrix) and prediction using a genomic based matrix to obtain genetic evaluation (multiple-step approach). Different allele frequencies were tested in construction of the genomic relationship matrix. Coefficients of determination between predictions of young bulls from parent average, single-step, and multiple-step approaches and their 2009 daughter deviations were 0.24, 0.37 to 0.41, and 0.40, respectively. The highest coefficient of determination for a single-step approach was observed when using a genomic relationship matrix with assumed allele frequencies of 0.5. Coefficients for regression of 2009 daughter deviations on parent-average, single-step, and multiple-step predictions were 0.76, 0.68 to 0.79, and 0.86, respectively, which indicated some inflation of predictions. The single-step regression coefficient could be increased up to 0.92 by scaling differences between the genomic and pedigree-based relationship matrices with little loss in accuracy of prediction. One complete evaluation took about 2h of computing time and 2.7 gigabytes of memory. Computing times for single-step analyses were slightly longer (2%) than for pedigree-based analysis. A national single-step genetic evaluation with the pedigree relationship matrix augmented with genomic information provided genomic predictions with accuracy and bias comparable to multiple-step procedures and could account for any population or data structure. Advantages of single-step evaluations should increase in the future when animals are pre-selected on genotypes. Copyright 2010 American Dairy Science Association. Published by Elsevier Inc. All rights reserved.
              Bookmark
              • Record: found
              • Abstract: found
              • Article: not found

              The development and characterization of a 57K single nucleotide polymorphism array for rainbow trout.

              In this study, we describe the development and characterization of the first high-density single nucleotide polymorphism (SNP) genotyping array for rainbow trout. The SNP array is publically available from a commercial vendor (Affymetrix). The SNP genotyping quality was high, and validation rate was close to 90%. This is comparable to other farm animals and is much higher than previous smaller scale SNP validation studies in rainbow trout. High quality and integrity of the genotypes are evident from sample reproducibility and from nearly 100% agreement in genotyping results from other methods. The array is very useful for rainbow trout aquaculture populations with more than 40 900 polymorphic markers per population. For wild populations that were confounded by a smaller sample size, the number of polymorphic markers was between 10 577 and 24 330. Comparison between genotypes from individual populations suggests good potential for identifying candidate markers for populations' traceability. Linkage analysis and mapping of the SNPs to the reference genome assembly provide strong evidence for a wide distribution throughout the genome with good representation in all 29 chromosomes. A total of 68% of the genome scaffolds and contigs were anchored through linkage analysis using the SNP array genotypes, including ~20% of the genome assembly that has not been previously anchored to chromosomes. © 2014 John Wiley & Sons Ltd.
                Bookmark

                Author and article information

                Contributors
                rafael.zte@gmail.com
                jason.evenhuis@ars.usda.gov
                roger.vallejo@ars.usda.gov
                guangtu.gao@ars.usda.gov
                kyle.martin@hendrix-genetics.com
                Tim.Leeds@ars.usda.gov
                yniv.palti@ars.usda.gov
                danilino@uga.edu
                Journal
                Genet Sel Evol
                Genet. Sel. Evol
                Genetics, Selection, Evolution : GSE
                BioMed Central (London )
                0999-193X
                1297-9686
                6 August 2019
                6 August 2019
                2019
                : 51
                : 42
                Affiliations
                [1 ]ISNI 0000 0004 0404 0958, GRID grid.463419.d, National Center for Cool and Cold Water Aquaculture, Agricultural Research Service, United States Department of Agriculture, ; 11861 Leetown Road, Leetown, WV 25430 USA
                [2 ]ISNI 0000 0004 1936 738X, GRID grid.213876.9, Department of Animal and Dairy Science, , University of Georgia, Athens, ; 425 River Road, Athens, GA 30602 USA
                [3 ]Present Address: Zoetis, Sao Paulo, Sao Paulo, 04711-130 Brazil
                [4 ]Troutloged, Inc., P.O. Box 1290, Sumner, WA 98390 USA
                Author information
                http://orcid.org/0000-0002-4953-8878
                Article
                484
                10.1186/s12711-019-0484-4
                6683352
                31387519
                7ebe8517-1eb5-480a-9bd6-4b1ff08fed69
                © The Author(s) 2019

                Open AccessThis article is distributed under the terms of the Creative Commons Attribution 4.0 International License ( http://creativecommons.org/licenses/by/4.0/), which permits unrestricted use, distribution, and reproduction in any medium, provided you give appropriate credit to the original author(s) and the source, provide a link to the Creative Commons license, and indicate if changes were made. The Creative Commons Public Domain Dedication waiver ( http://creativecommons.org/publicdomain/zero/1.0/) applies to the data made available in this article, unless otherwise stated.

                History
                : 11 December 2018
                : 30 July 2019
                Funding
                Funded by: FundRef http://dx.doi.org/10.13039/100007917, Agricultural Research Service;
                Award ID: 8082-32000-006
                Award ID: 8082-31000-012
                Award Recipient :
                Funded by: FundRef http://dx.doi.org/10.13039/100006229, Oak Ridge Institute for Science and Education;
                Award ID: DE-AC05-06OR23100
                Award Recipient :
                Categories
                Research Article
                Custom metadata
                © The Author(s) 2019

                Genetics
                Genetics

                Comments

                Comment on this article