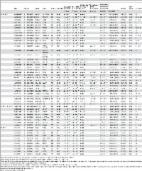
Introduction Body height is determined by several biological processes that occur throughout the life of an individual and involve both normal and pathological growth. Most skeletal bones are formed by endochondral ossification, the process of replacing hyaline cartilage with bony tissue. Ossification starts shortly after gestation at the diaphysis and extends along the end of the long bones. Growth continues throughout childhood via mitotic division of the cartilage at the distal surface of the epiphysis and the epiphyseal plate, accelerates during the adolescence growth spurt and slows down in the early twenties, when the epiphyseal plate completely ossifies and peak body height is achieved. Subsequent decreases in peak body height throughout life are mainly the consequence of vertebral bone deformities such as crush fractures (osteoporosis) and cartilage degeneration (osteoarthritis). Epidemiological studies have revealed marked differences in the growth patterns for the lower and upper portions of the body. Both trunk and lower limb length are associated with parental height, birth weight and weight at age 4 years [1]. Leg length, the principal determinant of final height attainment in adults [2], is positively associated with advantaged socio-economical circumstances and nutritional intake in childhood [1],[3],[4]. Leg length is also largely responsible for the secular increase in height in some populations [5]. Conversely, trunk length is not correlated with nutrient intake in children, and has been shown to be negatively correlated with psychophysical stress [1]. This evidence suggests that independent growth pathways might be in part responsible for final upper and lower body size. Recent, well-powered genome-wide association (GWA) scans have already identified 43 independent loci associated with height, revealing a significant overrepresentation of genes controlling DNA replication, intracellular signalling, cell division and mesoderm and skeletal development [6]–[10]. We have carried out an independent meta-analysis of stature to assess the contribution of genetic loci to overall body height. In addition, we have investigated for the first time the contribution of these height loci to leg and trunk length using derived measurements of skeletal frame size and we have used conditional analyses to explore a possible differential contribution of the height loci to the different skeletal measurements. Results Associations with Height To search for loci influencing adult height we analyzed genome-wide (GW) data for 299,216 SNPs from a combined sample of 12,611 adults of Caucasian origin from the UK (EPIC Norfolk, n = 3,211; TwinsUK, n = 2,224; 1958 Birth Cohort, n = 1,430) and the Netherlands (Rotterdam Study, n = 5,746) genotyped with Human300 and 550 bead arrays (Illumina) (Figure S1). We note that the EPIC Norfolk sample was also included in a recent meta-analysis for height, where the same individuals were genotyped using the 500 K Gene chip (Affymetrix) [9]. Although our discovery set was not entirely independent from the Weedon et al study, inclusion of this collection in the discovery set can provide further support to validate other genomic regions in conjunction with other sample collections. In total, 86 SNPs from 35 genomic regions reached significance with P-values 10−5 rs955748 4 184452669 4q35.1 WWC2 T/C 0.342 6.1×10⁻⁴ 4.3×10⁻⁷ 0.941 6.6×10⁻⁵ −0.067 (0.013) 8.82 (7) 0.27 21 rs3767141 1 22088866 1p36.12 HSPG2 T/C 0.297 1.2×10⁻⁷ 2.5×10⁻⁵ 0.727 3.5×10⁻⁴ 0.038 (0.011) 18.11 (7) 0.01 61 rs7533282 1 57406084 1p32.2 DAB1 A/C 0.1 7.6×10⁻⁴ 7×10⁻⁶ 0.992 3.4×10⁻⁴ −0.068 (0.018) 6.95 (7) 0.43 0 rs7596521 2 46772169 2p21 SOCS5 A/G 0.367 1.1×10⁻⁴ 3.1×10⁻⁶ 0.673 6.9×10⁻⁵ −0.043 (0.012) 8.33 (7) 0.3 16 rs753628 3 196040762 3q29 FAM43A/LSG1 T/C 0.258 2.9×10⁻⁵ 9.6×10⁻⁶ 0.741 8.6×10⁻⁴ 0.035 (0.011) 15.73 (7) 0.03 56 rs2714357 6 7170994 6p24.3 RREB1 A/C 0.375 3.7×10⁻⁵ 4.9×10⁻⁶ 0.775 5.1×10⁻⁴ 0.044 (0.011) 10.59 (7) 0.16 34 rs742106 6 15632459 6p22.3 DTNBP1 A/G 0.112 5.4×10⁻⁶ 4.7×10⁻⁷ 0.524 2.6×10⁻⁴ 0.043 (0.011) 11.00 (7) 0.14 36 rs3131296 6 32280971 6p21.32 NOTCH4 A/G 0.367 7.7×10⁻⁶ 3.8×10⁻⁵ 0.097 1.8×10⁻⁵ 0.063 (0.016) 5.92 (7) 0.55 0 rs1523632 7 17036493 7p21.1 AGR2 T/C 0.3 7.7×10⁻⁶ 1.2×10⁻⁵ 0.541 2.7×10⁻⁵ 0.050 (0.012) 7.88 (6) 0.25 24 rs3125945 X 70175461 Xq13.1 NLGN3 T/C 0.367 6.8×10⁻⁶ 3.9×10⁻⁶ 0.656 1.4×10⁻⁴ 0.033 (0.009) 17.37 (7) 0.02 60 rs1402078 X 92404317 Xq21.32 NAP1L3 T/C 0.478 5.8×10⁻⁵ 5.8×10⁻⁶ 0.488 3.0×10⁻⁴ −0.044 (0.015) 12.56 (7) 0.08 44 1 Only SNPs with an asterisk were genotyped in the CBR collection; the sample size for the remaining SNPs is 4,274. 2 Meta-analysis P-values were calculated from study-specific best analysis P-values weighted by sample size. 3 Betas and SE for the combined sample were calculated using inverse variance meta-analysis for height values normalised to z-scores. For family-based cohorts, such values were calculated in a subset of unrelated individuals (n = 1,381 for TwinsUK discovery and n = 1,403 for TwinsUK replication). 4 1 = Weedon et al. 2007; 2 = Lettre et al. 2008; 3 = Weedon et al. 2008, 4 = Sanna et al. 2008; 5 = Gudbjartsson et al. 2008. The SNPs having the lowest association P-value within in each region in the combined analysis are indicated in bold. For loci also described in the Weedon et al. study we report association P-values excluding the EPIC Norfolk, to account for the sample overlap with that study [9]. Two of the seventeen loci that reached GW-significant association are novel. The SNP rs11809207 is located in the third intron of the CATSPER4 gene (combined P-value = 6.1×10⁻⁸). The A allele at rs11809207 was associated with an increase in height of 0.071 (95% C.I. 0.044–0.098) standard deviations, corresponding to an effect size of 0.46 cm per copy of the allele. Two nearby SNPs are in high LD with rs11809207 and have marginally higher P-values in the meta-analysis (rs2783711 near PDIK1L, P-value = 5.7×10⁻⁵, r2 = 0.61 in the HapMap CEU sample; and rs12069719, P-value = 3.7×10⁻⁵, r2 = 0.6; Figure S2A). The lead SNP of the second locus rs910316 (P-value = 1.4×10⁻⁷) is located in the first intron of TMED10 (Figure S2O). The A allele is associated with an increase in height of 0.053 (95% C.I. 0.031–0.075) standard deviations in the combined sample, corresponding to 0.34 cm per allele copy. Two additional loci, NPR3 and JAZF1, which were previously reported as weakly associated to height (P-values>10−5 [6]) reached GW-significance in our study (rs10472828 in NPR3, P-value = 3×10⁻⁷ and rs849141 in JAZF1, P-value = 3.2×10⁻¹¹, Table 1). The remaining thirteen loci reaching GW-significance (Table 1) had been described in one or more of the recent GWA scans for stature, providing strong evidence for independent and widespread replication [6]–[10]. The Weedon et al (2008) study shared approximately 3,200 samples with our discovery cohort (EPIC cohort). Six of the eight loci discovered in both studies reached GW-significance in our replication set when EPIC was excluded from the analysis (Table 1), indicating independent replication of these loci in the remaining sample collections. The strongest association signals in our combined set were observed at HMGA2 (rs8756, P-value 5×10⁻¹⁴) and UQCC (rs6088813, P-value 9.8×10⁻¹⁴) both of which have been replicated in multiple studies [6]–[10]. The seventeen GW-significant loci explain 0.07%–0.18% of total height variance in our sample (Table 1). Finally, rs1812175 located in HHIP had a nominal P-value in the replication sample but did not reach GW-significance in the combined analysis (Table 1). A further six loci which did not attain nominal significance in the replication sample have suggestive evidence for association with height in the combined sample (Table 1). To assess heterogeneity in the height associations among cohorts, we compared regression coefficients for height normalised to z-scores using the Cochran's and I2 statistics, finding little or no evidence for heterogeneity (Table 1). We used a similar approach to investigate gender-specific effects in height associations. We focused on the Rotterdam study, which is the largest cohort with similar numbers of males and females. We compared normalised height z-scores calculated in 3,374 females and 2,362 males from the Rotterdam Study using Cochran's and I2 statistics (Table S3). We observed limited evidence for gender-specific effects. The exception was ADAMTS33 SNPs, where we detected significant heterogeneity in height associations at all three SNPs investigated (P-value = 0.002, I2 = 89%; Table S3). Associations with Skeletal Size Measurements We tested the association of the 17 GW-significant loci with three different skeletal size measurements, namely spine length, femur and hip axis length, which provide proxies for trunk, leg and skeletal size length respectively. We first investigated skeletal size measurements representing proxies for trunk length. We analysed 6,053 samples from three cohorts with available measurements of spine length (TwinsUK and Chuvasha) and vertebral body heights (Rotterdam Study). We combined study-specific summary statistics using z-scores and found that nine of the 17 loci were significantly associated with trunk length at the nominal level. The strongest associations with spine were at rs6570507 in GPR126 (P-value = 4×10⁻⁵), rs6817306 in LCORL (P-value = 4×10⁻⁴), rs849141 in JAZF1 (P-value = 0.001) and rs10472828 in NPR3 (P-value = 0.0018) (Table 2). 10.1371/journal.pgen.1000445.t002 Table 2 Association of validated height loci with trunk length. SNP Locus A1/A2 All Samples (n = 6,053) Rotterdam Study Univariate Height-adjusted Zscore P-value % variance Beta (SE) P-value Beta (SE) P-value rs11809207 CATSPER4 A/G 1.867 0.062 0.049 0.069 (0.036) 0.054 0.024 (0.036) 0.507 rs6763931 ZBTB38 A/G 2.129 0.033 0.031 0.019 (0.028) 0.49 −0.017 (0.028) 0.540 rs6854334 LCORL T/C 1.648 0.099 0.100 0.118 (0.042) 0.005 0.061 (0.042) 0.142 rs6817306 LCORL T/C 3.54 4×10⁻⁴ 0.165 0.150 (0.042) 3.7×10⁻⁴ 0.094 (0.042) 0.026 rs6830062 LCORL T/C 2.86 0.004 0.212 0.162 (0.040) 5.8×10⁻⁵ 0.091 (0.040) 0.024 rs710841 PRKG2 T/C 1.098 0.272 0.033 0.024 (0.032) 0.453 0.020 (0.032) 0.536 rs2011962 PRKG2 A/C −0.921 0.357 0.013 −0.032 (0.032) 0.312 −0.008 (0.032) 0.794 rs10472828 NPR3 T/C −3.121 0.002 0.117 −0.068 (0.028) 0.016 −0.026 (0.028) 0.366 rs10946808 HIST1H1D A/G 2.657 0.008 0.111 0.007 (0.031) 0.811 −0.064 (0.031) 0.036 rs9358913 HIST1H4F A/G 2.559 0.010 0.089 0.003 (0.031) 0.924 −0.057 (0.031) 0.065 rs13437082 HLA-B T/C −2.138 0.033 0.060 −0.063 (0.032) 0.052 0.011 (0.032) 0.727 rs4711269 HLA-B T/C −2.065 0.039 0.059 −0.064 (0.032) 0.047 0.011 (0.032) 0.735 rs7742369 HMGA1/C6orf106 A/G −1.357 0.175 0.016 −0.039 (0.036) 0.278 −0.009 (0.036) 0.808 rs1776897 HMGA1/C6orf106 T/G −2.807 0.005 0.033 −0.077 (0.048) 0.105 −0.043 (0.048) 0.373 rs2814993 HMGA1/C6orf106 A/G 0.923 0.356 0.013 0.050 (0.040) 0.206 −0.004 (0.040) 0.923 rs12189801 GPR126 T/C 2.841 0.005 0.103 0.082 (0.039) 0.038 0.076 (0.039) 0.052 rs6570507 GPR126 A/G −4.109 4×10⁻⁵ 0.220 −0.089 (0.031) 0.004 −0.058 (0.031) 0.062 rs1182188 GNA12 T/C 1.61 0.107 0.041 0.022 (0.032) 0.487 0.023 (0.032) 0.465 rs1182179 GNA12 A/G 0.502 0.615 0.036 0.021 (0.032) 0.509 0.022 (0.032) 0.486 rs849141 JAZF1 A/G 3.252 0.001 0.097 0.087 (0.030) 0.005 0.021 (0.031) 0.486 rs2282978 CDK6 T/C −1.625 0.104 0.007 −0.014 (0.029) 0.637 0.012 (0.029) 0.694 rs1480474 HMGA2 A/G 1.479 0.139 0.043 0.052 (0.029) 0.070 0.003 (0.029) 0.923 rs8756 HMGA2 A/C −1.484 0.138 0.033 −0.046 (0.028) 0.105 0.015 (0.028) 0.603 rs3118912 DLEU7 T/C −1.505 0.132 0.101 −0.101 (0.035) 0.004 −0.007 (0.035) 0.835 rs3118914 DLEU7 T/G −1.255 0.209 0.104 −0.103 (0.035) 0.003 −0.009 (0.035) 0.789 rs3116607 DLEU7 A/C −2.19 0.029 0.099 −0.104 (0.037) 0.005 −0.0005 (0.037) 0.990 rs3118916 DLEU7 A/G −2.443 0.015 0.073 −0.088 (0.036) 0.014 −0.005 (0.036) 0.892 rs910316 TMED10 A/C −0.028 0.978 0.031 0.030 (0.028) 0.287 −0.009 (0.028) 0.765 rs2401171 ADAMTSL3 T/G 0.251 0.802 0.005 −0.00003 (0.028) 0.999 0.032 (0.028) 0.252 rs7183263 ADAMTSL3 T/G −0.98 0.327 0.010 0.014 (0.028) 0.615 0.050 (0.028) 0.074 rs4842838 ADAMTSL3 T/G 1.248 0.212 0.005 −0.014 (0.028) 0.615 −0.050 (0.028) 0.074 rs4911494 UQCC T/C −1.761 0.078 0.061 −0.048 (0.029) 0.097 −0.021 (0.029) 0.477 rs6088813 UQCC A/C −1.561 0.118 0.055 −0.047 (0.029) 0.106 −0.020 (0.029) 0.494 For each locus, the meta-analysis P-value was calculated for best analysis of all cohorts with available trunk size data, namely length of spine measurements in TwinsUK and Chuvasha and sum of vertebral heights in the Rotterdam Study. Univariate and conditional analyses were carried out on a subset of 2,536 individuals of the Rotterdam Study with available vertebral height and height data. We next tested association of the 17 confirmed height loci with hip axis length (HAL) in 2,341 individuals from the Rotterdam Study (Table 3). HAL is a highly-heritable measure of femoral geometry that measures the distance from the lateral aspect of the greater trochanter to the inner border of the pelvic rim, passing through the mid-section of the femoral neck. HAL is strongly correlated with total frame size and height [11] and represents a clinically important predictor of hip fracture independent of age and femoral neck bone mineral density [12]. Of the 17 validated height loci, seven had one or more SNPs significantly associated with HAL in the Rotterdam Study, with the strongest statistical associations observed at LCORL (rs6830062; P-value = 4.8×10⁻⁴) and UQCC (rs4911494; P-value = 1.9×10⁻⁴). 10.1371/journal.pgen.1000445.t003 Table 3 Association of validated height loci with hip axis length (HAL). SNP Locus A1/A2 Univariate Height-adjusted % variance BETA (SE) P-value BETA (SE) P-value rs11809207 CATSPER4 A/G 0.003 −0.011 (0.038) 0.778 −0.051 (0.037) 0.174 rs6763931 ZBTB38 A/G 0.21 0.065 (0.029) 0.025 0.025 (0.029) 0.393 rs6854334 LCORL T/C 0.31 0.118 (0.044) 0.007 0.056 (0.044) 0.195 rs6817306 LCORL T/C 0.32 0.121 (0.044) 0.006 0.054 (0.044) 0.220 rs6830062 LCORL T/C 0.52 0.145 (0.042) 4.8×10⁻⁴ 0.078 (0.042) 0.062 rs710841 PRKG2 T/C 0.02 0.022 (0.034) 0.518 −0.010 (0.034) 0.765 rs2011962 PRKG2 A/C 0.07 −0.042 (0.033) 0.206 −0.008 (0.033) 0.819 rs10472828 NPR3 T/C 0.09 −0.043 (0.030) 0.149 −0.007 (0.030) 0.802 rs10946808 HIST1H1D A/G 0.02 0.020 (0.032) 0.532 −0.015 (0.032) 0.645 rs9358913 HIST1H4F A/G 0.02 0.022 (0.032) 0.492 −0.003 (0.032) 0.927 rs13437082 HLA-B T/C 0.06 −0.042 (0.035) 0.226 −0.004 (0.035) 0.912 rs4711269 HLA-B T/C 0.09 −0.050 (0.034) 0.146 −0.013 (0.034) 0.709 rs7742369 HMGA1/C6orf106 A/G 0.17 −0.074 (0.037) 0.048 −0.050 (0.037) 0.178 rs1776897 HMGA1/C6orf106 T/G 0.09 −0.072 (0.050) 0.151 0.014 (0.050) 0.776 rs2814993 HMGA1/C6orf106 A/G 0.004 −0.012 (0.040) 0.773 −0.047 (0.040) 0.236 rs12189801 GPR126 T/C 0.003 0.011 (0.042) 0.793 −0.039 (0.042) 0.353 rs6570507 GPR126 A/G 0.07 −0.043 (0.032) 0.187 0.013 (0.032) 0.689 rs1182188 GNA12 T/C 0.30 0.086 (0.032) 0.008 0.080 (0.032) 0.013 rs1182179 GNA12 A/G 0.31 0.087 (0.032) 0.007 0.082 (0.032) 0.011 rs849141 JAZF1 A/G 0.14 0.057 (0.032) 0.072 0.008 (0.032) 0.792 rs2282978 CDK6 T/C 0.15 −0.057 (0.031) 0.062 −0.040 (0.031) 0.194 rs1480474 HMGA2 A/G 0.26 0.074 (0.030) 0.014 0.037 (0.030) 0.214 rs8756 HMGA2 A/C 0.42 −0.092 (0.029) 0.002 −0.061 (0.029) 0.039 rs3118912 DLEU7 T/C 0.43 −0.117 (0.037) 0.002 −0.022 (0.037) 0.562 rs3118914 DLEU7 T/G 0.42 −0.115 (0.037) 0.002 −0.020 (0.037) 0.596 rs3116607 DLEU7 A/C 0.16 −0.076 (0.040) 0.055 0.030 (0.040) 0.447 rs3118916 DLEU7 A/G 0.28 −0.098 (0.038) 0.01 −0.015 (0.038) 0.693 rs910316 TMED10 A/C 0.001 0.005 (0.030) 0.865 −0.050 (0.030) 0.090 rs2401171 ADAMTSL3 T/G 0.15 −0.055 (0.029) 0.057 −0.033 (0.029) 0.254 rs7183263 ADAMTSL3 T/G 0.21 −0.065 (0.029) 0.027 −0.044 (0.029) 0.132 rs4842838 ADAMTSL3 T/G 0.21 0.065 (0.029) 0.027 0.044 (0.029) 0.132 rs4911494 UQCC T/C 0.59 −0.112 (0.030) 1.9×10⁻⁴ −0.093 (0.030) 0.002 rs6088813 UQCC A/C 0.57 −0.110 (0.030) 2.5×10⁻⁴ −0.091 (0.030) 0.002 Association of height loci with HAL in the Rotterdam Study (n = 2,341). Associations were calculated on age- and gender-adjusted (univariate) or age-, gender- and height-adjusted (height-adjusted) standardised residuals. Finally, we investigated associations of the 17 validated height loci with measurements of lower limb length (femur) in 3,505 individuals from two cohorts (TwinsUK, N = 2,364 and Chuvasha, N = 1,141). The strongest associations with femur length were observed at rs710841 (PRKG2, P-value = 2.4×10⁻⁵) and rs10946808 (HIST1H1D, P-value = 6.4×10⁻⁶) (Table S4). Exploratory Conditional Analyses We used the following qualitative approach to explore a possible differential contribution of height loci to skeletal size measurements. We selected a homogeneous set of measurements (vertebral heights and HAL in the Rotterdam Study, and femur length in TwinsUK) to avoid bias deriving from heterogeneous measurements among cohorts. Although this is expected to reduce the power to detect statistically significant associations, the magnitude of the betas is unlikely to be materially affected. Secondly, we re-calculated associations of the 17 GW-significant height loci with each skeletal size measurement as described before, only in this case we restricted the analysis to the homogeneous set of measurements. We then performed an analysis where association with each skeletal size measurement was assessed after adding height as an additional term to the linear regression model. We finally compared qualitatively the magnitude of the association, expressed as regression coefficients and SE, in the two models (univariate and height-adjusted). In cases where the locus acts prevalently through the given skeletal size measurement, we expect the regression coefficients of the height-adjusted analysis to show the least reduction compared to the original unadjusted analysis. For loci showing associations in the height-adjusted analysis, we then recalculated associations with height after adding skeletal size in the linear regression model. A null regression coefficient in this case suggests that the height association may be explained by the prevalent effect of the locus on the skeletal measurement under exam. Collectively, these conditional analyses, with relevant caveats [13], can provide some indicative information as to whether the association between relevant genetic variants and height may be mediated by specific components of height. Spine Table 2 shows that in most cases, the betas in the height-adjusted model were either close to the null (e.g. the four SNPs in DLEU7) or strongly reduced (e.g. for the SNPs in HLA-B). The GPR126 locus (rs6570507 and rs12189801) displayed the least reduction in regression coefficients between the two models (Table 2). The regression coefficient of rs6570507 for the reversed scenario (testing association with height after adjusting for trunk size) was close to zero (−0.019 (0.031), P-value = 0.55), a result that may indicate that GRP126 variants may contribute to height principally through trunk length elongation. LCORL SNPsdisplayed a similar albeit less pronounced change in the magnitude of the relevant beta coefficient, where a partial reduction in the regression coefficients (from 0.162 (0.04) to 0.091 (0.04) for rs6830062) was observed after addition of height in the model (Table 2). Hip Axis Length The results of these analyses are shown in Table 3. The GNA12, HMGA2 and UQCC loci showed the smallest attenuation in the magnitude of the regression coefficients in the height-adjusted model. At the other extreme, the magnitudes of beta coefficients at loci such as JAZF1 or HLA-B approached null in the height-adjusted model. Femur length The least reduction in regression coefficients was observed for SNPs in ADAMTSL3 (Table S4). Expression Association Analysis Observed association signals in intergenic regions may be due to regulatory variants of nearby genes. For the 17 validated height loci (Table 1) we undertook an eQTL analysis in 2 Mb windows centered on each lead SNP (see Materials and Methods for details) using expression data from lymphoblastoid cell lines derived from individuals of the four HapMap population panels [14]. The recombination interval harboring rs1182188 contains a total of 27 SNPs tested for association with both height and expression. We tested 14 genes within ±1 MB of this interval and found significant expression association evidence (Spearman Rank correlation P-value 0.8), orange diamonds indicate moderate LD with the lead SNP (0.5 10−5) in one recent GWA scan also using Illumina genome chips [6]. NPR3 encodes for natriuretic peptide (NCP), a protein class that elicit a number of vascular, renal, and endocrine effects that are important in the maintenance of blood pressure and extracellular fluid volume [23]. JAZF1 is a transcriptional repressor associated with a role in endometrial stromal tumors [24]. Interestingly, common variants in JAZF1 were also recently implicated in type 2 diabetes and prostate cancer susceptibility [25],[26], in line with evidence for pleiotropic effects at many common disease loci. The remaining thirteen loci were previously described [6]–[10], confirming highly reproducible height associations despite overall small effect sizes for individual loci. Our study confirmed HMGA2 (rs8756, P-value 5×10⁻¹⁴) and UQCC (rs6088813, P-value 9.8×10⁻¹⁴) as the loci with the strongest overall association with height [6]–[10]. In this study we also attempted, for the first time, to study the contribution of height loci to the components of trunk and leg length using measurements of skeletal size by directly testing associations of the 17 validated height regions with skeletal size parameters of trunk, leg and skeletal frame size, and by conducting an exploratory conditional analysis. Some intrinsic limitations of our study design and analytical approaches need to be taken into consideration in the interpretation of results for skeletal size measurements. Firstly, although we assembled the largest dataset of this kind, the small sample size available for skeletal size associations will have affected our ability to conclusively confirm or rule out associations for some loci. However, the composite nature of height as a phenotype, and an overall higher accuracy and specificity of the skeletal measurements in assessing the contribution of genetic loci to limb length, suggests that smaller sample sizes might be sufficient to detect associations for these intermediate traits with high confidence. For example, the seventeen GW-significant height loci jointly explain approximately 5% of total variance in femur length, which is more than twice the variance in height explained by the same loci combined. In order to increase power, we combined trunk size measurements from different cohorts that, despite being highly correlated, were not identical. Radiographic measurements of vertebral height size (Rotterdam Study) provide a more accurate measure of the skeletal component of trunk height compared to the DXA-derived measurements of the total spine (TwinsUK and Chuvasha), which include inter-vertebral disk heights and potential measurement error due to vertebral crush fractures. Measuring skeletal associations requires methods that are relatively expensive and low-throughput compared to height, making it difficult to assemble large homogeneous samples for analysis. To provide more comparable estimates of association, we focused our analyses on a subset of homogeneous standardised measurements of vertebral size and HAL in the largest available cohort, the Rotterdam Study. To help assess whether components of skeletal height mediated the association between relevant genetic loci and height, and to examine the independency of associations between genetic loci and components of height, we conducted an exploratory conditional analysis. In this and related contexts, conditional analysis to infer conditional independence and mediation has limitations. Conditional analysis of highly correlated traits (for example, height and skeletal subcomponents of height) can lead to an attenuation of effect sizes for relevant genetic loci even when there is no underlying causal network between genetic variants and mediating traits [13]. These analyses also assume that measurement error is evenly distributed among traits. Differences in measurement error among traits can result in spurious inferences - distorting the magnitude of relevant effect sizes in conditional and unconditional analyses. The latter is also relevant to conditional analyses of genetic variants. Moreover, because of the statistical resolution required to assess differences in unconditional and conditional analyses, and the correlated variance structures of these data (testing differences in effect estimates using the same sample population) we opted to use a qualitative assessment of these interrelated associations rather than a quantitative one. With the above caveats in mind, our results provide some interesting first insights into the potential contribution of height loci and possible differential effects on skeletal size measurements. These results should be considered exploratory and will require replication in larger cohorts to better understand their role and address potential sources of heterogeneity including the impact of measurement error. For instance, in a previous study Weedon and colleagues [10] described an association for HMGA2 (rs1042725) with sitting height (0.2 cm increase for the C allele, 95% C.I. 0.1–0.3, P-value = 0.0002) in a cohort of approximately 2,000 children. Although this may suggest a differential effect on trunk length, in our study such association was not replicated in an adult sample of 6,509 individuals for a highly correlated SNP in the same locus (rs8756, r2 = 0.87 in CEU, combined P-value = 0.12). Yet, direct spine length measures in adults are likely to be more precise and specific than measures of sitting height since they are less affected by sources of measurement error that may explain such discordant results. For instance, sitting height is prone to measurement errors affected by head dimensions which are disproportionate in children (having already achieved adult head dimensions around 3 years of age, long before the pubertal growth spurt). In addition, radiographic measures of spine length will also be less affected by other artefacts arising from posture differences, age-specific growth patterns and/or possible common age-related effects of inter-vertebral disk degeneration, all of which can play a key role in this discrepancy. The clinical relevance of the effects observed for these height loci is interesting and merits further exploration. Several loci displayed significant association with HAL, a measurement shown to vary between ethnic groups and to have substantial heritability. In addition HAL is highly correlated with long limb growth and represents an important predictor for osteoporotic fracture [12]. In our study, two intronic variants in the recombination interval containing GDF5 and UQCC (rs4911494 and rs6088813) were strongly associated with HAL in the Rotterdam study (P-values = 1×10⁻⁴ and 1.32×10⁻⁴ respectively), but not with femur length (P-values = 0.83 and 0.76 respectively). GDF5 is a member of the TGF-beta superfamily of growth factors/signalling molecules that act as regulators of cell growth and differentiation in both embryonic and adult tissues. Mutations in this gene are associated with severe skeletal malformations including acromesomelic dysplasia, Hunter-Thompson type, brachydactyly, type C and chondrodysplasia Grebe type [27]–[29]. A common functional SNP in the 5′ UTR of GDF5 (+104T/C; rs143383) has been associated with osteoarthritis (OA), the commonest form of human arthritis characterized by degeneration of articular cartilage and bone remodelling [30],[31]. OA is also under strong genetic influence, with several shared genetic risk factors with skeletal traits including bone density, bone content, turnover and skeletal alignment [32]. The two low-stature alleles rs4911494-A and rs6088813-A were in high linkage disequilibrium with the risk T allele at rs143383 (r2 = 0.93), indicating a possible role of this gene in cartilage metabolism and/or bone shape and alignment in determining height. In summary, this study extended by four the list of loci with confirmed association to adult height, which now comprises 47 independent regions. The use of fine mapping through genotype imputation and resequencing will be important for refining the association signal in each locus and for identifying the true causative variants. The potential differential effects that we observed of height loci to lower limb and trunk growth are consistent with some genes potentially acting as regulators of long-bone growth, while others appear to be specific to different bone sites or to influence cartilage growth. Further analytical and experimental approaches to assess the contribution of height loci to skeletal measurements and intermediate phenotypes will be important to understand the physiology of human growth, and may lead to the identification of genetic variants relevant to diverse musculoskeletal pathologies in humans. Note: While this manuscript was in review the JAZF1 locus was confirmed by an independent study [33]. Materials and Methods Gwas Study Design The initial discovery sample included 9,400 samples of European origin, including 1,430 British individuals (710 females and 720 males) from the British 1958 Birth Cohort, 2,224 individuals from the TwinsUK cohort (all females) and 5,746 individuals (3,374 females and 2,372 males) from a Dutch cohort (Rotterdam Study). After applying quality filters, 299,216 SNPs remained for analysis with data in at least 9,000 individuals. Further details of individual cohorts are given below and in Table S1. In addition to these three cohorts we also had available GWAS data for 3,211 samples from the EPIC Norfolk study, genotyped using the Illumina HumanHap300 (v1) SNP panel. These individuals were genotyped using the Affymetrix 500 K SNP panel in a recent height meta-analysis [9], and therefore do not constitute an independent discovery sample. Nevertheless, as the samples may provide novel loci once combined with different cohorts and a different platform, we included them in a second stage of discovery. Furthermore, these samples provide independent replication for published height signals, except than for those described in the Weedon scan [9] (Table 1). For this reason in Table 1 we provided association statistics both including and excluding the EPIC collection for all loci already described by Weedon and colleagues. Population Samples and Genotyping TwinsUK (KCL) - discovery sample Sample: the TwinsUK cohort (KCL, www.twinsuk.ac.uk) is an adult twin British registry shown to be representative of singleton populations and the United Kingdom population [34]. A total of 2,224 females with height phenotype were included in the discovery cohort, including 1,018 singleton individuals (754 from a MZ pair and 253 from a DZ pair and 11 of unknown zygosity) and 1,206 siblings from 603 DZ twin pairs. In order to increase power in the height analysis, we increased the sample size by considering in the analysis siblings of monozygotic twin pairs not genotyped in the GWAS. Briefly, for each MZ pair where genotype data was available (n = 754), we set the genotype data of the un-genotyped sibling to be identical to that of the genotyped twin. The phenotype was the observed phenotype for the un-genotyped twin. Corrections for sample relatedness (MZ and DZ status) using variance components were incorporated in the subsequent statistical analysis as explained in the Statistical Analysis section. The mean age of the TwinsUK cohort was 46.6 years (range 16–84). Ethics approval was obtained from the Guy's and St. Thomas' Hospital Ethics Committee. Written informed consent was obtained from every participant to the study. Height and skeletal measurements: Standing height (cm) was measured as described in [35]. Length of spine (C4 to L4) and femur (greater trochanter to medial condyle) were taken on TwinsUK subjects (age 18–80 years) using linear pixel count (LPC) on whole body dual energy x-ray absorptiometry (DXA) imaging. LPC uses the regions of interest (ROI) sub-regional analysis mode on a Hologic QDR-4500W DXA scanner (Hologic Inc., Bedford, MA) to determine lengths of bones and has proven to be a valid and reproducible method of measuring DXA lengths with a coefficient of variation (CV%) of 1.6% [36]. Femur and spine length were strongly correlated with height (r = 0.82 and 0.59, Table S1). Genotyping: All samples were typed with Infinium assays (Illumina, San Diego, USA) as described in Richards et al. [34]. For TwinsUK, we pooled together the normalised intensity data [37] for 2,820 Twins UK samples typed at the Duke University Genotyping Center (NC USA), Helsinki University (Finland) and the Wellcome Trust Sanger Institute. We used the Illluminus calling algorithm [38] to assign genotypes in the pooled data. No calls were assigned if an individual's most likely genotyped was called with less than a posterior probability threshold of 0.95. Validation of pooling was achieved via a visual inspection of 100 random, shared SNPs for overt batch effects. None were observed. Finally, intensity cluster plots of significant SNPs were visually inspected for over-dispersion biased no calling, and/or erroneous genotype assignment. SNPs exhibiting any of these characteristics were discarded. We excluded subjects based on the genotype data when (i) SNP call rate was 37% or 0 and p-value 0.8), orange diamonds indicate moderate LD with the lead SNP (0.5
 The shape of the pinna varies widely in the general human population but the genetic
basis of this variation is unknown. Here Adhikari
et al. conduct a genome-wide association study in Latin Americans and discover seven gene
regions influencing pinna morphology, including
EDAR and
TBX15.
The shape of the pinna varies widely in the general human population but the genetic
basis of this variation is unknown. Here Adhikari
et al. conduct a genome-wide association study in Latin Americans and discover seven gene
regions influencing pinna morphology, including
EDAR and
TBX15.