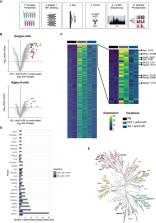
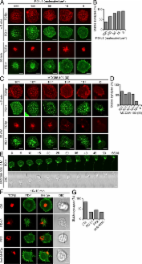
T cell activation requires two distinct signals from the TCRs and the costimulatory receptors. A series of positive and negative costimulatory receptors is expressed on a T cell in variable levels according to the timing and circumstances of the immune response. T cell activation is cooperatively modulated to maintain the appropriate T cell reactivity, particularly by negative costimulatory receptors that help terminate immune responses and also prevent autoimmunity. Cytotoxic T lymphocyte–associated protein 4 (CTLA-4) and programmed cell death 1 (PD-1) are well characterized costimulatory receptors that both negatively regulate T cell activation in the effector phase yet possess distinct features such as protein structure, expression pattern, and ligands. Functional consequences of these differences are documented by the phenotypes of the respective knockout mice. CTLA-4–deficient (Ctla4 −/−) mice develop a severe systemic lymphoproliferative disease and die within 3–4 wk after birth (Tivol et al., 1995; Waterhouse et al., 1995). In contrast, PD-1–deficient (Pdcd1 −/−) mice on the C57BL/6 background develop late-onset progressive arthritis and lupus-like glomerulonephritis (Nishimura et al., 1999), and Pdcd1 −/− BALB/c mice develop autoimmune cardiomyopathy (Nishimura et al., 2001). PD-1 belongs to the immunoglobulin superfamily and lacks a membrane-proximal cysteine required for homodimerization (Zhang et al., 2004). PD-1 is expressed on T and B cells, natural killer cells, monocytes, and DCs (Keir et al., 2008) and its expression in T and B cells is inducible upon stimulation (Agata et al., 1996). There are two PD-1 ligands: PD-1 ligand 1 (PD-L1; also known as B7-H1; Dong et al., 1999; Freeman et al., 2000) and PD-L2 (B7-DC; Latchman et al., 2001; Tseng et al., 2001). PD-L1 is widely and constitutively expressed on both hematopoietic and nonhematopoietic cells; e.g., naive T and B cells, vascular endothelial cells, and pancreatic islet cells, whereas PD-L2 is exclusively and inducibly expressed on professional APCs. Despite the clear autoimmune-prone phenotypes of the Pdcd1 −/− mice, it is still debatable how PD-1 inhibits lymphocyte activation. PD-1 contains two tyrosine motifs in its cytoplasmic tail, an immunoreceptor tyrosine-based inhibition motif (ITIM) and an immunoreceptor tyrosine-based switch motif (ITSM; Okazaki et al., 2001). Both motifs are phosphorylated upon PD-1 engagement, possibly by Lck and/or C-terminal Src kinase in T cells (Sheppard et al., 2004) or by Lyn in B cells (Okazaki et al., 2001). Phosphorylation of the ITIM and ITSM induces the recruitment of Src homology 2 (SH2) domain–containing tyrosine phosphatase 2 (SHP2) and possibly SHP1 in T cells and SHP2 in B cells. Mutagenesis studies clarified a primary function of the ITSM in the association with SHP2 and the inhibition of T cell activation, as opposed to the ITIM, a motif which is typically associated with inhibitory molecules (Okazaki et al., 2001). Upon lymphocyte stimulation, PD-1 engagement reduces the phosphorylation of CD3ζ, zeta-associated protein of 70 kD (Zap70), and protein kinase C θ (PKC-θ) in TCR downstream signaling (Sheppard et al., 2004) and that of Igβ, spleen tyrosine kinase gene (Syk), phospholipase Cγ2 (PLCγ2), and extracellular signal-regulated kinase (Erk) in BCR downstream signaling (Okazaki et al., 2001). It has been also shown that PD-1 blocks the CD28-mediated activation of phosphatidylinositol-3-kinase (PI3K) and the serine-threonine kinase Akt by recruiting SHP2, whereas CTLA-4 directly inhibits Akt, but not PI3K activation, possibly by the association with protein phosphatase 2A (PP2A) (Parry et al., 2005). However, CTLA-4 is also known to be associated by SHP2 and/or SHP1, and PP2A binds both CD28 and CTLA-4 (Chuang et al., 2000). Furthermore, PI3K is activated downstream of not only CD28 but also TCR and CTLA-4 (Rudd and Schneider, 2003). Considering these complexities, there might be a mechanism other than differential contribution of phosphatases that clearly differentiates PD-1– and CTLA-4–mediated inhibitory mechanisms. When a T cell recognizes a cognate antigen peptide-major histocompatibility complex (MHCp) on an APC, it forms an immunological synapse (Monks et al., 1998; Grakoui et al., 1999). The conventional idea has been that the immunological synapse is composed of a central supramolecular activation cluster (c-SMAC) containing the TCR/CD3–MHCp complex and a peripheral SMAC (p-SMAC) containing the adhesion molecules LFA-1 (leukocyte function-associated antigen 1) and intercellular adhesion molecule 1 (ICAM-1). Based on single cell imaging analysis of T cell signaling, we and others have revised this idea and proposed that T cell activation is induced by a minimal T cell activation unit, the TCR microcluster, which consists of TCRs and their proximal signaling molecules (Bunnell et al., 2002; Campi et al., 2005; Yokosuka et al., 2005; Yokosuka and Saito, 2010). We further found that T cell costimulation is also regulated based on the formation of microclusters. In the presence of its ligands CD80 (B7-1) and CD86 (B7-2), the positive costimulatory receptor CD28 is translocated at TCR microclusters to form TCR-CD28 microclusters. CD28 ultimately accumulates at the c-SMAC, particularly at the CD3 low-density (CD3lo) region, where it specifically recruits PKC-θ and the scaffold protein CARMA-1 to form an activation center of the NF-κB pathway as a signaling c-SMAC (Yokosuka et al., 2008; Yokosuka and Saito, 2009). Furthermore, the negative costimulatory receptor CTLA-4 is stored in secretary granules that directly move toward the CD3lo signaling c-SMAC to interfere with CD28–PKC-θ–CARMA-1 cluster formation, resulting in the termination of NF-κB signals (Yokosuka and Saito, 2010; Yokosuka et al., 2010). These dynamic imaging analyses have revealed new aspects of the regulatory mechanism for inducing, sustaining, and terminating activation signals in a distinct subcellular location by forming particular types of microclusters. We report here a molecular imaging analysis of PD-1, which reveals for the first time the dynamic mechanism of PD-1–mediated negative regulation of T cell activation. PD-1 expressed on effector T cells is translocated to TCR microclusters and then accumulates at the signaling c-SMAC in a ligand binding-dependent manner. SHP2 is immediately but transiently recruited to the PD-1 microclusters, associated with PD-1 via the ITSM motif, and induces the dephosphorylation of TCR proximal signaling molecules within the PD-1–TCR microclusters. By altering the PD-1 ectodomain size by using chimeric molecules, we could show that the localization of PD-1 in TCR microclusters is required for the PD-1–SHP2 association and PD-1–mediated suppression. This inhibitory mechanism by PD-1 microclusters operates not only in T cells activated in vitro but also in PD-1hi T cells established in vivo, which may correlate with PD-1–mediated T cell anergy in tolerogenic states. Intervention in the dynamism of PD-1 microclusters may be useful in modulating T cell activation and/or anergy. RESULTS PD-1 accumulation at TCR microclusters PD-1 was previously reported to accumulate at the immunological synapse upon the T cell–APC conjugation (Pentcheva-Hoang et al., 2007). To analyze its localization more precisely, we used the glass-supported planar bilayer system (Grakoui et al., 1999) containing glycosylphosphatidylinositol (GPI)-anchored I-Ek (I-Ek-GPI), and murine (m) ICAM-1, mCD80, and mPD-L1. Primary CD4+ T cells from AND-TCR (specific for moth cytochrome c [MCC] 88–103 on I-Ek) transgenic (Tg) Rag2-deficient (Rag2 −/−) or Pdcd1 −/− Rag2 −/− mice were first stimulated and then retrovirally transduced with enhanced GFP (EGFP)–tagged mPD-1 (PD-1–EGFP). The cells were allowed to settle on the planar bilayer and imaged by total internal reflection fluorescence (TIRF) microcopy. On the planar bilayer, PD-1 formed clusters at the nascent T cell–bilayer contact regions in a ligand binding-dependent fashion and migrated toward the center to form a c-SMAC (Fig. 1, A and B; and Video 1). To examine the localization of TCR and PD-1 clusters, the cells expressing PD-1–EGFP were prestained with a fluorescence-labeled anti–TCR-β (H57) Fab fragment (Varma et al., 2006) and imaged by confocal microscopy. PD-1 was accumulated into the same clusters with TCRs (PD-1–TCR microclusters) in the cells settled onto a planar bilayer containing PD-L1–GPI (Fig. 1 C, left) and 98% of TCR microclusters were colocalized with PD-1 (Fig. 1 D). In parallel with the c-SMAC formation by TCRs, PD-1 segregated from TCRs and accumulated predominantly at the TCR/CD3lo region within the c-SMAC (as the signaling c-SMAC; Yokosuka et al., 2008; Yokosuka and Saito, 2010; Fig. 1 C, right). Not only the introduced PD-1–EGFP but also the endogenous PD-1 could be imaged in effector T cells by anti–PD-1 staining (Fig. 1, E and F). PD-L1 on the planar bilayer was seen as a mirror image of PD-1 at both TCR microclusters and the c-SMAC (Fig. 1 G). These data demonstrate that, in a planar bilayer system, PD-1 is colocalized with TCRs, forms PD-1–TCR microclusters, and subsequently accumulates at the c-SMAC in a fashion dependent on ligand binding. Figure 1. PD-1 is translocated to TCR microclusters by PD-1–PD-L1 binding. (A) CD4+ T cells were purified from AND-Tg Pdcd1 −/− Rag2 −/− mice, stimulated with irradiated B10.BR whole splenocytes with 5 µM MCC88-103 peptide, and retrovirally transduced with PD-1-EGFP. The cells were plated onto an MCC88-103 (10 µM) prepulsed planar bilayer containing I-Ek–GPI (250/µm2), ICAM-1–GPI (100/µm2), and CD80-GPI (80/µm2) without (top) or with (bottom) PD-L1–GPI (150/µm2) and real-time imaged by TIRF microscopy (times are above images; Video 1). Bars, 5 µm. A representative of five independent experiments is shown. (B) Clustering and centripetal movement of PD-1 on the diagonal yellow line in A is presented as horizontal elements in kymographs. Bars, 5 µm. (C) The cells expressing PD-1–EGFP (green) in A were prestained with DyLight 649–labeled H57 Fab (red), plated onto a planar bilayer as in A, and real-time imaged by confocal microscopy at 2 (left) or 20 (right) min after contact. Histograms show fold fluorescent intensities of TCR-β (red) and PD-1 (green) on the two diagonal yellow lines in the merged images. Bars, 5 µm. A representative of three independent experiments is shown. (D) The graph shows the percentage of TCR microclusters colocalized by PD-1 at 2 min after contact in C (n = 5). Error bars represent SD. (E) AND-Tg Rag2 −/− CD4+ T cells were stimulated for 2 d, directly stained with DyLight 649–labeled H57 Fab (red) and DyLight 488–labeled anti–mPD-1 (RMA1-30; green), and imaged as in A. Bars, 5 µm. A representative of four independent experiments is shown. (F) The graph shows the percentage of TCR microclusters colocalized by PD-1 at 2 min after contact in E (n = 10). Error bars represent SD. (G) The cells expressing PD-1–EGFP (green) in A were stained with DyLight 549–labeled H57 Fab (red) and imaged on an MCC88-103 prepulsed planar bilayer containing I-Ek–GPI, ICAM-1–GPI, CD80-GPI, and Cy5-labeled PD-L1–GPI (150/µm2, cyan). Bars, 5 µm. A representative of two independent experiments is shown. (H) Images of cells expressing WT PD-1-EGFP in C at 20 s (left) or 20 min (right) after contact. The yellow squares (a and b) in the left panels are magnified in the right three panels. Yellow arrowheads, a TCR–PD-1 microcluster; red arrowheads, a TCR microcluster not colocalized by PD-1; green arrowheads, a PD-1 microcluster not colocalized by TCR. Bars, 5 µm. A representative of two independent experiments is shown. We previously reported that the newly synthesized TCR microclusters could induce T cell activation signaling initially at the nascent contact regions or later at the periphery of the T cell–bilayer interface; therefore, we carefully analyzed the colocalization of TCRs and PD-1 at both regions. At the initial contact site, the TCR is well colocalized with PD-1, as demonstrated by the yellow spots (Fig. 1 H, left). Later, when a c-SMAC was formed, the TCR–PD-1 colocalization was still observed, but the ratio between TCR and PD-1 was not completely the same (Fig. 1 H, right), suggesting that TCR signaling might be differently regulated by PD-1 at each microcluster. Instability of immunological synapse formation by PD-1 microclusters It was recently demonstrated that PD-1–PD-L1 binding promotes tolerance by blocking the TCR-induced stop signals needed for stable T cell–APC interactions in vivo (Fife et al., 2009). To analyze the regulation of the stop signals by PD-1 microcluster formation, we imaged the cells on a planar bilayer with PD-L1–GPI and calculated the percentage of the cells forming a stable synapse, which is defined as a synapse whose c-SMAC is located at the center and not on the edge. Whereas 90% of cells formed stable synapses in the absence of PD-L1–GPI, >60% of cells broke a stable synapse and began to migrate when the lipid bilayer contained 500 molecules/µm2 PD-L1–GPI, a molecular density which induced obvious PD-1 microclusters and PD-1 accumulation at the c-SMAC (Fig. 2, A and B). Interestingly, even if much lower concentrations of the antigen peptide (from 10 µM to 10 nM) were used, the percentage of the cells forming a stable synapse reached a plateau of 54–68% (Fig. 2, C and D). Similarly to CD28, PD-1 accumulated to form PD-1 microclusters even in the absence of the antigen peptide, although the effector cells quickly began migrating with PD-1 clusters at the uropod (Fig. 2 E). To confirm that the stable synapse formation is regulated by the PD-1–mediated blockade of TCR signals, we directly inhibited TCR signals by addition of the Src kinase inhibitor PP2 or blocking antibodies against AND-TCR–I-Ek-MCC88-103 binding (anti-I-Ek, 14–4-4; anti-I-Ek-MCC88-103, D4) to stop the sustained signals from newly generated TCR microclusters (Varma et al., 2006). As expected, these three inhibitory manipulations resulted in a similar blockade of stable synapse formation: control, 84%; PD-L1-GPI, 34%; PP2, 44%; and anti-MHC, 34% (Fig. 2, F and G). These data suggest that the TCR-mediated stop signal is required for stable synapse formation and that PD-1 microcluster formation upon PD-1–PD-L1 binding in the planar bilayer system directly interferes with the stop signal. Figure 2. PD-1–PD-L1 binding blocks stable synapse formation. (A) AND-Tg Pdcd1 −/− Rag2 −/− CD4+ T cells expressing PD-1–EGFP were stained with DyLight 649–labeled H57 Fab. The cells were plated onto an MCC88-103 prepulsed planar bilayer containing I-Ek–, ICAM-1–, CD80-, and PD-1–GPI at the indicated densities, and real-time imaged by confocal microscopy at 2 (top tow rows) or 20 (bottom tow rows) min after contact. Bars, 5 µm. A representative of two independent experiments is shown. (B) The graph shows the percentage of cells in A forming a stable synapse at 20 min after contact (n = 50). (C) The cells in A were plated onto a planar bilayer containing I-Ek–, ICAM-1–, CD80-, and PD-L1–GPI prepulsed MCC88-103 at the indicated concentrations, and imaged by confocal microscopy at 2 (top tow rows) or 20 (bottom tow rows) min after contact. A representative of two independent experiments is shown. Bars, 5 µm. (D) The graph shows the percentage of cells in D forming a stable synapse at 20 min after contact (n = 50). (E) The cells in C (right column) were real-time imaged by confocal microscopy every 5 s at 10 min after contact. Bar, 5 µm. (F) The cells in A were plated onto an MCC88-103–prepulsed planar bilayer containing I-Ek–, ICAM-1–, and CD80- (row 1, 3, and 4) plus PD-L1–GPI (row 2). At 10 min after contact, the cells were further incubated with control antibodies (50 µg/ml, row 1), the Src kinase inhibitor PP2 (10 µM, row3), or anti-MHCp (14–4-4 and D4, 50 µg/ml each, row 4) for 10 min and imaged. Bars, 5 µm. A representative of two independent experiments is shown. (G) The graph shows the percentage of cells in F forming a stable synapse at 20 min after contact (n = 50). SHP2 recruitment at PD-1 microclusters To examine the physical association of PD-1–SHP2 or –SHP1 under physiological conditions, we introduced PD-L1 or PD-L2 into a DC cell line (DC-1) expressing I-Ek and stimulated AND-TCR T cell hybridomas expressing Flag-tagged PD-1 (PD-1–Flag) with peptide-prepulsed DC-1 cells for biochemical assays. As shown previously, SHP2 was recruited to PD-1 upon the PD-1–PD-L1 or –PD-L2 binding, whereas the PD-1–SHP1 association remained at background level (Fig. 3 A). The amount of SHP2 recruited to PD-1 was dependent on the strength of TCR stimulation (Fig. 3 B). The association reached a peak in the early phase of T cell activation (Fig. 3 C) and paralleled the dephosphorylation of the proximal TCR signaling molecules, preceding the phosphorylation of Erk which is maximized at 2 min after T cell–DC-1 conjugation (Fig. 3 D). At 30–60 min after stimulation, a small amount of SHP1 was detected in PD-1 immunoprecipitates (Fig. 3 C). Figure 3. SHP2, not SHP1, is transiently recruited to PD-1 microclusters. (A) AND-TCR T cell hybridomas expressing PD-1-Flag were stimulated by 5 µM MCC88-103 prepulsed DC-1 cells not expressing (−) or expressing PD-L1 (L1) or PD-L2 (L2) for 0 or 5 min. Cell lysate immunoprecipitated by anti-Flag or WCLs were blotted for SHP1, SHP2, or PD-1. A representative of five independent experiments is shown. (B) The cells in A were stimulated by nonexpressing or PD-L1–expressing DC-1 cells prepulsed with MCC88-103 at the indicated concentrations for 2 min. The cells were lysed, immunoprecipitated and blotted as in A. A representative of two independent experiments is shown. (C) The cells in A were stimulated with 5 µM MCC88-103 prepulsed DC-1 cells not expressing (−) or expressing PD-L1 (+) for the indicated times. The cells were lysed, immunoprecipitated, and blotted as in A. A representative of four independent experiments is shown. (D) The PD-1–SHP2 association was analyzed as in C at much earlier time points indicated above. WCLs were blotted for SHP2, PD-1, phospho-PLCγ1, PLCγ1, phospho-Vav1, Vav1, phospho-Erk1/2, or Erk1/2. The graph shows fold intensities of SHP2 to PD-1 or phosphorylated PLCγ1, Vav1, or Erk to nonphosphorylated at each time point. A representative of two independent experiments is shown. (E) AND-TCR T cell hybridomas expressing PD-1–YPet (yellow) and ECFP-SHP1 (top) or -SHP2 (bottom, cyan) were plated onto an MCC88-103 prepulsed planar bilayer containing I-Ek–, ICAM-1–, CD80-, and PD-1–GPI and real-time imaged by confocal microscopy within 2 min after contact. FRET efficiency values presented as a pseudo-color scale. Histograms show fold fluorescent intensities of PD-1 (yellow) and SHP1 or SHP2 (cyan) on the two diagonal yellow lines in a DIC image. Bars, 5 µm. A representative of two independent experiments is shown. (F) AND-TCR T cell hybridomas expressing PD-1-YPet (yellow) and CFP for energy transfer CyPet-SHP1 (left, cyan) or -SHP2 (right, cyan) were conjugated with DC-1 cells not expressing (top) or expressing PD-L1 (middle) or PD-L2 (bottom) and real-time imaged by confocal microscopy at 2 min after contact. Histograms show fold fluorescent intensities of PD-1 (yellow) and SHP1 or SHP2 (cyan) on the diagonal yellow line in a DIC image. Bars, 5 µm. A representative of two independent experiments is shown. We next examined the PD-1–SHP2 or –SHP1 association from the viewpoint of microcluster formation by using AND-TCR T cell hybridomas expressing PD-1–YFP for energy transfer (YPet) and enhanced CFP (ECFP)–SHP1 or –SHP2. We confirmed that SHP2, but not SHP1, was localized in the PD-1 microclusters only at the initial T cell–bilayer contact (Fig. 3 E), but this colocalization was not observed at later time points (not depicted). The SHP2 cluster was dim, probably as a result of its predominant localization in the cytosol, but the PD-1–SHP2 assembly was clearly shown by the measurement of fluorescence resonance energy transfer (FRET; Fig. 3 E). The SHP2 accumulation could be further imaged at the immunological synapse in the T cell–APC conjugates (Fig. 3 F). Collectively, these data suggest that, just in the early T cell activation stage, the ligand binding of PD-1 triggers the recruitment of SHP2 to form PD-1–SHP2 microclusters. PD-1 tyrosine motifs required for SHP2 recruitment, but not for PD-1 clustering PD-1 contains two tyrosine motifs in its cytoplasmic tail, ITIM (V/IxY225xxL/V) and ITSM (TxY248xxV/I), and mutation of the ITSM tyrosine is known to abolish the capacity of PD-1 to inhibit T cell activation by recruitment of SHP2 (Okazaki et al., 2001; Chemnitz et al., 2004). To confirm the functions of these tyrosine motifs in PD-1 microcluster formation and in PD-1–mediated suppressive function, we examined the cells expressing WT or mutant PD-1 with tyrosine to phenylalanine substitutions in the ITIM (Y225F), ITSM (Y248F), or both (Y225/248F, YFYF) in imaging, biochemical, or biological analyses. In the planar bilayer system, PD-1 microcluster formation and its translocation to the c-SMAC were similarly induced in both WT and mutant PD-1 (Fig. 4, A and B). However, Y225F partially lost the capacity, and both Y248 and YFYF mutants completely lost the capacity, for physical association with SHP2 (Fig. 4 C) and the suppressive activity for IL-2 production both in T cell hybridomas (Fig. 4 D) and in primary effector T cells (not depicted). These suppressive functions were restored if either SHP1 or SHP2 was directly ligated to the cytoplasmic tail of the YFYF mutant (Fig. 4 E), indicating that the recruitment of phosphatases to PD-1, and not the substrate specificity, is critical for PD-1–mediated suppression. As we expected, both tyrosine motifs were responsible for the instability of an immunological synapse because AND-TCR Tg Pdcd1 −/− Rag2 −/− cells expressing Y225F, Y248F, or YFYF mutant PD-1 formed a higher percentage of stable synapses than WT: WT, 40%; Y225F, 50%; Y248F, 58%; YFYF, 80%; and WT without PD-L1-GPI, 94% (Fig. 4, A and F). These results suggest that ITSM are fully required, and ITIM are partially required, for the PD-1–mediated suppression of T cell activation and stop signals by recruiting SHP2, but not for PD-1 microcluster formation. Figure 4. The tyrosine motifs in PD-1 are required for PD-1–mediated T cell suppression, not for PD-1 clustering. (A) AND-Tg Pdcd1 −/− Rag2 −/− CD4+ T cells were reconstituted with WT (top) or Y225F (row 2), Y248F (row 3), or Y225/248F (YFYF, bottom) mutant PD-1–EGFP (green), and were prestained with DyLight 649–labeled H57 Fab (red). The cells were plated onto an MCC88-103 prepulsed planar bilayer containing I-Ek–, ICAM-1–, CD80-, and PD-1–GPI and real-time imaged by confocal microscopy at 2 (left) or 20 (right) min after contact. Histograms show fold fluorescent intensities of TCR-β (red) and PD-1 (green) on the two diagonal yellow lines in the merged images. Bars, 5 µm. A representative of three independent experiments is shown. (B) The graph shows the percentage of TCR microclusters colocalized by WT or mutant PD-1 at 2 min after contact in A (n = 5). Error bars represent SD. (C) AND-TCR T cell hybridomas expressing WT or Y225F, Y248F, or YFYF mutant PD-1–Flag were stimulated with 5 µM MCC88-103 prepulsed DC-1 cells not expressing or expressing PD-L1 for 2 min. Cell lysate immunoprecipitated by anti-Flag or WCLs were blotted for SHP2 or PD-1. A representative of three independent experiments is shown. (D) Not transduced or PD-1–transduced AND-TCR T cell hybridomas in C were stimulated with an equal number of DC-1 cells expressing PD-L1 or PD-L2 with 0.3 µM MCC88-103 for 16 h. Immobilized anti-CD3ε (2C11, 10 µg/ml) and anti-CD28 (PV-1, 2 µg/ml) were used for control stimulation. Concentration of IL-2 was measured by ELISA. A representative of two independent experiments is shown. Error bars represent SD. (E) SHP1 or SHP2 were directly attached to the cytoplasmic tail of the YFYF mutant PD-1 and transduced into AND-TCR T cell hybridomas. The inhibitory function of the PD-1 YFYF-SHP1/SHP2 chimeras was analyzed as in D. A representative of three independent experiments is shown. Error bars represent SD. (F) The graph shows the percentage of cells in A forming a stable synapse at 20 min after contact (n = 50). Error bars represent SD. Regulation of PD-1 phosphorylation by SHP2 In both T and B cells, PD-1 phosphorylation can be induced by cross-linking of PD-1 and is expected to be required for the recruitment of phosphatases through the SH2 domain (Okazaki et al., 2001; Chemnitz et al., 2004). During the physiological T cell–APC conjugation, the PD-1–PD-L1 binding also induced PD-1 phosphorylation at a minimal level and, surprisingly, the phosphotyrosine intensity became much more evident if T cells were transduced to express phosphatase-dead dominant-negative forms of SHP1 (SHP1CS, C453S) or SHP2 (SHP2CS, C461S; Fig. 5 A). The observations that SHP2CS enhanced the PD-1 phosphorylation more than SHP1CS and that WT SHP2 and SHP1 did not affect the PD-1 phosphorylation (unpublished data) suggest that SHP2 dephosphorylates PD-1 by its recruitment and association with the PD-1 cytoplasmic tail. At the later phase, the assembly of PD-1–SHP1 is gradually increased (Fig. 3 C), but the phosphorylation of PD-1 was still weaker in cells expressing SHP1CS than in cells expressing SHP2CS (unpublished). Whereas SHP2CS completely abrogated PD-1–mediated suppression of IL-2 production, SHP1CS had only a partial effect (Fig. 5 B). On the contrary, the IL-2 suppression mediated by CTLA-4, which has been suggested to recruit SHP1 and/or SHP2, was not affected by the introduction of SHP2CS to the cells stimulated by immobilized anti-CD3ε with anti–CTLA-4 (Fig. 5 C). The kinetics of PD-1 phosphorylation paralleled those of SHP2 recruitment to PD-1 (Fig. 5 D). The ITIM was involved in, and the ITSM was essential for, PD-1 phosphorylation (Fig. 5 E). The experiments using T cell–APC conjugates consistently demonstrated both the PD-1–induced suppression and the SHP2CS-mediated augmentation of phosphotyrosine staining at the immunological synapse (Fig. 5 F). These data indicate that the phosphatase activity of SHP2, not SHP1, more efficiently affects the phosphorylation status of the molecules that are accumulated at the immunological synapse, including PD-1 itself, when PD-1 is ligated by PD-L1 in the T cell–APC conjugates. Figure 5. PD-1 phosphorylation is predominantly regulated by the phosphatase activity of SHP2. (A) AND-TCR T cell hybridomas expressing PD-1–EGFP not transduced or transduced with phosphatase-dead SHP1 (SHP1CS) or SHP2 (SHP2CS) were stimulated with unpulsed or 5 µM MCC88-103 prepulsed DC-1 cells not expressing or expressing PD-L1 for 2 min. The cells were lysed, immunoprecipitated with anti-GFP, and blotted for phosphor-tyrosine (4G10) or PD-1. The bottom four rows show WCL blotted with 4G10, anti-SHP1, SHP2, or PD-1. A representative of three independent experiments is shown. (B) The cells in A were stimulated with DC-1 cells not expressing or expressing PD-L1 or PD-L2 with 0.3 µM MCC88-103 for 16 h. Concentration of IL-2 was measured by ELISA. A representative of two independent experiments is shown. Error bars represent SD. (C) AND-TCR T cell hybridomas expressing CTLA-4 were further transduced with SHP1CS or SHP2CS. The cells were stimulated by immobilized anti-CD3ε (2C11, 10 µg/ml) and control IgG or anti-CTLA-4 (UC10, 10 µg/ml) for 16 h. Concentration of IL-2 was measured by ELISA. The cell number initially prepared was measured by a Cell Counting kit. A representative of two independent experiments is shown. Error bars represent SD. (D) AND-TCR T cell hybridomas expressing both PD-1-EGFP and SHP2CS were stimulated with 5 µM MCC88-103 prepulsed DC-1 cells not expressing or expressing PD-L1 for the indicated times. The cells were lysed, immunoprecipitated, and blotted as in A. A representative of three independent experiments is shown. (E) AND-TCR T cell hybridomas expressing SHP2CS and WT or mutant PD-1-EGFP were stimulated with 5 µM MCC88-103 prepulsed DC-1 cells not expressing or expressing PD-L1 for 2 min. The cells were lysed and blotted as in A. A representative of three independent experiments is shown. (F) The cells in A were conjugated with 5 µM MCC88-103 prepulsed DC-1 cells not expressing or expressing PD-L1. At 2 min after contact, the cells were fixed, stained with 4G10, and imaged by confocal microscopy. Bars, 5 µm. The right graph shows the percent intensity of phosphotyrosine at the T cell–DC-1 interface against that of the entire T cell area. A representative of two independent experiments is shown. *, P Igx1 > Igx2; Fig. 7 E). Early during T cell activation, the physical association between PD-1 and SHP2 as well as the dephosphorylation of Vav1, PLCγ1, and Erk was not induced in the cells expressing the taller chimeras (Fig. 7 F). As expected, the taller PD-1 chimeras also remain unphosphorylated (Fig. 7 G). When SHP1 or SHP2 were directly attached to these PD-1 chimeras (Fig. 8, A and B), the taller molecules still lacked PD-1–mediated suppressive activity (Fig. 8 C). Collectively, these data indicate that the colocalization between TCR and PD-1 in the same microclusters is required for effective PD-1–mediated suppression of TCR signals, as measured by both functional and biochemical outputs. Figure 7. Colocalization of PD-1 and TCRs at microclusters is required for PD-1–mediated T cell suppression. (A) A diagram of the EGFP-tagged mPD-1–hCD22–mPD-1 or mPD-1–hCD4–mPD-1 chimeras. The murine PD-1 IgV domain was attached to the second to sixth (Igx5), third to sixth (Igx4), fifth and sixth (Igx2), or sixth (Igx1) IgC domains of hCD22 or the stalk region of hCD4 (Igx0). The cytoplasmic tail of hCD22 or hCD4 is exchanged by that of murine PD-1 containing two tyrosine motifs, ITIM and ITSM, and further tagged with EGFP at the C terminus of mPD-1. (B) AND-TCR T cell hybridomas were not transduced (−) or transduced with EGFP-tagged WT PD-1 (WT) or elongated mPD-1 chimeras shown in A. The histograms show expression of cell surface PD-1 (top) or EGFP (bottom). (C) AND-Tg Pdcd1−/− Rag2−/− CD4+ T cells were reconstituted with the EGFP-tagged elongated PD-1, mPD-1–hCD22/CD4–mPD-1-EGFP constructs (Igx0–5; green) in A, stained with DyLight 649–labeled H57 Fab (red), plated onto an MCC88-103 prepulsed planar bilayer containing I-Ek–, ICAM-1–, and CD80- (top) plus PD–L1-GPI (bottom six rows), and real-time imaged by confocal microscopy at 2 min after contact. Histograms show fold fluorescent intensities of TCR-β (red) and PD-1 (green) on the two diagonal yellow lines in the merged images. Bars, 5 µm. A representative of two independent experiments is shown. (D) The left graph shows the percentage of TCR microclusters colocalized by WT or elongated PD-1 in C (n = 10). The right graph shows the percentage of cells forming >50% of TCR microclusters colocalized by PD-1 in C (n = 50). Error bars represent SD. (E) AND-TCR T cell hybridomas expressing the EGFP-tagged elongated PD-1 chimeras in B were stimulated with DC-1 cells expressing PD-L1 or PD-L2 with 0.3 µM OVA88-103 for 16 h. Immobilized anti-CD3ε (2C11) and anti-CD28 (PV-1) were used for control stimulation. Concentration of IL-2 was measured by ELISA. A representative of three independent experiments is shown. Error bars represent SD. (F) The cells in B were stimulated with MCC88-103 prepulsed DC-1 cells not expressing or expressing PD-L1 for 2 min. The cells were lysed, immunoprecipitated with anti-GFP, and blotted for SHP2 or PD-1. WCLs (bottom six rows) were blotted for PD-1, phospho-Vav1, Vav1, phospho-PLCγ1, PLCγ1, phospho-Erk1/2, or Erk1/2. A representative of three independent experiments is shown. (G) The cells in B were further transduced with SHP2CS and stimulated as in F. The cells were lysed, immunoprecipitated with anti-GFP (top two rows), and blotted with 4G10 (top) or anti-GFP (middle). WCLs (bottom) were blotted for SHP2. A representative of two independent experiments is shown. Figure 8. Clustering of phosphatase outside TCRs microclusters is less effective for suppression of IL-2 production. (A) A diagram of the mPD-1–hCD22–mPD-1 YFYF–mSHP1 or –mSHP2 chimeras. The tyrosine substitution (Y225/148F) was inserted and EGFP was replaced by mSHP1 or mSHP2 in mPD-1–hCD22–mPD-1–EGFP chimeras as in Fig. 7 A. (B) AND-TCR T cell hybridomas were not transduced (−) or transduced with WT or YFYF mutant PD-1 or the YFYF mutant or the elongated PD-1 YFYF fused to SHP1 (YFYF, Igx5, Igx4, Igx2, or Igx1-SHP1) or SHP2 (YFYF, Igx5, Igx4, Igx2, or Igx1-SHP2) in A. The histograms show cell surface expression of the various PD-1 chimeras fused by SHP1 (left) or SHP2 (right). (C) The cells in B were stimulated with DC-1 cells expressing PD-L1 or PD-L2 with 0.3 µM MCC88-103 for 16 h. Immobilized 2C11 and PV-1 were used for control stimulation. Concentration of IL-2 was measured by ELISA. A representative of two independent experiments is shown. Error bars represent SD. Anergic status of PD-1hi CD8+ T cells by PD-1 microclusters Our results clearly show that PD-1 clustering can suppress TCR signals in activated CD4+ T cells established in vitro. The inhibitory function by PD-1 microclusters in another subset of T cells that naturally express high levels of PD-1 (PD-1hi) was then examined. By an analogous protocol used to generate exhausted T cells by continuous stimuli with chronic viral infection (Barber et al., 2006), we subcutaneously injected a small amount of antigen peptide everyday for 1 wk into OT-I-TCR (specific for OVA 257–264 on H-2Kb) Tg Rag2 −/− mice. 1 wk after the final injection, OT-I-TCR Tg CD8+ T cells expressed less CD25, intermediate CD44 and CD62L, and higher PD-1 as compared with naive T cells (Fig. 9 A). The PD-1hi CD8+ T cells responded less well than naive CD8+ T cells upon in vitro restimulation with antigen peptides (Fig. 9 B). Those responses were restored if PD-1–PD-L1 binding was blocked by a neutralizing antibody, anti–PD-L1 (MIH5), but not by nonblocking antibodies anti–PD-1 J43 or RMP1-30. These effects appeared similar to the situation in which tolerance was abolished by anti–PD-L1 antibody treatment of exhausted T cells (Barber et al., 2006; Yang et al., 2011). To examine the cluster formation in OT-I-TCR Tg CD8+ T cells, we further modified the planar bilayers by reconstitution with H-2Kb-GPI instead of I-Ek-GPI. In naive T cells, there was no PD-1 cluster formation or even any PD-1 staining in the presence of PD-L1–GPI. However, in PD-1hi CD8+ T cells, the accumulation of PD-1 at TCR microclusters and the c-SMAC was clearly observed, but this was prevented by the addition of anti–PD-L1 (Fig. 9 C). These data reveal the strong correlation between PD-1 microcluster disruption and the tolerance breaks in PD-1hi CD8+ T cells. Figure 9. Anti–PD-L1 blocks PD-1 microcluster formation and anergic status in PD-1hi CD8+ T cells. (A) OT-I-Tg Rag2−/− mice were subcutaneously injected with 3 nmol OVA257-264 in 100 µl PBS everyday for 1 wk. Histograms show the cell surface expression of CD25, CD44, CD62L, and PD-1 on splenic CD8+ T cells from OT-I-Tg Rag2−/− mice before (top) or at 7 (middle) or 14 (bottom) d after first challenge. A representative of three independent experiments is shown. (B) Naive or OVA257-264–challenged (PD-1hi) OT-I-Tg CD8+ T cells were stimulated with irradiated C57/BL6 whole splenocytes for 15 h with the indicated concentrations of OVA257-264 in the absence or presence of anti-PD-1 (J43 or RMA1-30) or anti-PD-L1 (MIH5). 10 ng/ml PMA and 0.5 µM ionomycin were used for control stimulation. Concentration of IL-2 was measured by ELISA. A representative of three independent experiments is shown. Error bars represent SD. (C) Naive or OT-I-Tg PD-1hi CD8+ T cells in A were stained with DyLight 649–labeled H57 Fab (red) and DyLight 488–labeled anti–PD-1 (RMA1-30) (green), plated onto an OVA257-264 prepulsed planar bilayer containing H-2Kb–, ICAM-1–, and CD80- (row 2) plus PD-L1–GPI (rows 1, 3, and 4), and real-time imaged by confocal microscopy at 2 (left) or 20 (right) min after contact in the absence (top three rows) or presence (bottom) of anti–PD-L1 (MIH5). Histograms show fold fluorescent intensities of TCR-β (red) and PD-1 (green) on the diagonal yellow lines in the merged images. Bars, 5 µm. A representative of two independent experiments is shown. DISCUSSION In spite of the distinct disease phenotypes of Pdcd1 −/− mice and the dramatic effects in several clinical trials with anti–PD-L1 and anti–PD-1 (Francisco et al., 2010), the mechanism of PD-1–mediated suppression of TCR signals remains a matter of debate. We have described here our finding of a novel signalosome constructed by PD-1 as a negative costimulatory microcluster. In a similar manner to CD28, which forms TCR–CD28 microclusters to induce positive costimulatory signals by generating the NF-κB–related molecular complex (Yokosuka et al., 2008), PD-1 generates the TCR–PD-1 microcluster, which decreases the phosphorylation of the entire spectrum of TCR downstream signaling molecules by recruiting SHP2, resulting in the attenuation of T cell activation. Interestingly, not only PD-1 clustering but also its colocalization at TCR microclusters is absolutely required and essential for the efficient inhibition of TCR proximal signaling by PD-1. A concept of the geometrical and bidimensional patterning of the TCR and its downstream molecules was first defined as an immunological synapse (Monks et al., 1998; Grakoui et al., 1999) and is considered to be important for the T cell–APC communication and succeeding activation, proliferation, and differentiation of T cells. PD-1 was shown to accumulate at the immunological synapse in a linear shape depending on the affinity for its ligands (Pentcheva-Hoang et al., 2007). Meanwhile, we and others have revised the immunological synapse concept by identifying the TCR microcluster as a minimal activation unit for T cell activation (Bunnell et al., 2002; Campi et al., 2005; Yokosuka et al., 2005; Saito and Yokosuka, 2006). TCR microclusters contain most of the proximal TCR signaling molecules, for example, Zap70, SLP-76 (SH2 domain–containing leukocyte protein of 76 kD; Yokosuka et al., 2005), Vav1 (Miletic et al., 2006), and PLCγ1 (Braiman et al., 2006). Previous biochemical studies demonstrated that Zap70, PI3K, and PKC-θ could be the substrates of PD-1–mediated dephosphorylation in T cells (Sheppard et al., 2004). These findings are consistent with our data on the spatiotemporal regulation by TCR–PD-1 microclusters because these three molecules and SHP2 are first translocated to the TCR–PD-1 microclusters, which are newly generated at the nascent contact region of a T cell–bilayer interface. In the case of BCR signaling, PD-1 engagement has been shown by biochemical analysis to attenuate the phosphorylation of Igβ, Syk, and PLCγ2 (Okazaki et al., 2001). Meanwhile, such signaling molecules were imaged at BCR microclusters in the planar bilayer system (Fleire et al., 2006; Weber et al., 2008). Collectively, PD-1 is suggested to globally dephosphorylate signaling molecules that are recruited to TCR or BCR microclusters or to dephosphorylate the very upstream, key molecules, such as CD3ζ or Zap70/Syk, at the very early activation phase. The real targets of PD-1–mediated dephosphorylation of TCR signaling molecules remain unclear because CD3ζ is the signal triggering molecule upon its phosphorylation induced by the TCR–MHCp binding. However, the fact that both SHP1 and SHP2 could induce the PD-1–mediated suppression of T cell activation, when these phosphatases were artificially attached to the cytoplasmic tail of the YFYF mutant PD-1, suggests that the localization rather than the substrate specificity of phosphatases is more critical. Whether PD-1 dephosphorylates the substrates only within the TCR–PD-1 microclusters may be related to its ligand distribution. PD-L1, which is expressed on a professional APC, mainly functions with a cognate MHCp on the same APC, whereas PD-L2, mainly expressed on the endothelial cells in the periphery, functions independently of MHCp, suggesting that the PD-1–PD-L1/PD-L2 binding prevents excess activation of TCR signaling to maintain T cell quiescence (Freeman et al., 2000; Tseng et al., 2001; Keir et al., 2008). Our data clearly demonstrate that the stronger TCR stimulation induces much stronger phosphorylation of PD-1 and association with SHP2. However, a weak increment of PD-1 phosphorylation and PD-1–SHP2 association could be observed even in the absence of the cognate peptide, compared with their basal level without PD-1–PD-L1 binding. It will be of future interest to understand such TCR signaling-independent suppression of T cell activation by PD-1, possibly reflecting the involvement of PD-L2 on nonlymphoid cells for PD-1–mediated suppression. The issue of how PD-1 and CTLA-4 differently mediate T cell suppression remains controversial. Both of these are inducibly expressed upon TCR stimulation and function as feedback regulation of T cell activation. In an experimental setting, CTLA-4 ligation by specific antibodies induces T cell suppression and, in this case, CTLA-4 inhibits Akt activation by recruiting PP2A. In contrast, PD-1 directly regulates PI3K, which is a critical upstream regulator of Akt (Parry et al., 2005), suggesting that CTLA-4 and PD-1 inhibit Akt by distinct mechanisms (Riley, 2009). PD-1 is consistently colocalized with PI3K p85α and p110δ subunits at the TCR microclusters during the early activation of T cells. Meanwhile, CTLA-4 is directly translocated to the c-SMAC where it competes with CD28 in ligand-binding at a later activation phase (Yokosuka et al., 2010). PD-1 stimulation upon ligand binding induces robust recruitment of SHP2, although it has never been shown that CTLA-4 engagement induces enhanced recruitment of a phosphatase. To identify another essential difference between them, we focused on PKC-θ recruitment to CD28 and clearly demonstrated the direct and indirect obstruction of this recruitment by CTLA-4 and PD-1, respectively. This difference is consistent with the fact that proximal TCR signaling is intact during CTLA-4–mediated T cell suppression. In contrast, PD-1–mediated inhibition suppresses very proximal signaling and eventually overall TCR signaling by its association with SHP2. Moreover, the observation that SHP1 shows association with PD-1 at later phase may suggest another possible mechanism to negatively regulate TCR signals, for example, to directly dephosphorylate the CD28–PKC-θ–CARMA-1 axis or other pathways that associate with the c-SMAC. Costimulation regulation is largely dependent on the strength of both TCR and costimulation signals. The latter depends on the distribution patterns and the expression level of receptors and their ligands. The biological relevance of CTLA-4 and PD-1 regulation should be examined in vivo during immune responses and in inflammatory conditions. Almost all of the TCR microclusters were colocalized with PD-1 in the presence of the ligand. However, the ratio between the TCR and PD-1 in a single microcluster varies and either TCR or PD-1 was not detected in some microclusters, particularly the ones at the periphery of the T cell–bilayer interface after the c-SMAC formation. Such differential degree of PD-1 clustering may suggest that the TCR downstream signaling might be suppressed to a different degree in each microcluster. Such heterogeneity is regulated by various factors, such as the expression level of the TCR or PD-1, their cell surface distribution before and after activation, the localization of microclusters in an immunological synapse, and the timing of analysis during the course of activation. We stressed the importance of the colocalization between TCRs and PD-1 in the same microcluster to exhibit the PD-1–mediated suppression. Although PD-1 could form microclusters even in the absence of the TCR ligation, such PD-1 clusters could not induce suppression of TCR signaling because of the lack of the PD-1 phosphorylation and the SHP2 association. Function of the PD-1 clustering without TCR engagement remains to be analyzed. The duration of the T cell–DC contact is critical for full activation of a T cell. There appears to be a stepwise interaction between the two cells, ranging from transient contact to a stable interaction with synapse formation (Mempel et al., 2004). The two major negative costimulatory receptors, CTLA-4 and PD-1, were reported to disrupt the TCR-mediated stop signal, resulting in instability of synapse formation (Schneider et al., 2006; Fife et al., 2009). However, the precise mechanism of the stop signal inhibition remains unclear. We demonstrated that the instability of the synapse formation was induced both by the PD-1–PD-L1 binding by the inhibition of TCR–MHCp binding or Src kinase activity. It was previously shown that anti-MHCp terminates sustained calcium signals by interfering with the sequential generation of TCR microclusters (Varma et al., 2006). This indicates that discontinuation of TCR proximal signals interrupts the stop signals, similar to the observed inhibition of triggering of TCR signals at microclusters by PD-1–PD-L1 binding. It is clear that PD-1 requires its cytoplasmic tail and extracellular domain to break a stable synapse. In contrast, the CTLA-4–induced effect is more complex and controversial as a result of its strong adhesion function through its high-affinity binding to the ligands, and because of the enhancement of the regulator for cell adhesion and polarization type 1 (Rap1)–mediated LFA-1 activation (Schneider et al., 2005). In the planar bilayer system, the immunological synapse by AND-Tg Cd28 −/− CD4+ T cells is formed more stability upon CTLA-4–CD80 binding, suggesting an adherent capacity of CTLA-4 (unpublished data). This issue remains to be resolved by analysis of in vivo experimental settings under physiological conditions. PD-1 is expressed on activated T cells and has been shown to be critically involved in the pathogenesis of several autoimmune diseases, such as type I diabetes, multiple sclerosis, and rheumatoid arthritis (Keir et al., 2008). More importantly, neutralizing antibodies to PD-L1 or PD-1 can improve disease status and are now being used in clinical trials. Furthermore, it was recently elucidated that PD-1 is expressed on several unique T cell subsets, exhausted T cells (Janssen et al., 2003; Barber et al., 2006; Day et al., 2006), regulatory T (T reg) cells (Nishimura et al., 1996), and senescent T cells (Shimatani et al., 2009). All these T cells expressing PD-1 has been shown to exist in an unresponsive or anergic state. Exhausted CD8+ T cells emerge during chronic viral infections such as hepatitis C virus and human immunodeficiency virus. The T cells become anergic after recurrent contact with antigen or virus, a status which is surprisingly and totally abolished by anti–PD-L1 antibody treatment (Day et al., 2006). There has as yet been no satisfactory explanation for this outcome, but it could be explained by our experiments using the PD-1hi CD8+ T cells induced by repetitive antigen exposure. In this experimental setting, anti–PD-L1 inhibits PD-1 accumulation at either TCR microclusters or the c-SMAC, which probably results in the restoration of proximal TCR signals. In contrast to these in vitro studies of exhausted T cells, PD-1 expressed on T reg cells seems to exhibit distinct functions in vivo because a PD-L1–Ig chimeric protein can induce a profound increase of T reg cells by enhancement of Foxp3 expression (Francisco et al., 2009). The precise mechanism of this PD-1–mediated T reg cell induction remains to be resolved. It is widely recognized that stronger TCR signals are important for T reg cell development (Sakaguchi et al., 2008), in contrast to the PD-1–mediated attenuation of TCR signals. Further analyses are required for clarification of the distinction of PD-1 functions between development and maintenance of T reg cells. We demonstrated here that PD-1 possesses an ingenious mechanism to modulate TCR signals in a spatial and temporal manner. Other costimulatory receptors, CD28 and CTLA-4, also function dynamically on the basis of their own unique characteristics. A complex costimulatory receptor network is fine-tuned by the expression of receptors and their ligands in the correct places, with the right timing and at appropriate doses, and is further regulated by signals from other costimulatory receptors and TCRs. Our imaging analysis revealed a novel costimulatory signalosome that helps to clarify the T cell signal network from the point of view of subcellular spatial regulation. Recently, anti–PD-L1 and PD-L1–Ig have been applied in clinical trials on the basis of their strong attenuation of TCR signals (Zou and Chen, 2008; Francisco et al., 2010). Our discovery of the formation and function of the PD-1 microcluster suggests that it may be a therapeutic target for disease modulation. MATERIALS AND METHODS Reagents. The following antibodies and reagents were purchased: anti–mPD-1 (J43 and RMA1-30), FITC–anti-mCD4 (RM4-5), PE–anti–mPD-1 (J43), PE–anti-mCD25 (PC61.5), PE–anti-mCD62L (MEL-16), PE–anti-mCD80 (16-10A1), PE–anti-mClassII (M5/114.15.2), PE–anti–mPD-L1 (MIH5), PE–anti–mPD-L1 (TY25), and PE–isotype-matched control IgG (eBioscience); Alexa Fluor 647–labeled anti-pCD3ζ (BD); rabbit polyclonal anti–PKC-θ (C-18), anti-SHP1 (C-19), anti-SHP2 (C-18), anti-CD28 (M-20), goat polyclonal anti–PD-1 (E-18) (Santa Cruz Biotechnology, Inc.); rabbit polyclonal anti-pPLCγ1 (Tyr783), anti-pVav (Tyr174), anti-pErk (Thr202 and Tyr204; Cell Signaling Technology); anti-phosphotyrosine (4G10), rabbit polyclonal anti-PLCγ1, mouse polyclonal anti-Vav (Millipore); anti-Flag (M2) and anti-actin (AC-40; Sigma-Aldrich); anti-GFP (7.1 and 13.1; Roche); rabbit polyclonal anti-Erk (Promega); and HRP-labeled anti-GFP (Miltenyi Biotec). PMA was purchased from Sigma-Aldrich, and ionomycin and PP2 from EMD. Anti–mPD-L1 (MIH5) was previously described (Tsushima et al., 2003). B cell hybridomas producing anti-mCD3ε (145-2C11) and anti–mCTLA-4 (UC10.4F10.11) were provided by J. Bluestone (University of California, San Francisco, CA); anti-mCD28 (PV-1) by R. Abe (Science University of Tokyo, Tokyo, Japan); anti–mTCR-β (H57-597) by R.T. Kubo (Cytel Corp., San Diego, CA); anti–H-2Kb (20–8-4) by N. Shinohara (Kitasato University, Tokyo, Japan); and anti–I-Ek (14–4-4), anti-mCD80 (16-10A1), anti–mICAM-1 (YN1/1.7.4), and anti–I-Ek in complex with MCC88-103 (D4; Reay et al., 2000) by M.L. Dustin (New York University, New York, NY). H57 was digested with immobilized papain and the Fab fragment was confirmed by SDS-PAGE (Takara Bio Inc.). The fluorescent tags DyLight 488 and 649 were conjugated to antibodies with DyLight labeling kits (Thermo Fisher Scientific). Mice and cells. AND-Tg mice on a Rag2 −/− background were provided by R.N. Germain (National Institutes of Health, Bethesda, MD); OT-I-Tg Rag2−/− mice by W. Heath (University of Melbourne, Melbourne, Australia); Pdcd1−/− mice by T. Honjo (Kyoto University, Kyoto, Japan) via RIKEN BRC. B10.BR was purchased from Japan SLC Inc. The DC line (DC-1) was provided by J. Kaye (Cedars-Sinai Medical Center, Los Angeles, CA). The T cell hybridoma expressing AND-TCR was established previously (Yokosuka et al., 2008). Plasmid construction. WT or mutant mPD-1-EGFP, EYFP, YPet, or Flag, mPD-L1-EGFP, mPD-L2-EGFP, mCD28-ECFP, mPKC-θ–EYFP, CyPet-mSHP1, or CyPet-mSHP2 were generated by PCR and subcloned into the retroviral vector pMXs (provided by T. Kitamura, Tokyo University, Tokyo, Japan). Fluorescent tags were attached to the C terminus of the targeted proteins with an XhoI site and a polyglycine linker (LESGGGGSGGGG), with an XhoI site, a polyglycine-alanine linker, and a SpeI site (LEGGGAAGGGAATS) in YPet or attached to the N terminus with a polyglycine linker and an XhoI site (SGGGGSGGGGLE) or with an MluI site, a polyglycine-alanine linker, and an XhoI site (TRGGGAAGGGAALE) in CyPet. Mutant mPD-1 was generated by QuikChange II Site-Directed Mutagenesis kit (Agilent Technologies). For the mPD-L1–GPI and H-2Kb–GPI fusion construct, the extracellular region of mPD-L1 (1–237) and H-2Kb (1–305) was directly combined with the GPI motif at the 5′ terminus of hCD55 (340–382) and hCD55 (335–382), respectively. For mPD-1–hCD22/hCD4–mPD-1–EGFP chimeras, the stalk and transmembrane regions (146–190) in mPD-1–EGFP were replaced by second to sixth (Igx5, 236–708), third to sixth (Igx4, 327–708), fifth to sixth (Igx2, 505–708), or sixth (Igx1, 593–708) Ig C domains, stalk, and transmembrane regions of hCD22 or by the stalk and transmembrane regions of hCD4 (Igx0, 375–418) with BamHI at the 5′ terminus and EcoRI sites at the 3′ terminus. For mPD-1-Flag, -mSHP1, or -mSHP2 chimeras, Flag, mSHP1, or mSHP2 was directly attached to the C terminus of the PD-1 at an XhoI site without the first Met. Primary cell culture and transduction. Expression constructs were transiently transduced into Phoenix packaging cells (provided by G. Nolan, Stanford University, Stanford, CA) using Lipofectamine 2000 (Invitrogen). Retroviral supernatants were concentrated 10-fold by centrifugation at 8,000 g for 12 h. CD4+ T cells were purified from AND-Tg mice in Rag2 −/− or Rag2 −/− Pdcd1 −/− background and stimulated with 5 µM MCC88-103 (ANERADLIAYLKQATK) and irradiated spleen cells from B10.BR mice or Dynabeads mouse T-activator CD3/CD28 (Invitrogen). 1 d after stimulation, the cells were suspended in retroviral supernatant with 10 µg/ml polybrene (Sigma-Aldrich) and 200 U/ml human recombinant IL-2 (Ajinomoto) and centrifuged at 1,000 g for 90 min at 37°C. On day 2 or later, the cells were sorted by FACSAria (BD) to obtain populations with homogeneous fluorescence intensity, and then were maintained in RPMI1640 medium containing 10% FCS and recombinant IL-2. Confocal microscopic imaging. The cells expressing the proteins tagged with various fluorescent proteins or stained by fluorescent-labeled H57 Fab were allowed to settle onto a bilayer and visualized by confocal microscopy (SP5; Leica). For intracellular immunofluorescent staining, the cells on a planar bilayer were fixed with 4% paraformaldehyde for 10 min at room temperature, permeabilized with PBS containing 1% bovine serum albumin (staining buffer) and 0.05% Triton X-100 for 1 min, and stained with the indicated antibodies in staining buffer for 30 min at room temperature. All images were analyzed by Leica confocal software. TIRF microscopic imaging. A microscope (IX81; Olympus) with a TIRF objective lens (UAPON 100XOTIRF, 1.49 NA; Olympus) with dual excitation lasers: Ar 20-mW 488-nm laser and DPSS 20-mW 561-nm laser, connected to a charge-coupled device camera (Cool SNAP HG; Roper Scientific) were used. Images were taken every 2.5 s. Planar bilayers. The purification and fluorescent labeling of GPI-anchored proteins have been described previously (Grakoui et al., 1999). CHO cells highly expressing mPD-L1–GPI or H-2Kb–GPI were established. mPD-L1–GPI and H-2Kb–GPI was purified from the lysates by affinity column with MIH5 and 20–8-4, respectively. mPD-L1 was labeled with Cy5 mono NHS ester (GE Healthcare). The expression level of each GPI-anchored protein on the planar bilayer was quantified using silica beads of 5 µm diameter (Bangs Laboratories). The silica beads were loaded by DOPC containing the GPI-anchored proteins at the same concentrations as those on the planar bilayer, stained with FITC-labeled antibodies, and analyzed with the FACSCalibur (BD). The densities were calculated based on the standard beads, Quantum FITC-5 MESF (Bangs Laboratories), and adjusted to the approximate concentration by comparison with natural APCs: I-Ek, 250 molecules/µm2; H-2Kb, 200 molecules/µm2, mICAM-1, 100/µm2; mCD80, 80–150/µm2; and mPD-L1, 150/µm2. The planar bilayers were loaded with 10 µM MCC88-103 or 6 µM OVA257-264 in citrate buffer, pH 4.5, for 24 h at 37°C, blocked with 5% nonfat dried milk in PBS for 1 h at 37°C, and left to stand in the assay medium (Hepes-buffered saline) containing 1% FCS, 2 mM MgCl2, and 1 mM CaCl2. FRET analysis. The 405-nm-excited 430–500 nm, 405-nm-excited 500–590 nm, and 488-nm-excited 500–590 nm images were taken at 12-bit resolution for the ECFP, FRET-containing, and YPet images. FRET images were obtained by subtracting 405-nm-excited leaked ECFP (500–590 nm) and 405-nm–directly excited YPet (500–590 nm) from the FRET-containing image. AND-TCR T cell hybridomas expressing PD-1–Ypet and EGFP-SHP1 or SHP2 showed sufficiently strong FRET intensity and the cells expressing single fluorescence were used for control study. FRET efficiency values presented as a pseudo-color scale by ImageJ (National Institute of Health). Image processing and data analysis. The size and fluorescence intensity of each region were examined in all images and measured by ImageJ. Fold intensity, presented as a histogram, was calculated as ([intensity of fluorescence at each spot on a diagram] − [minimal intensity of each fluorescence on the entire line])/([mean intensity of each fluorescence on the entire line] − [minimal intensity of each fluorescence along the entire line]). Significant differences were evaluated by the Student’s t test with KaleidaGraph (Synergy Software). T cell–APC conjugation assay. DC-1 cells were prepulsed with 5 µM MCC88-103 overnight at 37°C. 105 AND-TCR T cell hybridomas expressing mPD-1–YPet and CyPet-mSHP1 or -mSHP2 were cultured with 105 DC-1 cells expressing or not expressing PD-L1 or PD-L2. The conjugates were visualized by confocal microscopy. The fluorescence of 4G10 staining at the entire interface was measured with ImageJ. Percent intensity of phosphotyrosine at the interface = ([Mean intensity of fluorescence at the interface] − [intensity of background fluorescence]) × [area of the interface]/([mean intensity of fluorescence at the entire T cell area] − [intensity of background fluorescence]) × [area of the entire T cell area]. Western blotting. DC-1 cells were prepulsed with 5 µM MCC88-103 overnight at 37°C and washed before the assay. 2–5 × 10⁶ AND-TCR T cell hybridomas expressing WT or mutant mPD-1 or mPD-1 chimeras (mPD-1-Flag, -EGFP, -mSHP1, or -mSHP2) were stimulated with 1–2.5 × 10⁶ DC-1 cells not transduced or transduced with mPD-L1 or mPD-L2. The cells were lysed with lysis buffer (50 mM Tris-HCl, 50 mM NaCl, and 5 mM EDTA) containing 1% NP-40 or digitonin and immunoprecipitated with anti–PD-1, anti-Flag, anti-GFP, or anti-mCD28. The immunoprecipitated and WCLs were blotted with anti–PD-1, anti-SHP1, anti-SHP2, anti-CD28, anti–PKC-θ, anti-Vav, anti-pVav, anti-PLCγ1, anti-pPLCγ1, anti-Erk, anti-pErk, anti-Flag, or anti-GFP. T cell stimulation assay. 2–4 × 10⁴ AND-TCR T cell hybridomas were stimulated with 1–2 × 10⁴ DC-1 cells with MCC88-103 at the indicated concentrations or with immobilized 10 µg/ml anti-mCD3ε and 10 µg/ml anti-mCTLA-4. 4 × 10⁴ AND-Tg primary T cells were stimulated with 2 × 10⁴ DC-1 cells with MCC88-103. For the control studies, the cells were stimulated with immobilized 10 µg/ml anti-mCD3ε and 5 µg/ml anti-mCD28 or with 0.5 ng/ml PMA plus 0.5 µM ionomycin. Concentration of IL-2 was measured by ELISA at 12–16 h after stimulation. Cell number was measured by the Cell Counting kit (Dojindo) and shown by absorbance at OD450. Online supplemental material Video 1 shows that PD-1 forms clusters by PD-1–PD-L1 binding. Online supplemental material is available at http://www.jem.org/cgi/content/full/jem.20112741/DC1. Supplementary Material Supplemental Material