6
views
0
recommends
+1 Recommend
0 collections
    0
    shares
      • Record: found
      • Abstract: found
      • Article: found
      Is Open Access

      Multimodal deep learning from satellite and street-level imagery for measuring income, overcrowding, and environmental deprivation in urban areas

      research-article

      Read this article at

      Bookmark
          There is no author summary for this article yet. Authors can add summaries to their articles on ScienceOpen to make them more accessible to a non-specialist audience.

          Abstract

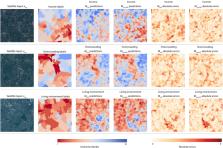
          Data collected at large scale and low cost (e.g. satellite and street level imagery) have the potential to substantially improve resolution, spatial coverage, and temporal frequency of measurement of urban inequalities. Multiple types of data from different sources are often available for a given geographic area. Yet, most studies utilize a single type of input data when making measurements due to methodological difficulties in their joint use. We propose two deep learning-based methods for jointly utilizing satellite and street level imagery for measuring urban inequalities. We use London as a case study for three selected outputs, each measured in decile classes: income, overcrowding, and environmental deprivation. We compare the performances of our proposed multimodal models to corresponding unimodal ones using mean absolute error (MAE). First, satellite tiles are appended to street level imagery to enhance predictions at locations where street images are available leading to improvements in accuracy by 20, 10, and 9% in units of decile classes for income, overcrowding, and living environment. The second approach, novel to the best of our knowledge, uses a U-Net architecture to make predictions for all grid cells in a city at high spatial resolution (e.g. for 3 m × 3 m pixels in London in our experiments). It can utilize city wide availability of satellite images as well as more sparse information from street-level images where they are available leading to improvements in accuracy by 6, 10, and 11%. We also show examples of prediction maps from both approaches to visually highlight performance differences.

          Graphical abstract

          Highlights

          • Our model utilizes information from street-level and satellite images.

          • Proposed multimodal measurement approaches outperform unimodal ones.

          • The model can deal with missing data during training and predictions.

          • Multimodal frameworks can incorporate additional modalities (e.g. aerial images).

          • Applications can be expanded to different outcomes.

          Related collections

          Most cited references62

          • Record: found
          • Abstract: not found
          • Article: not found

          ImageNet Large Scale Visual Recognition Challenge

            Bookmark
            • Record: found
            • Abstract: found
            • Article: not found

            Combining satellite imagery and machine learning to predict poverty

            Reliable data on economic livelihoods remain scarce in the developing world, hampering efforts to study these outcomes and to design policies that improve them. Here we demonstrate an accurate, inexpensive, and scalable method for estimating consumption expenditure and asset wealth from high-resolution satellite imagery. Using survey and satellite data from five African countries--Nigeria, Tanzania, Uganda, Malawi, and Rwanda--we show how a convolutional neural network can be trained to identify image features that can explain up to 75% of the variation in local-level economic outcomes. Our method, which requires only publicly available data, could transform efforts to track and target poverty in developing countries. It also demonstrates how powerful machine learning techniques can be applied in a setting with limited training data, suggesting broad potential application across many scientific domains.
              Bookmark
              • Record: found
              • Abstract: found
              • Article: not found

              High-Resolution Air Pollution Mapping with Google Street View Cars: Exploiting Big Data.

              Air pollution affects billions of people worldwide, yet ambient pollution measurements are limited for much of the world. Urban air pollution concentrations vary sharply over short distances (≪1 km) owing to unevenly distributed emission sources, dilution, and physicochemical transformations. Accordingly, even where present, conventional fixed-site pollution monitoring methods lack the spatial resolution needed to characterize heterogeneous human exposures and localized pollution hotspots. Here, we demonstrate a measurement approach to reveal urban air pollution patterns at 4-5 orders of magnitude greater spatial precision than possible with current central-site ambient monitoring. We equipped Google Street View vehicles with a fast-response pollution measurement platform and repeatedly sampled every street in a 30-km(2) area of Oakland, CA, developing the largest urban air quality data set of its type. Resulting maps of annual daytime NO, NO2, and black carbon at 30 m-scale reveal stable, persistent pollution patterns with surprisingly sharp small-scale variability attributable to local sources, up to 5-8× within individual city blocks. Since local variation in air quality profoundly impacts public health and environmental equity, our results have important implications for how air pollution is measured and managed. If validated elsewhere, this readily scalable measurement approach could address major air quality data gaps worldwide.
                Bookmark

                Author and article information

                Contributors
                Journal
                Remote Sens Environ
                Remote Sens Environ
                Remote Sensing of Environment
                American Elsevier Pub. Co
                0034-4257
                1879-0704
                1 May 2021
                May 2021
                : 257
                : 112339
                Affiliations
                [a ]MRC Centre for Environment and Health, School of Public Health, Imperial College London, London, UK
                [b ]Swiss Data Science Center, ETH Zurich and EPFL, Switzerland
                [c ]MRC Centre for Global Infectious Disease Analysis, School of Public Health, Imperial College London, London, UK
                [d ]Section of Epidemiology, Department of Public Health, University of Copenhagen, Denmark
                [e ]Abdul Latif Jameel Institute for Disease and Emergency Analytics, Imperial College London, London, UK
                [f ]School of Population and Public Health, University of British Columbia, Vancouver, British Columbia, Canada
                [g ]Institute for Health Metrics & Evaluation, University of Washington, Seattle, WA, USA
                [h ]Department of Mathematics, Imperial College London, London, UK
                [i ]Regional Institute for Population Studies, University of Ghana, Accra, Ghana
                Author notes
                [* ]Corresponding author at: MRC Centre for Environment and Health, School of Public Health, Imperial College London, London, UK. esra.suel@ 123456imperial.ac.uk
                Article
                S0034-4257(21)00057-2 112339
                10.1016/j.rse.2021.112339
                7985619
                33941991
                6587c301-070d-4b47-a52f-b108bf6fbfa1
                © 2021 The Author(s)

                This is an open access article under the CC BY license (http://creativecommons.org/licenses/by/4.0/).

                History
                : 24 June 2020
                : 25 January 2021
                : 1 February 2021
                Categories
                Article

                convolutional neural networks,segmentation,urban measurements,satellite images,street-level images

                Comments

                Comment on this article