10
views
0
recommends
+1 Recommend
0 collections
    0
    shares
      • Record: found
      • Abstract: found
      • Article: found
      Is Open Access

      Measuring contraceptive method mix, prevalence, and demand satisfied by age and marital status in 204 countries and territories, 1970–2019: a systematic analysis for the Global Burden of Disease Study 2019

      research-article

      Read this article at

      Bookmark
          There is no author summary for this article yet. Authors can add summaries to their articles on ScienceOpen to make them more accessible to a non-specialist audience.

          Summary

          Background

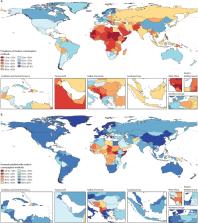
          Meeting the contraceptive needs of women of reproductive age is beneficial for the health of women and children, and the economic and social empowerment of women. Higher rates of contraceptive coverage have been linked to the availability of a more diverse range of contraceptive methods. We present estimates of the contraceptive prevalence rate (CPR), modern contraceptive prevalence rate (mCPR), demand satisfied, and the method of contraception used for both partnered and unpartnered women for 5-year age groups in 204 countries and territories between 1970 and 2019.

          Methods

          We used 1162 population-based surveys capturing contraceptive use among women between 1970 and 2019, in which women of reproductive age (15–49 years) self-reported their, or their partner's, current use of contraception for family planning purposes. Spatiotemporal Gaussian process regression was used to generate estimates of the CPR, mCPR, demand satisfied, and method mix by age and marital status. We assessed how age-specific mCPR and demand satisfied changed with the Socio-demographic Index (SDI), a measure of social and economic development, using the meta-regression Bayesian, regularised, trimmed method from the Global Burden of Diseases, Injuries, and Risk Factors Study.

          Findings

          In 2019, 162·9 million (95% uncertainty interval [UI] 155·6–170·2) women had unmet need for contraception, of whom 29·3% (27·9–30·6) resided in sub-Saharan Africa and 27·2% (24·4–30·3) resided in south Asia. Women aged 15–19 years (64·8% [62·9–66·7]) and 20–24 years (71·9% [68·9–74·2]) had the lowest rates of demand satisfied, with 43·2 million (95% UI 39·3–48·0) women aged 15–24 years with unmet need in 2019. The mCPR and demand satisfied among women aged 15–19 years were substantially lower than among women aged 20–49 years at SDI values below 60 (on a 0–100 scale), but began to equalise as SDI increased above 60. Between 1970 and 2019, the global mCPR increased by 20·1 percentage points (95% UI 18·7–21·6). During this time, traditional methods declined as a proportion of all contraceptive methods, whereas the use of implants, injections, female sterilisation, and condoms increased. Method mix differs substantially depending on age and geography, with the share of female sterilisation increasing with age and comprising more than 50% of methods in use in south Asia. In 28 countries, one method was used by more than 50% of users in 2019.

          Interpretation

          The dominance of one contraceptive method in some locations raises the question of whether family planning policies should aim to expand method mix or invest in making existing methods more accessible. Lower rates of demand satisfied among women aged 15–24 years are also concerning because unintended pregnancies before age 25 years can forestall or eliminate education and employment opportunities that lead to social and economic empowerment. Policy makers should strive to tailor family planning programmes to the preferences of the groups with the most need, while maintaining the programmes used by existing users.

          Funding

          Bill & Melinda Gates Foundation.

          Related collections

          Most cited references48

          • Record: found
          • Abstract: found
          • Article: found
          Is Open Access

          Global burden of 369 diseases and injuries in 204 countries and territories, 1990–2019: a systematic analysis for the Global Burden of Disease Study 2019

          Summary Background In an era of shifting global agendas and expanded emphasis on non-communicable diseases and injuries along with communicable diseases, sound evidence on trends by cause at the national level is essential. The Global Burden of Diseases, Injuries, and Risk Factors Study (GBD) provides a systematic scientific assessment of published, publicly available, and contributed data on incidence, prevalence, and mortality for a mutually exclusive and collectively exhaustive list of diseases and injuries. Methods GBD estimates incidence, prevalence, mortality, years of life lost (YLLs), years lived with disability (YLDs), and disability-adjusted life-years (DALYs) due to 369 diseases and injuries, for two sexes, and for 204 countries and territories. Input data were extracted from censuses, household surveys, civil registration and vital statistics, disease registries, health service use, air pollution monitors, satellite imaging, disease notifications, and other sources. Cause-specific death rates and cause fractions were calculated using the Cause of Death Ensemble model and spatiotemporal Gaussian process regression. Cause-specific deaths were adjusted to match the total all-cause deaths calculated as part of the GBD population, fertility, and mortality estimates. Deaths were multiplied by standard life expectancy at each age to calculate YLLs. A Bayesian meta-regression modelling tool, DisMod-MR 2.1, was used to ensure consistency between incidence, prevalence, remission, excess mortality, and cause-specific mortality for most causes. Prevalence estimates were multiplied by disability weights for mutually exclusive sequelae of diseases and injuries to calculate YLDs. We considered results in the context of the Socio-demographic Index (SDI), a composite indicator of income per capita, years of schooling, and fertility rate in females younger than 25 years. Uncertainty intervals (UIs) were generated for every metric using the 25th and 975th ordered 1000 draw values of the posterior distribution. Findings Global health has steadily improved over the past 30 years as measured by age-standardised DALY rates. After taking into account population growth and ageing, the absolute number of DALYs has remained stable. Since 2010, the pace of decline in global age-standardised DALY rates has accelerated in age groups younger than 50 years compared with the 1990–2010 time period, with the greatest annualised rate of decline occurring in the 0–9-year age group. Six infectious diseases were among the top ten causes of DALYs in children younger than 10 years in 2019: lower respiratory infections (ranked second), diarrhoeal diseases (third), malaria (fifth), meningitis (sixth), whooping cough (ninth), and sexually transmitted infections (which, in this age group, is fully accounted for by congenital syphilis; ranked tenth). In adolescents aged 10–24 years, three injury causes were among the top causes of DALYs: road injuries (ranked first), self-harm (third), and interpersonal violence (fifth). Five of the causes that were in the top ten for ages 10–24 years were also in the top ten in the 25–49-year age group: road injuries (ranked first), HIV/AIDS (second), low back pain (fourth), headache disorders (fifth), and depressive disorders (sixth). In 2019, ischaemic heart disease and stroke were the top-ranked causes of DALYs in both the 50–74-year and 75-years-and-older age groups. Since 1990, there has been a marked shift towards a greater proportion of burden due to YLDs from non-communicable diseases and injuries. In 2019, there were 11 countries where non-communicable disease and injury YLDs constituted more than half of all disease burden. Decreases in age-standardised DALY rates have accelerated over the past decade in countries at the lower end of the SDI range, while improvements have started to stagnate or even reverse in countries with higher SDI. Interpretation As disability becomes an increasingly large component of disease burden and a larger component of health expenditure, greater research and development investment is needed to identify new, more effective intervention strategies. With a rapidly ageing global population, the demands on health services to deal with disabling outcomes, which increase with age, will require policy makers to anticipate these changes. The mix of universal and more geographically specific influences on health reinforces the need for regular reporting on population health in detail and by underlying cause to help decision makers to identify success stories of disease control to emulate, as well as opportunities to improve. Funding Bill & Melinda Gates Foundation.
            Bookmark
            • Record: found
            • Abstract: found
            • Article: found
            Is Open Access

            Global age-sex-specific fertility, mortality, healthy life expectancy (HALE), and population estimates in 204 countries and territories, 1950–2019: a comprehensive demographic analysis for the Global Burden of Disease Study 2019

            Summary Background Accurate and up-to-date assessment of demographic metrics is crucial for understanding a wide range of social, economic, and public health issues that affect populations worldwide. The Global Burden of Diseases, Injuries, and Risk Factors Study (GBD) 2019 produced updated and comprehensive demographic assessments of the key indicators of fertility, mortality, migration, and population for 204 countries and territories and selected subnational locations from 1950 to 2019. Methods 8078 country-years of vital registration and sample registration data, 938 surveys, 349 censuses, and 238 other sources were identified and used to estimate age-specific fertility. Spatiotemporal Gaussian process regression (ST-GPR) was used to generate age-specific fertility rates for 5-year age groups between ages 15 and 49 years. With extensions to age groups 10–14 and 50–54 years, the total fertility rate (TFR) was then aggregated using the estimated age-specific fertility between ages 10 and 54 years. 7417 sources were used for under-5 mortality estimation and 7355 for adult mortality. ST-GPR was used to synthesise data sources after correction for known biases. Adult mortality was measured as the probability of death between ages 15 and 60 years based on vital registration, sample registration, and sibling histories, and was also estimated using ST-GPR. HIV-free life tables were then estimated using estimates of under-5 and adult mortality rates using a relational model life table system created for GBD, which closely tracks observed age-specific mortality rates from complete vital registration when available. Independent estimates of HIV-specific mortality generated by an epidemiological analysis of HIV prevalence surveys and antenatal clinic serosurveillance and other sources were incorporated into the estimates in countries with large epidemics. Annual and single-year age estimates of net migration and population for each country and territory were generated using a Bayesian hierarchical cohort component model that analysed estimated age-specific fertility and mortality rates along with 1250 censuses and 747 population registry years. We classified location-years into seven categories on the basis of the natural rate of increase in population (calculated by subtracting the crude death rate from the crude birth rate) and the net migration rate. We computed healthy life expectancy (HALE) using years lived with disability (YLDs) per capita, life tables, and standard demographic methods. Uncertainty was propagated throughout the demographic estimation process, including fertility, mortality, and population, with 1000 draw-level estimates produced for each metric. Findings The global TFR decreased from 2·72 (95% uncertainty interval [UI] 2·66–2·79) in 2000 to 2·31 (2·17–2·46) in 2019. Global annual livebirths increased from 134·5 million (131·5–137·8) in 2000 to a peak of 139·6 million (133·0–146·9) in 2016. Global livebirths then declined to 135·3 million (127·2–144·1) in 2019. Of the 204 countries and territories included in this study, in 2019, 102 had a TFR lower than 2·1, which is considered a good approximation of replacement-level fertility. All countries in sub-Saharan Africa had TFRs above replacement level in 2019 and accounted for 27·1% (95% UI 26·4–27·8) of global livebirths. Global life expectancy at birth increased from 67·2 years (95% UI 66·8–67·6) in 2000 to 73·5 years (72·8–74·3) in 2019. The total number of deaths increased from 50·7 million (49·5–51·9) in 2000 to 56·5 million (53·7–59·2) in 2019. Under-5 deaths declined from 9·6 million (9·1–10·3) in 2000 to 5·0 million (4·3–6·0) in 2019. Global population increased by 25·7%, from 6·2 billion (6·0–6·3) in 2000 to 7·7 billion (7·5–8·0) in 2019. In 2019, 34 countries had negative natural rates of increase; in 17 of these, the population declined because immigration was not sufficient to counteract the negative rate of decline. Globally, HALE increased from 58·6 years (56·1–60·8) in 2000 to 63·5 years (60·8–66·1) in 2019. HALE increased in 202 of 204 countries and territories between 2000 and 2019. Interpretation Over the past 20 years, fertility rates have been dropping steadily and life expectancy has been increasing, with few exceptions. Much of this change follows historical patterns linking social and economic determinants, such as those captured by the GBD Socio-demographic Index, with demographic outcomes. More recently, several countries have experienced a combination of low fertility and stagnating improvement in mortality rates, pushing more populations into the late stages of the demographic transition. Tracking demographic change and the emergence of new patterns will be essential for global health monitoring. Funding Bill & Melinda Gates Foundation.
              Bookmark
              • Record: found
              • Abstract: found
              • Article: not found
              Is Open Access

              Guidelines for Accurate and Transparent Health Estimates Reporting: the GATHER statement

              Measurements of health indicators are rarely available for every population and period of interest, and available data may not be comparable. The Guidelines for Accurate and Transparent Health Estimates Reporting (GATHER) define best reporting practices for studies that calculate health estimates for multiple populations (in time or space) using multiple information sources. Health estimates that fall within the scope of GATHER include all quantitative population-level estimates (including global, regional, national, or subnational estimates) of health indicators, including indicators of health status, incidence and prevalence of diseases, injuries, and disability and functioning; and indicators of health determinants, including health behaviours and health exposures. GATHER comprises a checklist of 18 items that are essential for best reporting practice. A more detailed explanation and elaboration document, describing the interpretation and rationale of each reporting item along with examples of good reporting, is available on the GATHER website.
                Bookmark

                Author and article information

                Contributors
                Journal
                Lancet
                Lancet
                Lancet (London, England)
                Elsevier
                0140-6736
                1474-547X
                23 July 2022
                23 July 2022
                : 400
                : 10348
                : 295-327
                Affiliations
                [a ]Institute for Health Metrics and Evaluation, University of Washington, Seattle, WA, USA
                [b ]Department of Health Metrics Sciences, University of Washington, Seattle, WA, USA
                [c ]Centre for Global Child Health, University of Toronto, Toronto, ON, Canada
                [d ]Centre of Excellence in Women and Child Health, Aga Khan University, Karachi, Pakistan
                [e ]Swedish Family Medicine, First Hill, Seattle, WA, USA
                Author notes
                [* ]Correspondence to: Prof Rafael Lozano, Institute for Health Metrics and Evaluation, University of Washington, Seattle, WA 98195, USA rlozano@ 123456uw.edu
                Article
                S0140-6736(22)00936-9
                10.1016/S0140-6736(22)00936-9
                9304984
                35871816
                57abbd89-ff8c-4dab-8ddb-32afbeac3d34
                © 2022 The Author(s). Published by Elsevier Ltd. This is an Open Access article under the CC BY 4.0 license

                This is an open access article under the CC BY license (http://creativecommons.org/licenses/by/4.0/).

                History
                Categories
                Articles

                Medicine
                Medicine

                Comments

                Comment on this article