53
views
0
recommends
+1 Recommend
1 collections
    0
    shares
      • Record: found
      • Abstract: found
      • Article: found
      Is Open Access

      Association of Social and Demographic Factors With COVID-19 Incidence and Death Rates in the US

      research-article
      , PhD, MS 1 , , PhD, MS 2 , 3 , 4 , , MD, MSc 1 , 4 ,
      JAMA Network Open
      American Medical Association

      Read this article at

      Bookmark
          There is no author summary for this article yet. Authors can add summaries to their articles on ScienceOpen to make them more accessible to a non-specialist audience.

          Key Points

          Question

          Are population-level social factors associated with coronavirus disease 2019 (COVID-19) incidence and mortality?

          Findings

          In this cross-sectional study including 4 289 283 COVID-19 cases and 147 074 COVID-19 deaths, county-level sociodemographic risk factors as assessed by the Social Vulnerability Index were associated with greater COVID-19 incidence and mortality.

          Meaning

          These findings suggest that to address inequities in the burden of the COVID-19 pandemic, these sociodemographic risk factors and their root causes must be addressed.

          Abstract

          This cross-sectional study examines the county-level associations of sociodemographic risk factors with coronavirus disease 2019 incidence and mortality in the US.

          Abstract

          Importance

          Descriptive data have revealed significant racial/ethnic disparities in coronavirus disease 2019 (COVID-19) cases in the US, but underlying mechanisms of disparities remain unknown.

          Objective

          To examine the association between county-level sociodemographic risk factors and US COVID-19 incidence and mortality.

          Design, Setting, and Participants

          This cross-sectional study analyzed the association between US county-level sociodemographic risk factors and COVID-19 incidence using mixed-effects negative binomial regression, and COVID-19 mortality using zero-inflated negative binomial regression. Data on COVID-19 incidence and mortality were collected from January 20 to July 29, 2020. The association of social risk factors with weekly cumulative incidence and mortality was also examined by interacting time with the index measures, using a random intercept to account for repeated measures.

          Main Outcomes and Measures

          Sociodemographic data from publicly available data sets, including the US Centers for Disease Control and Prevention’s Social Vulnerability Index (SVI), which includes subindices of socioeconomic status, household composition and disability, racial/ethnic minority and English language proficiency status, and housing and transportation.

          Results

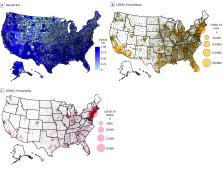
          As of July 29, 2020, there were a total of 4 289 283 COVID-19 cases and 147 074 COVID-19 deaths in the US. An increase of 0.1 point in SVI score was associated with a 14.3% increase in incidence rate (incidence rate ratio [IRR], 1.14; 95% CI, 1.13-1.16; P < .001) and 13.7% increase in mortality rate (IRR, 1.14; 95% CI, 1.12-1.16; P < .001), or an excess of 87 COVID-19 cases and 3 COVID-19 deaths per 100 000 population for a SVI score change from 0.5 to 0.6 in a midsize metropolitan county; subindices were also associated with both outcomes. A 0.1-point increase in the overall SVI was associated with a 0.9% increase in weekly cumulative increase in incidence rate (IRR, 1.01; 95% CI, 1.01-1.01; P < .001) and 0.5% increase in mortality rate (IRR, 1.01; 95% CI, 1.01-1.01; P < .001).

          Conclusions and Relevance

          In this cross-sectional study, a wide range of sociodemographic risk factors, including socioeconomic status, racial/ethnic minority status, household composition, and environmental factors, were significantly associated with COVID-19 incidence and mortality. To address inequities in the burden of the COVID-19 pandemic, these social vulnerabilities and their root causes must be addressed.

          Related collections

          Most cited references26

          • Record: found
          • Abstract: found
          • Article: not found

          An interactive web-based dashboard to track COVID-19 in real time

          In December, 2019, a local outbreak of pneumonia of initially unknown cause was detected in Wuhan (Hubei, China), and was quickly determined to be caused by a novel coronavirus, 1 namely severe acute respiratory syndrome coronavirus 2 (SARS-CoV-2). The outbreak has since spread to every province of mainland China as well as 27 other countries and regions, with more than 70 000 confirmed cases as of Feb 17, 2020. 2 In response to this ongoing public health emergency, we developed an online interactive dashboard, hosted by the Center for Systems Science and Engineering (CSSE) at Johns Hopkins University, Baltimore, MD, USA, to visualise and track reported cases of coronavirus disease 2019 (COVID-19) in real time. The dashboard, first shared publicly on Jan 22, illustrates the location and number of confirmed COVID-19 cases, deaths, and recoveries for all affected countries. It was developed to provide researchers, public health authorities, and the general public with a user-friendly tool to track the outbreak as it unfolds. All data collected and displayed are made freely available, initially through Google Sheets and now through a GitHub repository, along with the feature layers of the dashboard, which are now included in the Esri Living Atlas. The dashboard reports cases at the province level in China; at the city level in the USA, Australia, and Canada; and at the country level otherwise. During Jan 22–31, all data collection and processing were done manually, and updates were typically done twice a day, morning and night (US Eastern Time). As the outbreak evolved, the manual reporting process became unsustainable; therefore, on Feb 1, we adopted a semi-automated living data stream strategy. Our primary data source is DXY, an online platform run by members of the Chinese medical community, which aggregates local media and government reports to provide cumulative totals of COVID-19 cases in near real time at the province level in China and at the country level otherwise. Every 15 min, the cumulative case counts are updated from DXY for all provinces in China and for other affected countries and regions. For countries and regions outside mainland China (including Hong Kong, Macau, and Taiwan), we found DXY cumulative case counts to frequently lag behind other sources; we therefore manually update these case numbers throughout the day when new cases are identified. To identify new cases, we monitor various Twitter feeds, online news services, and direct communication sent through the dashboard. Before manually updating the dashboard, we confirm the case numbers with regional and local health departments, including the respective centres for disease control and prevention (CDC) of China, Taiwan, and Europe, the Hong Kong Department of Health, the Macau Government, and WHO, as well as city-level and state-level health authorities. For city-level case reports in the USA, Australia, and Canada, which we began reporting on Feb 1, we rely on the US CDC, the government of Canada, the Australian Government Department of Health, and various state or territory health authorities. All manual updates (for countries and regions outside mainland China) are coordinated by a team at Johns Hopkins University. The case data reported on the dashboard aligns with the daily Chinese CDC 3 and WHO situation reports 2 for within and outside of mainland China, respectively (figure ). Furthermore, the dashboard is particularly effective at capturing the timing of the first reported case of COVID-19 in new countries or regions (appendix). With the exception of Australia, Hong Kong, and Italy, the CSSE at Johns Hopkins University has reported newly infected countries ahead of WHO, with Hong Kong and Italy reported within hours of the corresponding WHO situation report. Figure Comparison of COVID-19 case reporting from different sources Daily cumulative case numbers (starting Jan 22, 2020) reported by the Johns Hopkins University Center for Systems Science and Engineering (CSSE), WHO situation reports, and the Chinese Center for Disease Control and Prevention (Chinese CDC) for within (A) and outside (B) mainland China. Given the popularity and impact of the dashboard to date, we plan to continue hosting and managing the tool throughout the entirety of the COVID-19 outbreak and to build out its capabilities to establish a standing tool to monitor and report on future outbreaks. We believe our efforts are crucial to help inform modelling efforts and control measures during the earliest stages of the outbreak.
            Bookmark
            • Record: found
            • Abstract: found
            • Article: not found

            Prevalence of comorbidities and its effects in patients infected with SARS-CoV-2: a systematic review and meta-analysis

            Highlights • COVID -19 cases are now confirmed in multiple countries. • Assessed the prevalence of comorbidities in infected patients. • Comorbidities are risk factors for severe compared with non-severe patients. • Help the health sector guide vulnerable populations and assess the risk of deterioration.
              Bookmark
              • Record: found
              • Abstract: not found
              • Article: not found

              glmmTMB Balances Speed and Flexibility Among Packages for Zero-inflated Generalized Linear Mixed Modeling

                Bookmark

                Author and article information

                Journal
                JAMA Netw Open
                JAMA Netw Open
                JAMA Netw Open
                JAMA Network Open
                American Medical Association
                2574-3805
                29 January 2021
                January 2021
                29 January 2021
                : 4
                : 1
                : e2036462
                Affiliations
                [1 ]Division of General Medicine, Department of Internal Medicine, University of Michigan, Ann Arbor
                [2 ]Gerald R. Ford School of Public Policy, University of Michigan, Ann Arbor
                [3 ]Department of Health Management and Policy, School of Public Health, University of Michigan, Ann Arbor
                [4 ]Institute for Healthcare Policy and Innovation, University of Michigan, Ann Arbor
                Author notes
                Article Information
                Accepted for Publication: December 8, 2020.
                Published: January 29, 2021. doi:10.1001/jamanetworkopen.2020.36462
                Open Access: This is an open access article distributed under the terms of the CC-BY License. © 2021 Karmakar M et al. JAMA Network Open.
                Corresponding Author: Renuka Tipirneni, MD, MSc, Division of General Medicine, University of Michigan, Department of Internal Medicine, 2800 Plymouth Rd, Bldg 16, Room 419W, Ann Arbor, MI 48109 ( rtipirne@ 123456med.umich.edu ).
                Author Contributions: Dr Karmakar had full access to all of the data in the study and takes responsibility for the integrity of the data and the accuracy of the data analysis.
                Concept and design: All authors.
                Acquisition, analysis, or interpretation of data: All authors.
                Drafting of the manuscript: Karmakar, Tipirneni.
                Critical revision of the manuscript for important intellectual content: All authors.
                Statistical analysis: Karmakar, Lantz.
                Administrative, technical, or material support: Karmakar.
                Supervision: Karmakar, Tipirneni.
                Conflict of Interest Disclosures: Dr. Tipirneni reported receiving speaker fees from the American Neurological Association. No other disclosures were reported.
                Funding/Support: The study was supported by the Department of Internal Medicine, University of Michigan (Dr Tipirneni). Dr Tipirneni is additionally supported by a K08 Clinical Scientist Development Award from the National Institute on Aging.
                Role of the Funder/Sponsor: The funders had no role in the design and conduct of the study; collection, management, analysis, and interpretation of the data; preparation, review, or approval of the manuscript; and decision to submit the manuscript for publication.
                Article
                zoi201090
                10.1001/jamanetworkopen.2020.36462
                7846939
                33512520
                51575d2f-13b8-4fb3-8857-9c4596de0a3d
                Copyright 2021 Karmakar M et al. JAMA Network Open.

                This is an open access article distributed under the terms of the CC-BY License.

                History
                : 1 October 2020
                : 8 December 2020
                Categories
                Research
                Original Investigation
                Online Only
                Public Health

                Comments

                Comment on this article