5
views
0
recommends
+1 Recommend
0 collections
    0
    shares
      • Record: found
      • Abstract: found
      • Article: found
      Is Open Access

      A U-Shaped Relationship between the Prevalence of Frailty and Body Mass Index in Community-Dwelling Japanese Older Adults: The Kyoto–Kameoka Study

      research-article

      Read this article at

      Bookmark
          There is no author summary for this article yet. Authors can add summaries to their articles on ScienceOpen to make them more accessible to a non-specialist audience.

          Abstract

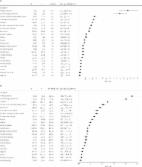
          The relationship between body mass index (BMI) and frailty remains unclear. Using two validated frailty assessment tools, this study aimed to investigate the relationship between the prevalence of frailty and BMI in Japanese older adults. This cross-sectional study used baseline data of 7191 individuals aged ≥65 years, living in Kameoka City, Kyoto, Japan. The BMI was calculated based on self-reported height and body weight, and classified into six categories. Frailty was defined using two validated assessment tools, the Fried phenotype (FP) model and Kihon Checklist (KCL). We evaluated the relationship between frailty and BMI using a multivariate restricted cubic spline logistic regression. The prevalence of frailty defined using the FP model was 25.3%, 19.6%, 14.3%, 12.4%, 12.6%, and 19.4% for each BMI category of <18.5, 18.5–19.9, 20.0–22.4, 22.5–24.9, 25.0–27.4, and ≥27.5 kg/m 2, respectively. The spline model showed a significant U-shaped relationship between BMI and the prevalence of frailty defined using both, KCL and FP models. This study found that the BMI range corresponding to lowest prevalence of frailty defined using both tools was 21.4–25.7 kg/m 2. Thus, a healthy BMI may reduce the prevalence of frailty, and the risk of frailty needs to be evaluated in individuals who are underweight or overweight.

          Related collections

          Most cited references23

          • Record: found
          • Abstract: found
          • Article: found
          Is Open Access

          Frailty and pre-frailty in middle-aged and older adults and its association with multimorbidity and mortality: a prospective analysis of 493 737 UK Biobank participants

          Summary Background Frailty is associated with older age and multimorbidity (two or more long-term conditions); however, little is known about its prevalence or effects on mortality in younger populations. This paper aims to examine the association between frailty, multimorbidity, specific long-term conditions, and mortality in a middle-aged and older aged population. Methods Data were sourced from the UK Biobank. Frailty phenotype was based on five criteria (weight loss, exhaustion, grip strength, low physical activity, slow walking pace). Participants were deemed frail if they met at least three criteria, pre-frail if they fulfilled one or two criteria, and not frail if no criteria were met. Sociodemographic characteristics and long-term conditions were examined. The outcome was all-cause mortality, which was measured at a median of 7 years follow-up. Multinomial logistic regression compared sociodemographic characteristics and long-term conditions of frail or pre-frail participants with non-frail participants. Cox proportional hazards models examined associations between frailty or pre-frailty and mortality. Results were stratified by age group (37–45, 45–55, 55–65, 65–73 years) and sex, and were adjusted for multimorbidity count, socioeconomic status, body-mass index, smoking status, and alcohol use. Findings 493 737 participants aged 37–73 years were included in the study, of whom 16 538 (3%) were considered frail, 185 360 (38%) pre-frail, and 291 839 (59%) not frail. Frailty was significantly associated with multimorbidity (prevalence 18% [4435/25 338] in those with four or more long-term conditions; odds ratio [OR] 27·1, 95% CI 25·3–29·1) socioeconomic deprivation, smoking, obesity, and infrequent alcohol consumption. The top five long-term conditions associated with frailty were multiple sclerosis (OR 15·3; 99·75% CI 12·8–18·2); chronic fatigue syndrome (12·9; 11·1–15·0); chronic obstructive pulmonary disease (5·6; 5·2–6·1); connective tissue disease (5·4; 5·0–5·8); and diabetes (5·0; 4·7–5·2). Pre-frailty and frailty were significantly associated with mortality for all age strata in men and women (except in women aged 37–45 years) after adjustment for confounders. Interpretation Efforts to identify, manage, and prevent frailty should include middle-aged individuals with multimorbidity, in whom frailty is significantly associated with mortality, even after adjustment for number of long-term conditions, sociodemographics, and lifestyle. Research, clinical guidelines, and health-care services must shift focus from single conditions to the requirements of increasingly complex patient populations. Funding CSO Catalyst Grant and National Health Service Research for Scotland Career Research Fellowship.
            Bookmark
            • Record: found
            • Abstract: found
            • Article: not found

            A comparison of two approaches to measuring frailty in elderly people.

            Many definitions of frailty exist, but few have been directly compared. We compared the relationship between a definition of frailty based on a specific phenotype with one based on an index of deficit accumulation. The data come from all 2305 people 70 years old and older who composed the clinical examination cohort of the second wave of the Canadian Study of Health and Aging. We tested convergent validity by correlating the measures with each other and with other health status measures, and analyzed cumulative index distributions in relation to phenotype. To test criterion validity, we evaluated survival (institutionalization and all-cause mortality) by frailty index (FI) score, stratified by the phenotypic definitions as "robust," "pre-frail," and "frail." The measures correlated moderately well with each other (R=0.65) and with measures of function (phenotypic definition R=0.66; FI R=0.73) but less well with cognition (phenotypic definition R=-0.35; FI R=-0.58). The median FI scores increased from 0.12 for the robust to 0.30 for the pre-frail and 0.44 for the frail. Survival was also lower with increasing frailty, and institutionalization was more common, but within each phenotypic class, there were marked differences in outcomes based on the FI values-e.g., among robust people, the median 5-year survival for those with lower FI values was 85%, compared with 55% for those with higher FI values. The phenotypic definition of frailty, which offers ready clinical operationalization, discriminates broad levels of risk. The FI requires additional clinical translation, but allows the risk of adverse outcomes to be defined more precisely.
              Bookmark
              • Record: found
              • Abstract: found
              • Article: not found

              A comparison of four frailty models.

              To determine how well the interview-based, clinic-friendly International Academy of Nutrition and Aging (FRAIL) frailty scale predicts future disability and mortality in the African American Health (AAH) cohort compared with the clinic-friendly Study of Osteoporotic Fractures (SOF) frailty scale, the phenotype-based Cardiovascular Health Study (CHS) frailty scale, and the comprehensive Frailty Index (FI).
                Bookmark

                Author and article information

                Journal
                J Clin Med
                J Clin Med
                jcm
                Journal of Clinical Medicine
                MDPI
                2077-0383
                06 May 2020
                May 2020
                : 9
                : 5
                : 1367
                Affiliations
                [1 ]National Institute of Health and Nutrition, National Institutes of Biomedical Innovation, Health and Nutrition, Tokyo 162-8636, Japan; yoshida@ 123456nibiohn.go.jp (T.Y.); yuwatana@ 123456mail.doshisha.ac.jp (Y.W.); yamaday@ 123456nibiohn.go.jp (Y.Y.)
                [2 ]Institute for Active Health, Kyoto University of Advanced Science, Kyoto 621-8555, Japan; kimura.misaka@ 123456kuas.ac.jp
                [3 ]Laboratory of Applied Health Sciences, Kyoto Prefectural University of Medicine, Kyoto 602-8566, Japan
                [4 ]Senior Citizen’s Welfare Section, Kameoka City Government, Kyoto 621-8501, Japan
                [5 ]Faculty of Health and Sports Science, Doshisha University, Kyoto 610-0394, Japan
                Author notes
                Author information
                https://orcid.org/0000-0001-5644-1428
                https://orcid.org/0000-0002-4284-6317
                Article
                jcm-09-01367
                10.3390/jcm9051367
                7290950
                32384756
                4a87483d-0829-4e97-9d5f-258682b125bc
                © 2020 by the authors.

                Licensee MDPI, Basel, Switzerland. This article is an open access article distributed under the terms and conditions of the Creative Commons Attribution (CC BY) license ( http://creativecommons.org/licenses/by/4.0/).

                History
                : 10 March 2020
                : 29 April 2020
                Categories
                Article

                body mass index,frailty,older adults,cross-sectional study

                Comments

                Comment on this article