- Record: found
- Abstract: found
- Article: found
Characteristics Associated with Adults Remembering to Wash Hands in Multiple Situations Before and During the COVID-19 Pandemic — United States, October 2019 and June 2020
research-article
Julia C. Haston , MD
1
,
2
,
,
Gabrielle F. Miller , PhD
1 ,
David Berendes , PhD
3 ,
Ashley Andújar , MSHA
3 ,
Brittany Marshall , DrPH
1 ,
Jennifer Cope , MD
1
,
3 ,
Candis M. Hunter , PhD
1 ,
Brittany M. Robinson , MPH
4 ,
Vincent R. Hill , PhD
3 ,
Amanda G. Garcia-Williams , PhD
3
09 October 2020
Read this article at
There is no author summary for this article yet. Authors can add summaries to their articles on ScienceOpen to make them more accessible to a non-specialist audience.
Abstract
Washing hands often, especially during times when one is likely to acquire and spread
pathogens,* is one important measure to help
prevent the spread of SARS-CoV-2, the virus that causes coronavirus disease 2019
(COVID-19), as well as other pathogens spread by respiratory or fecal-oral transmission
(
1
,
2
). Studies have reported moderate to high levels
of self-reported handwashing among adults worldwide during the COVID-19 pandemic (
3
–
5
)
†
; however, little is known about how handwashing behavior
among U.S. adults has changed since the start of the pandemic. For this study, survey
data from October 2019 (prepandemic) and June 2020 (during pandemic) were compared
to
assess changes in adults’ remembering to wash their hands in six situations.
§
Statistically significant
increases in reported handwashing were seen in June 2020 compared with October 2019
in
four of the six situations; the odds of remembering to wash hands was 2.3 times higher
among respondents after coughing, sneezing, or blowing their nose, 2.0 times higher
before eating at a restaurant, and 1.7 times higher before eating at home. Men, young
adults aged 18–24 years, and non-Hispanic White (White) adults were less likely
to remember to wash hands in multiple situations. Strategies to help persons remember
to
wash their hands frequently and at important times should be identified and implemented,
especially among groups reporting low prevalence of remembering to wash their hands.
Data from ConsumerStyles fall and summer surveys conducted by Porter Novelli Public
Services in October 2019 and June 2020 were analyzed for this study.
¶
These data are collected by Porter Novelli
Public Services through Ipsos’ Knowledge Panel, an online market research panel.
This panel is designed to be representative of the noninstitutionalized U.S. population,
and panel members are recruited randomly by mail through probability, address-based
sampling. Respondents receive points for participating in the panel, which can be
used
to redeem cash and prizes. The samples from each year were weighted to match the U.S.
population across eight characteristics: sex, age, annual household income,
race/ethnicity, household size, education, U.S. Census division, and residence in
a
metropolitan area. Sampling weights were applied to all analyses.
The fall 2019 ConsumerStyles survey was completed by 3,624 participants during October
8–22, 2019, (77.5% response rate); the summer 2020 ConsumerStyles survey was
completed by 4,053 participants during June 10–25, 2020, (62.7% response rate).
The same handwashing question was asked in both surveys: “In which of these
situations/settings are you most likely to remember to wash your hands?” with the
following response options provided in a randomized order to each participant: 1)
after
using the bathroom at home; 2) after using the bathroom in public; 3) after coughing,
sneezing, or blowing one’s nose; 4) before eating at home; 5) before eating at a
restaurant; and 6) before preparing food at home. Participants were asked to select
all
options for which they would be likely to remember to wash their hands and could choose
as many of the six response options as were applicable. In addition to handwashing,
collected data included information about demographic characteristics, household size,
annual household income, employment status, and perceived health status. Differences
in
percentages from 2019 to 2020 were considered statistically significant when confidence
intervals were not overlapping. Multivariable logistic regression was used to estimate
odds ratios (ORs) for the association between remembering to wash hands and year,
adjusting for sex, age group, race/ethnicity, health status, U.S. Census division,
annual household income, work status, education, metro status, household size, and
marital status. All analyses were performed using Stata (Version 15; Stata Corp LP).
The 2019 and 2020 populations were similar in composition across all demographic and
socioeconomic characteristics. Respondents frequently reported remembering to wash
hands
before preparing food at home in 2019 (86.5%) and 2020 (85.7%) (Table 1), after using
the bathroom at home (85.9% and 89.6%), and
after using the bathroom in public (95.5% and 94.8%) (Table 2). Respondents less commonly
reported remembering to wash hands
before eating at home in 2019 (62.8%) and 2020 (74.4%), before eating at a restaurant
(55.2% and 70.6%), and after coughing, sneezing, or blowing their nose (53.3% and
71.2%).
TABLE 1
Percentage of respondents who reported remembering to wash their hands before
eating at home, before eating at a restaurant, and before preparing food at
home, before and during the COVID-19 pandemic, by selected characteristics
— ConsumerStyles fall and summer surveys, United States, October 2019 and
June 2020*
Characteristic
Weighted %
(95% CI)
Before
eating at home
Before
eating at a restaurant
Before
preparing food at home
2019
2020
2019
2020
2019
2020
Overall
62.8
(60.9–64.6)
74.4
(72.7–76.1)
55.2
(53.3–57.1)
70.6
(68.9–72.4)
86.5
(85.2–87.8)
85.7
(84.3–87.1)
Sex
Women
63.9 (61.2–66.5)
75.3 (72.9–77.6)
56.5 (53.8–59.2)
73.2 (70.8–78.6)
89.9 (88.2–91.6)
89.6 (87.8–91.5)
Men
61.6 (59.0–64.2)
73.5 (71.1–75.9)
53.9 (51.2–56.6)
67.9 (65.4–70.5)
82.9 (80.9–84.9)
81.5 (79.3–83.7)
Age group
(yrs)
18–24
62.3 (53.9–70.7)
70.8 (61.8–78.6)
50.8 (42.2–59.5)
65.2 (56.3–74.0)
85.2 (79.1–91.3)
77.0 (69.1–84.9)
25–34
56.3 (51.5–61.2)
66.7 (62.3–71.2)
50.8 (46.0–55.7)
65.6 (61.1–70.1)
84.5 (81.0–88.0)
81.8 (78.1–85.5)
35–44
62.0 (57.6–66.4)
72.0 (68.3–75.7)
55.4 (50.8–60.0)
69.3 (65.5–73.1)
85.3 (82.2–88.4)
85.2 (82.2–88.2)
45–54
65.5 (61.4–69.7)
75.6 (71.9–79.2)
60.4 (56.1–64.7)
75.0 (71.4–78.6)
87.9 (85.1–90.8)
88.4 (85.7–91.1)
55–64
69.1 (65.9–72.3)
81.1 (78.4–83.8)
61.7 (58.3–65.1)
75.1 (72.1–78.2)
89.6 (87.3–91.8)
90.9 (88.8–92.9)
65–74
61.5 (57.6–65.3)
78.8 (75.5–82.0)
53.5 (49.5–57.5)
74.0 (70.6–77.5)
87.6 (84.9–90.4)
87.8 (85.2–90.3)
≥75
62.6 (57.3–68.0)
78.8 (73.7–84.0)
48.6 (43.0–54.2)
67.2 (61.2–72.7)
83.8 (79.6–88.0)
87.8 (83.5–92.0)
Race/Ethnicity
White, NH
58.0 (55.8–60.1)
71.9 (69.9–73.9)
50.6 (48.4–52.8)
68.6 (66.5–70.7)
86.9 (85.5–88.3)
86.0 (84.4–87.5)
Black, NH
76.6 (71.1–82.1)
80.6 (75.5–85.8)
64.9 (58.7–71.2)
75.1 (69.7–80.4)
86.6 (81.9–91.2)
85.6 (80.9–90.4)
Other, NH
69.0 (61.3–76.7)
81.2 (75.1–87.4)
61.7 (53.7–69.8)
79.0 (72.7–85.2)
84.7 (79.0–90.4)
81.5 (74.5–88.4)
Hispanic or Latino
69.0 (63.7–74.4)
75.9 (71.1–80.6)
62.7 (57.1–68.3)
70.9 (65.8–76.0)
85.8 (81.6–90.0)
86.2 (82.1–90.2)
Multiracial, NH
58.7 (47.7–69.8)
84.8 (76.2–93.4)
63.6 (52.9–74.3)
78.0 (69.1–87.0)
85.9 (73.0–93.2)
91.1 (84.6–97.5)
Health
status†
Excellent
66.6 (60.8–72.3)
76.3 (71.3–81.3)
55.6 (49.3–61.9)
70.7 (65.1–76.3)
86.5 (82.3–90.6)
88.8 (85.3–92.4)
Very good
65.4 (62.5–68.3)
75.0 (72.4–77.7)
58.5 (55.5–61.5)
71.7 (68.9–74.4)
88.2 (86.2–90.2)
86.1 (83.8–88.4)
Good
60.6 (57.5–63.7)
75.2 (72.5–77.9)
53.2 (50.0–56.4)
71.3 (68.4–74.1)
86.1 (83.8–88.4)
84.7 (82.3–87.0)
Fair
56.7 (51.4–61.9)
70.6 (65.3–75.4)
52.7 (47.4–57.9)
67.1 (62.0–72.2)
83.7 (79.8–87.7)
86.3 (82.3–90.2)
Poor
66.4 (56.0–76.7)
69.6 (58.7–80.5)
49.6 (38.6–60.7)
69.6 (58.7–80.4)
82.8 (74.3–91.4)
80.9 (70.8–91.3)
U.S. Census
division
New England
49.5 (40.8–58.1)
73.9 (66.7–81.0)
45.3 (36.7–53.5)
73.4 (66.7–80.1)
87.2 (81.8–92.7)
88.7 (84.4–93.0)
Mid-Atlantic
65.6 (60.7–70.4)
73.4 (68.6–78.1)
57.4 (52.3–62.5)
69.8 (65.0–74.6)
87.9 (84.8–91.0)
87.8 (80.5–89.0)
East-North Central
55.0 (50.1–59.8)
75.0 (70.8–79.2)
44.7 (39.8–49.5)
69.4 (65.0–73.8)
83.2 (79.5–87.0)
84.7 (81.2–88.2)
West-North Central
56.3 (49.4–63.3)
62.1 (55.0–69.2)
51.2 (44.3–58.2)
66.6 (59.8–73.4)
83.5 (77.9–89.0)
83.0 (77.0–89.0)
South Atlantic
66.6 (62.7–70.6)
74.8 (71.0–78.5)
59.0 (54.9–63.2)
71.1 (67.2–75.0)
88.3 (85.6–91.0)
82.9 (79.3–86.4)
East-South Central
63.9 (56.1–71.6)
74.5 (66.9–82.1)
58.1 (49.9–66.3)
69.6 (61.3–77.9)
86.6 (80.9–92.2)
86.3 (79.9–92.6)
West-South Central
69.4 (63.9–75.0)
77.1 (72.4–81.7)
59.5 (53.6–65.3)
73.3 (68.3–78.4)
84.5 (80.0–89.0)
87.0 (83.2–90.8)
Mountain
59.6 (52.6–66.5)
71.5 (64.9–78.0)
54.5 (47.3–61.6)
68.6 (62.0–75.2)
87.4 (82.9–91.9)
88.5 (83.9–93.1)
Pacific
64.6 (59.9–69.3)
78.2 (74.2–82.2)
58.6 (53.7–63.4)
71.7 (67.3–76.1)
88.1 (84.9–91.4)
88.7 (85.3–92.0)
Annual household
income (US$)
<25,000
63.2 (57.8–68.5)
73.1 (67.7–78.4)
55.5 (50.0–61.0)
64.9 (59.3–70.6)
81.4 (76.9–85.9)
77.6 (72.3–83.0)
25,000–49,999
66.3 (62.0–70.6)
75.8 (71.6–79.9)
60.1 (55.5–64.7)
71.5 (67.1–76.0)
90.2 (87.9–92.6)
84.4 (80.7–88.2)
50,000–74,999
63.1 (58.6–67.5)
76.0 (72.0–80.1)
54.6 (50.0–59.3)
69.8 (65.5–74.0)
86.8 (83.8–89.8)
87.4 (84.2–90.5)
75,000–99,999
63.7 (58.9–68.5)
73.4 (69.0–77.8)
53.3 (48.3–58.4)
72.7 (68.2–77.3)
89.4 (86.3–92.6)
86.9 (83.5–90.2)
100,000–149,999
58.9 (54.7–63.1)
72.7 (69.0–76.4)
52.9 (48.6–57.2)
72.8 (69.3–76.3)
87.1 (84.2–89.9)
89.1 (86.5–91.6)
≥150,000
63.2 (58.0–68.4)
73.1 (68.6–77.7)
55.0 (49.6–60.4)
74.2 (69.7–78.8)
83.0 (78.6–87.3)
86.7 (83.0–90.4)
Work
status
§
Working
62.3 (59.9–65.6)
73.7 (71.6–75.9)
55.6 (53.2–58.0)
70.8 (68.6–73.0)
86.2 (84.5–87.9)
85.8 (84.1–87.6)
Not working
63.3 (58.3–68.4)
71.1 (66.2–75.9)
55.4 (50.2–60.6)
68.8 (63.7–73.8)
88.1 (84.7–91.5)
82.6 (78.2–87.0)
Retired
63.9 (60.6–67.2)
79.6 (76.8–82.4)
53.7 (50.2–57.1)
71.7 (68.6–74.8)
85.9 (83.5–88.4)
88.1 (85.8–90.4)
Education
Less than high school
64.0 (56.8–71.1)
72.9 (66.2–76.7)
53.7 (46.2–61.2)
65.9 (58.8–73.1)
85.0 (80.1–89.8)
79.9 (73.7–86.1)
High school
65.5 (62.0–69.0)
77.5 (74.4–80.5)
59.2 (55.6–62.8)
72.1 (68.8–75.4)
87.6 (85.2–90.0)
85.9 (83.2–88.6)
Some college
64.9 (61.6–68.3)
74.0 (70.7–77.3)
56.7 (53.1–60.2)
71.4 (68.0–74.8)
87.2 (84.6–89.8)
85.3 (82.4–88.1)
Bachelor’s degree or
higher
58.0 (55.1–60.9)
75.6 (70.1–75.1)
51.0 (48.0–53.9)
70.2 (67.7–72.7)
85.5 (83.4–87.6)
87.7 (85.9–89.5)
Metro
status
¶
Non-metro
64.2 (59.3–69.0)
69.3 (64.4–74.2)
53.2 (48.0–58.3)
65.2 (60.0–70.4)
88.7 (85.5–91.8)
82.7 (78.4–86.9)
Metro
62.6 (60.6–64.5)
75.2 (73.4–77.0)
55.6 (53.5–57.6)
71.5 (69.6–73.3)
86.2 (84.7–87.6)
86.2 (84.7–87.7)
Household
size
1
59.9 (56.1–63.8)
75.7 (72.1–79.3)
53.6 (49.7–57.5)
69.0 (65.2–72.9)
84.7 (82.0–87.5)
81.5 (77.9–85.2)
2
61.0 (58.2–63.7)
74.5 (72.0–77.1)
54.7 (51.8–57.5)
70.6 (67.9–73.2)
56.9 (85.0–88.9)
87.0 (84.9–89.0)
3
62.0 (57.4–66.6)
74.7 (70.5–78.9)
51.9 (47.2–56.6)
70.0 (65.6–74.7)
86.2 (82.9–89.4)
84.6 (80.8–88.5)
4
63.1 (57.9–68.2)
72.0 (67.5–76.5)
58.3 (53.0–63.5)
73.6 (69.3–78.0)
88.0 (84.4–91.6)
88.4 (85.3–94.5)
≥5
70.4 (65.1–75.8)
75.2 (70.2–80.2)
58.9 (53.0–64.7)
69.7 (64.3–75.1)
86.0 (82.0–90.1)
85.1 (80.7–89.6)
Marital
status
Married/Living with
partner
63.3 (61.2–65.4)
75.7 (73.9–77.6)
55.9 (53.7–58.1)
72.3 (70.4–74.2)
87.9 (86.4–89.3)
86.9 (85.4–88.5)
Single
61.9 (58.4–65.3)
72.2 (69.0–75.4)
54.1 (50.6–57.7)
67.9 (64.5–71.3)
84.3 (81.7–86.8)
83.7 (80.9–86.5)
Abbreviations: CI = confidence interval; NH = non-Hispanic.
* Surveys were conducted during October 8–22, 2019 (N = 3,624), and June
10–25, 2020 (N = 4,053).
† Health status was self-reported. Participants answered the
question, “In general, would you say your health is…?” and
were instructed to choose one answer.
§ Work status was defined as working (as a paid employee or
self-employed); not working (looking for work, on temporary layoff from a job,
disabled, or other); and not working, retired.
¶ Metro status was defined by U.S. Office of Management and
Budget core-based statistical area.
TABLE 2
Percentage of respondents who reported remembering to wash their hands after
using the bathroom at home, after using the bathroom in public and after
coughing, sneezing or blowing their nose, before and during the COVID-19
pandemic, by selected characteristics — ConsumerStyles fall and summer
surveys, United States, October 2019 and June 2020*
Characteristic
Weighted %
(95% CI)
After using
the bathroom at home
After using
the bathroom in public
After
coughing, sneezing, or blowing nose
2019
2020
2019
2020
2019
2020
Overall
85.9
(84.6–87.2)
89.6
(88.5–90.8)
95.5
(94.6–96.3)
94.8
(93.8–95.8)
53.3
(51.4–55.2)
71.2
(69.5–72.9)
Sex
Women
88.8 (87.1–90.5)
91.4 (89.8–92.9)
96.5 (95.4–97.6)
94.9 (93.5–96.4)
59.7 (57.0–62.4)
76.6 (74.3–78.9)
Men
82.8 (80.7–84.8)
87.8 (86.1–89.6)
94.4 (93.1–95.7)
94.6 (93.3–95.9)
46.4 (43.7–49.1)
65.4 (62.9–68.0)
Age group
(yrs)
18–24
84.6 (78.5–90.8)
88.0 (82.0–94.0)
95.7 (92.1–99.3)
90.7 (85.2–96.2)
48.4 (39.7–57.1)
70.5 (62.0–78.9)
25–34
81.8 (78.1–85.5)
88.0 (84.9–91.0)
93.6 (91.1–96.2)
94.7 (92.4–97.1)
50.0 (45.1–54.9)
64.0 (59.5–68.6)
35–44
85.8 (82.8–88.8)
86.7 (83.9–89.6)
97.3 (95.7–98.8)
94.1 (91.8–96.4)
54.9 (50.3–59.4)
70.9 (67.2–74.7)
45–54
86.4 (43.5–89.3)
91.1 (88.7–93.5)
94.9 (92.9–96.8)
95.3 (93.4–97.2)
61.4 (57.1–65.7)
73.8 (70.2–77.4)
55–64
89.5 (87.5–91.6)
91.5 (89.7–93.4)
95.9 (94.3–97.4)
96.5 (95.2–97.9)
55.5 (52.0–59.1)
74.6 (71.6–77.6)
65–74
87.3 (84.8–89.9)
91.9 (89.8–94.0)
96.1 (94.5–97.6)
96.7 (95.2–98.2)
51.7 (47.7–55.7)
75.3 (72.0–78.7)
≥75
86.1 (82.2–89.9)
91.1 (87.7–94.4)
95.1 (92.7–97.4)
93.5 (89.6–97.1)
44.0 (38.4–49.6)
69.2 (63.7–74.7)
Race/Ethnicity
White, NH
84.4 (82.8–85.9)
89.5 (88.1–90.8)
96.4 (95.6–97.1)
96.1 (95.2–97.1)
49.6 (47.4–51.8)
68.9 (66.8–70.9)
Black, NH
88.0 (83.6–92.5)
91.3 (87.9–94.8)
93.2 (89.6–96.9)
91.9 (88.4–95.4)
65.5 (59.4–71.6)
83.2 (78.8–87.5)
Other, NH
90.0 (85.0–95.1)
89.6 (85.2–94.0)
96.4 (93.5–99.3)
95.7 (92.6–98.8)
50.7 (42.4–59.1)
70.3 (63.1–77.4)
Hispanic or Latino
88.8 (85.1–92.5)
89.0 (85.4–92.7)
93.4 (90.5–96.3)
90.8 (87.3–94.4)
60.2 (54.6–65.9)
72.0 (67.0–77.0)
Multiracial, NH
82.9 (73.1–92.8)
90.6 (82.8–98.5)
92.7 (86.4–99.1)
99.4 (98.2–100.0)
49.2 (38.5–60.0)
73.5 (62.7–84.3)
Health
status†
Excellent
85.2 (81.0–89.3)
90.1 (86.4–93.9)
95.2 (92.7–97.7)
95.1 (92.1–98.1)
55.6 (49.3–61.9)
71.3 (66.0–76.7)
Very Good
87.8 (85.9–89.7)
89.8 (88.0–91.7)
97.2 (96.2–98.2)
96.2 (94.8–97.6)
55.6 (52.6–58.7)
72.1 (69.4–74.8)
Good
85.7 (83.3–88.0)
89.6 (87.7–91.6)
94.7 (93.1–96.3)
94.5 (92.9–96.1)
50.9 (47.7–54.2)
71.4 (68.6–74.3)
Fair
82.7 (78.6–86.7)
90.6 (87.7–93.5)
94.3 (91.5–97.1)
93.7 (90.9–96.5)
51.6 (46.3–56.8)
69.0 (63.3–73.5)
Poor
81.6 (72.5–90.6)
84.3 (76.4–92.3)
89.7 (82.3–97.0)
87.0 (78.6–95.4)
47.2 (36.2–58.2)
69.4 (58.8–80.1)
U.S. Census
division
New England
82.5 (76.0–88.9)
92.3 (88.4–96.3)
95.1 (91.8–98.3)
96.3 (93.9–98.7)
55.7 (47.0–64.4)
77.9 (71.2–84.6)
Mid-Atlantic
89.7 (86.5–93.0)
90.6 (87.4–93.7)
96.9 (95.3–98.5)
94.4 (91.7–97.1)
55.5 (50.3–60.8)
72.7 (68.0–77.4)
East-North Central
83.9 (80.4–87.4)
92.2 (89.8–94.7)
94.3 (91.9–96.8)
96.6 (94.7–98.5)
49.0 (44.1–53.9)
72.2 (67.9–76.4)
West-North Central
79.8 (74.1–85.5)
88.0 (83.5–92.5)
96.6 (93.9–99.4)
96.1 (93.5–98.6)
48.4 (41.4–55.4)
71.6 (65.4–77.8)
South Atlantic
86.0 (83.1–88.9)
88.7 (86.1–91.4)
97.1 (95.5–98.7)
94.4 (92.0–96.8)
56.2 (52.1–60.4)
73.2 (69.5–77.0)
East-South Central
87.0 (81.7–92.2)
82.4 (76.0–88.7)
96.1 (93.2–99.0)
91.5 (86.3–96.7)
60.0 (52.1–68.0)
61.9 (53.2–70.6)
West-South Central
85.7 (81.5–89.9)
89.4 (85.7–93.0)
91.2 (87.5–94.8)
94.3 (91.0–97.5)
55.1 (49.2–60.9)
72.0 (66.9–77.1)
Mountain
85.7 (80.6–90.1)
90.2 (85.8–94.5)
95.8 (92.9–98.7)
95.3 (92.0–98.7)
45.2 (38.1–52.4)
69.9 (63.5–76.2)
Pacific
87.5 (84.3–90.8)
89.7 (86.5–92.8)
95.7 (93.6–97.8)
94.2 (91.6–96.8)
52.8 (47.8–57.7)
67.2 (62.8–71.7)
Annual household
income (US$)
<25,000
82.1 (77.7–86.5)
85.9 (81.7–90.0)
89.8 (86.3–93.4)
85.7 (81.1–90.3)
57.9 (52.5–63.4)
70.2 (64.6–75.8)
25,000–49,999
89.2 (86.5–91.8)
90.2 (87.4–93.0)
96.8 (95.4–98.2)
95.8 (93.6–98.1)
56.0 (51.3–60.6)
73.5 (69.3–77.7)
50,000–74,999
86.2 (83.2–89.2)
91.0 (88.5–93.5)
95.2 (93.1–97.2)
95.5 (93.4–97.5)
54.2 (49.6–58.9)
71.5 (67.3–75.7)
75,000–99,999
87.1 (83.8–90.4)
90.7 (87.8–93.7)
96.2 (94.5–97.9)
95.8 (93.9–97.7)
53.3 (48.3–58.3)
72.6 (68.1–77.1)
100,000–149,999
85.9 (82.9–88.8)
91.7 (88.4–93.0)
97.7 (96.5–98.9)
97.1 (95.7–98.5)
49.8 (45.6–54.1)
70.9 (67.3–74.5)
≥150,000
87.6 (80.5–88.6)
87.8 (84.3–91.2)
96.7 (94.5–99.0)
95.2 (92.5–97.9)
50.3 (44.9–55.8)
72.6 (68.2–77.1)
Work
status
§
Working
85.2 (83.5–86.9)
89.3 (87.8–90.8)
95.9 (94.8–96.9)
95.1 (93.9–96.3)
53.2 (50.8–55.6)
70.7 (68.5–72.8)
Not working
86.4 (82.9–89.9)
88.0 (84.5–91.5)
94.8 (92.5–97.1)
93.0 (90.1–95.9)
56.4 (51.2–61.7)
70.7 (65.9–75.6)
Retired
87.7 (85.4–90.0)
92.2 (90.4–94.0)
94.9 (93.4–96.5)
95.4 (93.6–97.1)
50.3 (46.8–53.8)
73.5 (70.4–76.5)
Education
Less than high school
85.9 (81.2–90.7)
88.0 (82.3–92.4)
90.5 (86.5–94.4)
87.8 (82.6–93.1)
58.2 (50.8–65.7)
71.6 (64.7–78.5)
High school
87.7 (85.3–90.1)
90.3 (88.1–92.5)
94.5 (92.8–96.3)
92.9 (90.8–95.0)
59.1 (55.5–62.7)
75.3 (72.1–78.4)
Some college
85.5 (82.8–88.1)
89.0 (86.6–91.3)
96.0 (94.5–97.5)
96.2 (94.7–97.7)
53.0 (49.4–56.6)
72.5 (69.1–78.8)
Bachelor’s degree or
higher
84.7 (82.6–86.7)
90.4 (88.8–91.9)
97.5 (96.6–98.4)
97.3 (96.4–98.3)
46.7 (43.8–49.7)
66.7 (64.1–69.3)
Metro
status
¶
Non-metro
82.4 (78.5–86.2)
86.4 (82.7–90.0)
96.6 (95.0–98.3)
94.5 (91.5–97.4)
52.3 (47.2–57.4)
68.7 (63.6–73.7)
Metro
86.5 (85.4–87.9)
90.2 (88.9–91.4)
95.3 (94.4–96.2)
94.8 (93.8–95.9)
53.4 (51.4–55.5)
71.6 (69.8–73.4)
Household
size
1
84.4 (81.6–87.3)
87.0 (84.0–89.9)
94.3 (92.5–96.2)
92.9 (90.4–95.4)
51.1 (47.2–55.0)
69.5 (65.6–73.4)
2
85.1 (83.1–87.1)
89.7 (87.9–91.5)
96.2 (95.1–97.3)
95.5 (93.9–97.0)
51.3 (48.5–54.1)
71.2 (68.6–73.8)
3
86.3 (83.1–89.6)
90.2 (87.2–93.2)
93.4 (90.7–96.1)
94.6 (92.0–97.1)
54.4 (49.2–59.1)
72.6 (68.5–76.8)
4
85.7 (81.9–89.6)
90.6 (88.0–93.3)
95.4 (93.1–97.8)
96.1 (94.1–98.0)
54.8 (49.4–60.1)
71.9 (67.3–76.5)
≥5
88.8 (85.2–92.5)
90.3 (86.7–93.8)
97.6 (96.0–99.1)
94.0 (90.9–97.0)
56.6 (50.2–62.8)
70.5 (65.2–75.8)
Marital
status
Married/Living with
partner
86.2 (84.7–87.7)
90.1 (88.8–91.4)
96.0 (95.0–96.9)
95.9 (94.9–96.9)
54.0 (51.8–56.2)
71.5 (69.6–73.5)
Single
85.4 (83.0–87.9)
88.9 (86.6–91.1)
94.7 (93.1–96.3)
93.0 (90.9–95.0)
52.1 (48.6–55.7)
70.7 (67.4–73.9)
Abbreviations: CI = confidence interval; NH = non-Hispanic.
* Surveys were conducted during October 8–22, 2019 (N = 3,624), and June
10–25, 2020 (N = 4,053).
† Health status was self-reported. Participants answered the
question, “In general, would you say your health is…?” and
were instructed to choose one answer.
§ Work status was defined as working (as a paid employee or
self-employed); not working (looking for work, on temporary layoff from a job,
disabled, or other); and not working, retired.
¶ Metro status was defined by U.S. Office of Management and
Budget core-based statistical area.
In 2020, both men and women more frequently reported remembering to wash hands before
eating at home and at a restaurant, and after coughing, sneezing, or blowing their
nose
than they did in 2019. When stratified by age group, a higher percentage of young
adults
(aged 18–24 years) in 2020 reported remembering to wash hands after having
respiratory symptoms compared with 2019, and higher percentages of adults aged
≥25 years reported remembering to wash hands before eating at home and in a
restaurant and after having respiratory symptoms in 2020 than did in 2019. In 2020,
White participants more frequently reported remembering to wash hands before eating
at
home, before eating in a restaurant, after using the bathroom at home, and after having
respiratory symptoms than they did in 2019. Non-Hispanic Black (Black) and Hispanic
or
Latino (Hispanic) participants more frequently reported remembering to wash hands
after
having respiratory symptoms in 2020 than they did in 2019.
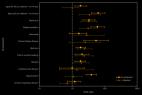
Compared with 2019 responses, the odds of reporting remembering to wash hands before
eating at home, before eating in a restaurant, after using the bathroom at home, and
after coughing, sneezing, or blowing one’s nose were significantly higher in
2020, after controlling for demographic and socioeconomic factors
(aOR = 1.72, 2.01, 1.41, and 2.28, respectively) (Table 3). Regardless of year, men
were significantly less likely
than were women to remember to wash hands before eating at a restaurant, before
preparing food, after using the bathroom at home, and after experiencing respiratory
symptoms. In addition, young adults (aged 18–24 years) were less likely to
remember to wash their hands before eating in a restaurant, before food preparation,
and
after having respiratory symptoms than were adults aged 45–74 years. Finally,
compared with White participants, Black participants were more likely to remember
to
wash their hands before eating at home, before eating in a restaurant, after using
the
bathroom at home, and after experiencing respiratory symptoms. Hispanic participants
were more likely than were White participants to remember to wash their hands before
eating at home, before eating at a restaurant, and after experiencing respiratory
symptoms, regardless of year.
TABLE 3
Odds of remembering to wash hands before and after six situations, by
respondent characteristics — ConsumerStyles fall and summer surveys
— United States, October 2019 and June 2020*
Characteristic
aOR (95%
CI)
Before
eating at home
Before eating at a
restaurant
Before preparing food at
home
After using the bathroom at
home
After using the bathroom in
public
After coughing, sneezing, or
blowing nose
Overall,
year
2019
Referent
Referent
Referent
Referent
Referent
Referent
2020
1.72
(1.56–1.89)
2.01
(1.84–2.20)
0.90
(0.78–1.03)
1.41
(1.24–1.60)
0.79
(0.63–0.98)
2.28
(2.08–2.50)
Sex
Women
Referent
Referent
Referent
Referent
Referent
Referent
Men
0.94 (0.82–1.06)
0.85 (0.75–0.96)
0.53 (0.44–0.63)
0.67 (0.56–0.80)
0.84 (0.62–1.13)
0.58 (0.51–0.66)
Age group
(yrs)
18–24
Referent
Referent
Referent
Referent
Referent
Referent
25–34
0.86 (0.61–1.19)
1.04 (0.75–1.43)
1.26 (0.83–1.92)
0.91 (0.58–1.42)
1.12 (0.56–2.26)
1.02 (0.74–1.42)
35–44
1.09 (0.78–1.52)
1.25 (0.90–1.72)
1.46 (0.95–2.25)
0.97 (0.62–1.54)
1.33 (0.64–2.76)
1.38 (0.99–1.93)
45–54
1.29 (0.92–1.81)
1.56 (1.13–2.16)
1.83 (1.19–2.83)
1.29 (0.81–2.04)
1.35 (0.65–2.81)
1.71 (1.23–2.38)
55–64
1.79 (1.29–2.50)
1.72 (1.25–2.38)
2.53 (1.63–3.94)
1.66 (1.05–2.62)
1.94 (0.90–4.21)
1.54 (1.11–2.13)
65–74
1.34 (0.93–1.92)
1.51 (1.06–2.13)
2.01 (1.23–2.37)
1.39 (0.85–2.26)
2.17 (0.95–4.96)
1.44 (1.01–2.05)
≥75
1.43 (0.95–2.14)
1.14 (0.78–1.67)
1.74 (1.02–2.95)
1.31 (0.76–2.25)
1.34 (0.55–3.27)
1.12 (0.76–1.65)
Race/Ethnicity
White, NH
Referent
Referent
Referent
Referent
Referent
Referent
Black, NH
2.00 (1.56–2.55)
1.60 (1.29–1.99)
1.05 (0.77–1.42)
1.39 (1.01–1.92)
0.61 (0.40–0.92)
2.00 (1.59–2.51)
Other, NH
1.64 (1.19–2.26)
1.60 (1.19–2.14)
0.63 (0.43–0.91)
1.26 (0.81–1.95)
0.73 (0.39–1.40)
1.11 (0.82–1.49)
Hispanic or Latino
1.34 (1.09–1.66)
1.32 (1.08–1.62)
0.96 (0.72–1.27)
1.20 (0.88–1.62)
0.59 (0.40–0.88)
1.39 (1.14–1.71)
Multiracial, NH
1.37 (0.92–2.03)
1.50 (1.04–2.18)
1.11 (0.61–2.03)
0.91 (0.50–1.64)
1.10 (0.41–2.94)
1.12 (0.78–1.60)
Health
status
†
Excellent
Referent
Referent
Referent
Referent
Referent
Referent
Very good
0.90 (0.71–1.15)
1.01 (0.80–1.27)
0.86 (0.62–1.20)
1.07 (0.78–1.46)
1.33 (0.76–2.34)
0.92 (0.73–1.17)
Good
0.72 (0.57–0.92)
0.84 (0.67–1.07)
0.73 (0.52–1.02)
0.93 (0.67–1.29)
0.99 (0.57–1.73)
0.75 (0.59–0.96)
Fair
0.55 (0.41–0.72)
0.73 (0.56–0.97)
0.72 (0.49–1.05)
0.81 (0.55–1.18)
1.08 (0.82–2.01)
0.62 (0.47–0.82)
Poor
0.67 (0.44–1.04)
0.78 (0.51–1.20)
0.69 (0.39–1.22)
0.68 (0.38–1.22)
0.65 (0.29–1.48)
0.63 (0.41–0.96)
U.S. Census
division
New England
Referent
Referent
Referent
Referent
Referent
Referent
Mid-Atlantic
1.34 (0.97–1.85)
1.17 (0.85–1.61)
0.87 (0.56–1.39)
1.30 (0.81–2.10)
1.04 (0.53–2.06)
0.82 (0.59–1.14)
East-North Central
1.06 (0.77–1.44)
0.89 (0.66–1.21)
0.68 (0.44–1.05)
1.03 (0.67–1.60)
1.12 (0.59–2.14)
0.65 (0.48–0.90)
West-North Central
0.85 (0.60–1.21)
1.00 (0.71–1.41)
0.59 (0.36–0.98)
0.78 (0.48–1.26)
1.05 (0.49–2.25)
0.69 (0.49–0.99)
South Atlantic
1.31 (0.96–1.78)
1.22 (0.90–1.64)
0.78 (0.50–1.20)
0.94 (0.61–1.44)
1.15 (0.59–2.24)
0.75 (0.55–1.03)
East-South Central
1.25 (0.85–1.83)
1.19 (0.82–1.74)
0.88 (0.52–1.51)
0.77 (0.46–1.29)
0.79 (0.37–1.68)
0.65 (0.44–0.96)
West-South Central
1.50 (1.07–2.10)
1.24 (0.89–1.73)
0.83 (0.53–1.31)
0.93 (0.59–1.49)
0.83 (0.44–1.59)
0.70 (0.50–0.98)
Mountain
1.08 (0.75–1.53)
1.08 (0.76–1.53)
1.00 (0.61–1.65)
1.01 (0.61–1.68)
1.09 (0.52–2.31)
0.61 (0.42–0.87)
Pacific
1.31 (0.95–1.81)
1.16 (0.85–1.60)
1.11 (0.70–1.75)
1.11 (0.70–1.75)
1.11 (0.57–2.15)
0.66 (0.48–0.91)
Annual household
income (US$)
<25,000
Referent
Referent
Referent
Referent
Referent
Referent
25,000–49,999
1.09 (0.86–1.38)
1.23 (0.97–1.55)
1.75 (1.28–2.40)
1.63 (1.19–2.24)
3.74 (2.27–6.16)
1.01 (0.79–1.28)
50,000–74,999
1.00 (0.78–1.28)
1.02 (0.80–1.30)
1.62 (1.17–2.23)
1.41 (1.03–1.94)
2.22 (1.41–3.47)
0.93 (0.73–1.20)
75,000–99,999
0.92 (0.70–1.20)
1.02 (0.79–1.31)
1.77 (1.25–2.52)
1.43 (1.01–2.01)
2.53 (1.57–4.09)
0.95 (0.73–1.24)
100,000–149,999
0.84 (0.65–1.09)
1.02 (0.79–1.30)
1.67 (1.19–2.36)
1.36 (0.97–1.90)
3.13 (1.83–5.38)
0.88 (0.68–1.14)
≥150,000
0.91 (0.68–1.21)
1.10 (0.83–1.46)
1.27 (0.85–1.87)
1.08 (0.74–1.59)
1.85 (0.95–3.60)
0.94 (0.71–1.26)
Work
status
§
Working
Referent
Referent
Referent
Referent
Referent
Referent
Not working
0.97 (0.79–1.18)
0.98 (0.84–1.19)
1.13 (0.85–1.51)
1.07 (0.81–1.41)
1.48 (0.96–2.29)
0.67 (0.79–1.18)
Retired
1.13 (0.93–1.37)
0.99 (0.82–1.19)
0.93 (0.70–1.75)
1.28 (0.97–1.69)
0.87 (0.55–1.38)
1.01 (0.84–1.21)
Education
Less than high school
Referent
Referent
Referent
Referent
Referent
Referent
High school
1.20 (0.91–1.58)
1.27 (0.97–1.65)
1.23 (0.87–1.73)
1.18 (0.82–1.68)
1.45 (0.93–2.25)
1.06 (0.81–1.40)
Some college
1.09 (0.83–1.44)
1.19 (0.91–1.55)
1.19 (0.83–1.69)
1.01 (0.70–1.44)
2.35 (1.41–3.91)
0.88 (0.67–1.16)
Bachelor’s degree or
higher
0.91 (0.68–1.21)
1.00 (0.76–1.31)
1.22 (0.85–1.76)
1.03 (0.71–1.50)
2.94 (1.72–5.05)
0.70 (0.53–0.93)
Metro
status
¶
Non-metro
Referent
Referent
Referent
Referent
Referent
Referent
Metro
0.98 (0.81–1.18)
1.11 (0.93–1.34)
0.91 (0.71–1.17)
1.19 (0.94–1.51)
0.74 (0.48–1.13)
1.06 (0.88–1.27)
Household
size
1
Referent
Referent
Referent
Referent
Referent
Referent
2
0.98 (0.81–1.17)
1.07 (0.90–1.28)
1.38 (1.07–1.78)
1.23 (0.95–1.60)
1.38 (0.91–2.09)
1.10 (0.91–1.32)
3
1.14 (0.92–1.42)
1.06 (0.85–1.31)
1.39 (1.03–1.88)
1.60 (1.17–2.18)
1.23 (0.75–2.00)
1.19 (0.95–1.48)
4
1.06 (0.83–1.36)
1.34 (1.05–1.71)
1.69 (1.19–2.41)
1.58 (1.12–2.24)
1.46 (0.82–2.62)
1.21 (0.95–1.55)
≥5
1.39 (1.07–1.82)
1.25 (0.97–1.61)
1.31 (0.92–1.87)
1.82 (1.24–2.67)
1.75 (0.93–3.28)
1.19 (0.92–1.54)
Marital
status
Married/Living with
partner
Referent
Referent
Referent
Referent
Referent
Referent
Single
0.88 (0.74–1.03)
0.95 (0.81–1.10)
1.04 (0.83–1.30)
1.09 (0.87–1.36)
1.13 (0.78–1.65)
0.93 (0.79–1.10)
Abbreviations: aOR = adjusted odds ratio; CI = confidence interval;
NH = non-Hispanic.
* Surveys were conducted during October 8–22, 2019 (N = 3,624), and June
10–25, 2020 (N = 4,053).
† Health status was self-reported. Participants answered the
question, “In general, would you say your health is…?” and
were instructed to choose one answer.
§ Work status was defined as working (as a paid employee or
self-employed); not working (looking for work, on temporary layoff from a job,
disabled, or other); and not working, retired.
¶ Metro status was defined by U.S. Office of Management and
Budget core-based statistical area.
Discussion
The findings in this report suggest that the percentage of U.S. adults who reported
remembering to wash their hands in certain circumstances has increased during the
COVID-19 pandemic compared with prepandemic levels. In June 2020, more U.S. adults
reported remembering to wash their hands after coughing, sneezing, or blowing their
nose, before eating in a restaurant, before eating at home, and after using the
bathroom at home compared with responses in October 2019. The most substantial
increases were in the percentages of those remembering to wash their hands after
experiencing respiratory symptoms. Despite these increases, however, fewer than 75%
of respondents reported remembering to wash their hands after having respiratory
symptoms, before eating in a restaurant, and before eating at home. Efforts are
needed to communicate the importance of handwashing during these specific situations
as well as before food preparation and after using the bathroom.
In both 2019 (prepandemic) and 2020 (during the pandemic), higher percentages of
older adults, women, Black persons, and Hispanic persons reported remembering to
wash their hands in multiple situations than did young adults, men, and White
adults. Because older adults, Black persons, and Hispanic persons have been
disproportionately affected by COVID-19 (
6
), engagement in preventive behaviors by these
persons is particularly important. The findings of this study are consistent with
other studies conducted during the COVID-19 pandemic (
3
,
7
) and past respiratory pandemics (
8
) that have found an
association between self-reported handwashing behavior and demographic factors such
as sex and age. Although the current study did not explore the reasons for
differences in remembering to wash hands among groups, previous work has indicated
that older adults perceive personal risks of COVID-19 to be higher than do younger
adults, and women have perceived themselves to be at higher risk of infection during
respiratory pandemics than have men (
3
,
8
). Also, men and younger adults have less knowledge
about symptoms and transmission compared with other groups (
7
), which might affect their handwashing
behaviors.
The findings in this report are subject to at least six limitations. First, the
cross-sectional design does not allow for assessment of whether the changes in
reported remembering to wash hands was directly related to the pandemic or whether
respondents might have been influenced by other factors, such as community hygiene
promotion activities. However, the same question was asked using the same platform
and data collection strategy, which facilitated comparisons over time. Second, the
use of overlapping confidence intervals to determine whether the difference between
years was statistically significant might result in false negatives, indicating that
characteristics did not statistically differ from 2019 to 2020. This methodology is
a very conservative approach intended to assess the relationship before estimating
aORs. Third, despite weighting to make survey responses nationally representative,
persons who agree to participate in online surveys could differ systematically from
other members of the public. Fourth, the survey relied on self-report, which could
be affected by recall bias or social desirability bias (
9
), resulting in falsely lowered or elevated
percentages of those reporting remembering to wash their hands. Fifth, this survey
did not assess whether participants had access to handwashing supplies, which might
affect the ability to wash one’s hands frequently. Finally, the survey
question did not specify how handwashing was performed (e.g., with soap and water)
and did not consider hand sanitizer use, which is a recommended method of hand
hygiene if soap and water are unavailable.
These findings underscore the importance of promoting frequent handwashing during
the
ongoing COVID-19 pandemic, especially after coughing, sneezing, and blowing
one’s nose. Men, young adults, and White adults continue to be less likely to
remember to wash their hands, despite improvements made from 2019 to 2020.
Additional work is needed to identify strategies to remind and motivate persons to
wash their hands, not only for the prevention of COVID-19, but also to reduce
transmission of other infectious diseases transmitted via respiratory or fecal-oral
routes. Strategies that have been used in the past to promote handwashing have
included active and passive hygiene education, provision of handwashing supplies,
environmental cues, and health communication (
2
). These types of efforts should be tailored to
resonate with men, young adults, and White adults and continue to specify important
times when persons should wash their hands, such as before eating and after
coughing, sneezing, or blowing their nose.
Summary
What is already known about this topic?
Hand hygiene is one important measure to prevent the spread of COVID-19 and
other pathogens.
What is added by this report?
U.S. adult Internet survey respondents in June 2020 were more likely to
remember to wash their hands after experiencing respiratory symptoms, before
eating in a restaurant, and before eating at home than were October 2019
survey respondents. Despite improvements, <75% of survey respondents
reported remembering to wash their hands in these situations in 2020.
What are the implications for public health practice?
Public health efforts should promote frequent handwashing for all, with
attention to tailoring messaging to men, young adults, and non-Hispanic
White adults. Particular focus should be placed on encouraging handwashing
at important times such as before eating and after experiencing respiratory
symptoms.
Related collections
Most cited references9
- Record: found
- Abstract: found
- Article: not found
Demographic and attitudinal determinants of protective behaviours during a pandemic: A review
Alison Bish, Susan Michie (2011)
- Record: found
- Abstract: not found
- Article: not found
Faking it: Social Desirability Response Bias in Self-Report Research
F van de Thea, T.F. Van de Mortel, T. van de Mortel … (2012)
- Record: found
- Abstract: found
- Article: found
Characteristics Associated with Hospitalization Among Patients with COVID-19 — Metropolitan Atlanta, Georgia, March–April 2020
Marie Killerby, Ruth Link-Gelles, Sarah Haight … (2020)