- Record: found
- Abstract: found
- Article: not found
Somatic SETBP1 mutations in myeloid malignancies
research-article
Hideki Makishima
1 ,
Kenichi Yoshida
2 ,
Nhu Nguyen
3 ,
Bartlomiej Przychodzen
1 ,
Masashi Sanada
2
,
4 ,
Yusuke Okuno
2
,
5 ,
Kwok Peng Ng
1 ,
Kristbjorn O Gudmundsson
3 ,
Bandana A. Vishwakarma
3 ,
Andres Jerez
1 ,
Ines Gomez-Segui
1 ,
Mariko Takahashi
2 ,
Yuichi Shiraishi
6 ,
Yasunobu Nagata
2 ,
Kathryn Guinta
1 ,
Hiraku Mori
7 ,
Mikkael A Sekeres
8 ,
Kenichi Chiba
6 ,
Hiroko Tanaka
9 ,
Hideki Muramatsu
5 ,
Hirotoshi Sakaguchi
5 ,
Ronald L Paquette
10 ,
Michael A McDevitt
11 ,
Seiji Kojima
5 ,
Yogen Saunthararajah
1 ,
Satoru Miyano
6
,
9 ,
Lee-Yung Shih
12 ,
Yang Du
3 ,
Seishi Ogawa
2
,
4 ,
Jaroslaw P. Maciejewski
1
07 July 2013
Read this article at

There is no author summary for this article yet. Authors can add summaries to their articles on ScienceOpen to make them more accessible to a non-specialist audience.
Abstract
Here we report whole exome sequencing of patients with various myeloid malignancies,
and identify recurrent somatic mutations in SETBP1, consistent with a recent report
on atypical chronic myeloid leukemia (aCML).
1
Closely positioned somatic SETBP1 mutations at p.Asp868, p.Ser869, p.Gly870, p.Ile871
and Asp880, matching germ-line mutations in Schinzel-Giedion syndrome (SGS),
2
were detected in 17% of secondary acute myeloid leukemia (sAML) and 15% of chronic
myelomonocytic leukemia (CMML) cases. These results by deep sequencing demonstrated
the higher mutational detection rate than reported using conventional sequencing methodology.
3–5
Mutant cases were associated with higher age and −7/del(7q), constituting poor prognostic
factors. Analysis of serial samples indicated that SETBP1 mutations were acquired
during leukemic evolution. Transduction of the mutant Setbp1 led to immortalization
of myeloid progenitors and showed enhanced proliferative capacity compared to the
wild type Setbp1. Somatic mutations of SETBP1 appear to be gain-of-function, are associated
with myeloid leukemic transformation and convey a poor prognosis in myelodysplastic
syndromes (MDS) and CMML.
During the past decade, substantial progress has been made in our understanding of
myeloid malignancies through discovering pathogenic gene mutations. Following early
identification of mutations in RUNX1,
6
JAK2
7
and RAS,
8,9
SNP array karyotyping clarified mutations in CBL,
10
TET2
11
and EZH2.
12
More recently, new sequencing technologies have enabled exhaustive screening of somatic
mutations in myeloid malignancies, leading to the discovery of unexpected mutational
targets, such as DNMT3A,
13
IDH1
14
and spliceosomal genes.
15–17
Insights into the progression to sAML constitute an important goal of biomedical investigations,
now augmented by the availability of next generation sequencing technologies.
18,19
We performed whole exome sequencing of 20 index cases with myeloid malignancies (Supplementary
Table 1) to identify a total of 38 non-silent somatic mutations that were subsequently
confirmed by Sanger sequencing and targeted deep sequencing. We found that 7 genes
were recurrently mutated in multiple samples (Supplementary Table 2–4). Among these,
we identified a novel recurrent somatic mutation of SETBP1 (p.Asp868Asn) in 2 cases
with refractory anemia with excess blasts (RAEB) (Fig. 1 and Supplementary Table 1–3
and 5), which were confirmed using DNA from both tumor and CD3+ T-cells.
SETBP1 was initially identified as a 170 kD nuclear protein which binds to SET
20,21
and is activated to support recovery of granulopoiesis in chronic granulomatous disease.
22
SETBP1 is causative for SGS, a congenital disease characterized by a higher-than-normal
prevalence of tumors, typically neuroepithelial neoplasia.
23,24
Interestingly, the mutations identified in our cohort exactly corresponded to the
recurrent de novo germline mutations responsible for SGS, which prompted us to investigate
SETBP1 mutations in a large cohort of 727 cases with various myeloid malignancies
(Supplementary Table 6).
SETBP1 mutations were found in 52 out of 727 cases (7.2 %). Consistent with recent
reports,
1,3–5,25,26
p.Asp868Asn (N=28), p.Gly870Ser (N=15) and p.Ile871Thr (N=5) alterations were more
frequent than p.Asp868Tyr, p.Ser869Asn, p.Asp880Asn and p.Asp880Glu (N=1 for each)
(Fig. 1 and Supplementary Table 1 and 7). All these alterations were located in the
Ski homology region which is highly conserved among species (Supplementary Fig. 1).
Comparable expression of mutant to the wild-type (WT) alleles was confirmed for p.Asp868Asn
and p.Gly870Ser alterations by allele-specific PCR using genomic DNA and cDNA (Supplementary
Fig. 2). SETBP1 mutations were significantly associated with advanced age (P=0.01)
and −7/del(7q) (P=0.01), and frequently found in sAML (19/113; 16.8%) (P<0.001), and
CMML (22/152; 14.5%) (P=0.002), while less frequent in primary AML (1/145; <1%) (P=0.002)
(Table 1 and Supplementary Fig. 3a). The lack of apparent segmental allelic imbalance
involving SETBP1 locus (18q12.3) in SNP-array karyotyping in all mutated cases (Supplementary
Fig. 4), together with no more than 50% of their allele frequencies in deep sequencing
and allele-specific PCR, suggested heterozygous mutations (Fig. 1b and Supplementary
Fig. 2). Medical history and physical findings did not support the clinical diagnosis
of SGS in any of these cases, and the formal confirmation of somatic origin of all
types of mutations found was carried out using germline DNA from CD3+ cells and/or
serial samples (N=21).
Among the cases with SETBP1 mutations, 12 had clinical material available to successfully
analyze serial samples from multiple clinical time points. None of the 12 cases had
SETBP1 mutations at the time of initial presentation, indicating that the mutations
were acquired only upon/during leukemic evolution (Fig. 1 and 2). Most of the SETBP1
mutations (17/19) showed comparable or higher allele frequencies compared to other
secondary events, suggesting a potential permissive role of SETBP1 mutations (Supplementary
Fig. 5). Such secondary nature of SETBP1 mutations was confirmed by mutational analysis
of colonies derived from individual progenitor cells grown in methylcellulose culture
(Supplementary Fig. 6).
To test potential associations with additional genetic defects, frequency of mutations
in 13 common genes relevant to myeloid leukemogenesis was compared between the cases
with SETBP1 mutations and WT (Fig. 2c and d and Supplementary Table 8). Only CBL mutations
were significantly associated with SETBP1 mutations (P=0.002) (Supplementary Table
9). Of note is that mutations of FLT3 and NPM1 were not found in cases with SETBP1
mutation. Coexisting SETBP1 and CBL mutations were found in 12 cases, of which 6 were
subjected to deep sequencing and CBL-mutated clones were significantly smaller than
SETBP1-mutated clones, suggesting that CBL mutations were acquired by a subclone with
SETBP1 mutation (Supplementary Fig. 5). The significant association of CBL and SETBP1
mutations suggests their potential cooperation in leukemia progression. While direct
physical interaction between mutant Setbp1 and CBL proteins was not detected (Supplementary
Fig. 7), it is possible that CBL mutations cooperate with SETBP1 mutations indirectly
by reducing cytokine dependence of leukemia cells.
10,27
SETBP1 mutations were also found in aCML
1
and juvenile chronic myelomonocytic leukemia,
28
characterized by RAS pathway defects, including CBL mutations.
Analysis of expression patterns of SETBP1 mRNA in normal hematopoietic tissues showed
relatively low levels of this transcript in myeloid/monocytic cells as well as CD34+
(Supplementary Fig. 8). In contrast, SETBP1 mutant cases showed significantly higher
expression levels than SETBP1 WT samples (P=0.03) (Supplementary Fig. 9). When SETBP1
expression was also evaluated using expression array data in the cases with different
subtypes of myeloid neoplasms (Supplementary Fig. 10), SETBP1 expression was found
to be overexpressed in cases with non-CBF primary AML and including MDS, while core
binding factor (CBF) leukemias showed normal levels of the corresponding mRNA. In
particular, SETBP1 expression was significantly increased in cases with −7 (P=0.03)
and complex karyotype (P<0.001). Clustering analysis of gene expression profiles suggested
that SETBP1 mutant cases displayed a similar expression pattern to the cases with
overexpression of WT SETBP1, including overexpression of TCF4, BCL11A and DNTT. (Supplementary
Fig. 10 and Supplementary Table 10). Methylation array analysis demonstrated that
relative hypomethylation of the CpG site located in proximity to SETBP1 coding region
was associated with higher expression and mutation of SETBP1 (Supplementary Fig. 11).
It remains unclear what factors drive the increase in SETBP1 mRNA levels in these
leukemias, however, mechanisms may involve aberrant hypomethylation of its promoter
or activation of upstream regulators such as EVI1.
22,29
Within the entire cohort, SETBP1-mutated cases were significantly associated with
a shorter overall survival (HR 2.27, 95%CI 1.56–3.21, P<0.001), which was especially
prominent within the younger age group (<60 years; HR 4.92, 95%CI 2.32–9.46, P<0.001).
The presence of SETBP1 mutations was also associated with compromised survival in
the cohort with normal karyotype (HR 3.13, 95%CI 1.66–5.41, P=0.002) (Fig. 3). Multivariate
analysis confirmed that SETBP1 mutation was an independent prognostic factor (HR 2.90,
95%CI 1.71–4.83, P<0.001) together with male sex, higher age, the presence of ASXL1,
CBL and DNMT3A mutations. −7/del(7q) was associated with a shorter survival in univariate
analysis, but did not remain an independent risk factor after multivariate analysis
(Supplementary Table 11). The multivariate analysis in the subgroup of MDS and CMML
(WBC<12,000/µl), in which the International Prognostic Scoring System (IPSS) score
was applicable,
30
also showed that SETBP1 mutation was an independent prognostic factor (HR 1.83, 95%CI
1.04–3.12, P=0.04), while the impact of the IPSS score dissipated after the multivariate
analysis (Supplementary Table 11 and 12). Next, since comprehensive mutational screening
clarified significant association between SETBP1 and CBL mutations, we compared overall
survival among patients with either of these mutations or in combination (Supplementary
Table 13 and Supplementary Fig. 12 and 13). Overall survival was shorter in SETBP1
mut/CBL
mut compared to SETBP1
WT/CBL
WT cases and this combination was also unfavorable in an isolated CMML cohort in which
either of these mutations alone did not affect survival (Fig. 3 and Supplementary
Fig. 13). However, no impact of these mutations was found in a sAML cohort, likely
due to already very poor prognosis in this subset of patients (Supplementary Fig.
12 and 14).
Previous studies demonstrated that overexpression of Setbp1 can effectively immortalize
murine myeloid precursors.
31
Expression of Setbp1 alterations (either p.Asp868Asn or p.Ile871Thr) also caused efficient
immortalization of murine myeloid progenitors of similar phenotypes (Fig. 4a and b
and Supplementary Fig. 15). Moreover, while having similar levels of Setbp1 protein
expression to WT Setbp1-immortalized cells, mutant Setbp1-immortalized cells showed
significantly more efficient colony formation and faster proliferation (Fig. 4c and
d and Supplementary Fig. 16 and 17). This observation is consistent with the gain
of leukemogenic function due to SETBP1. Similar to over expressed WT Setbp1, homeobox
genes Hoxa9 and Hoxa10 represent critical targets of Setbp1 mutants as both WT and
mutant Setbp1-immortalized cells expressed comparable levels of corresponding mRNAs,
and knockdown of either gene caused a dramatic reduction of colony-forming potential
(Supplementary Fig. 18 and 19). In agreement with these findings, SETBP1-mutant leukemias
(N=14) showed significantly higher HOXA9 and HOXA10 expression levels compared to
WT cases without SETBP1 overexpression (N=9; P=0.03 and 0.03, respectively), supporting
the notion that HOXA9 and HOXA10 are likely functional targets of mutated SETBP1 in
myeloid neoplasms (Supplementary Fig. 20).
Multiple mechanisms could contribute to the increased oncogenic properties of SETBP1
mutations. For instance, mutation could increase protein stability (Supplementary
Fig. 21), resulting in higher protein levels (analogous to up-modulation of SETBP1
mRNA), in agreement with a previously reported observation.
1
However, we also showed that SETBP1 mRNA overexpression in vitro was associated with
immortalization of progenitors and that there were primary cases of sAML with and
without mutations of SETBP1 and high levels of WT mRNA. Thus, while plausible, the
mechanisms of increased SETBP1 expression and its proto-oncogenic role may be more
complicated. It is also possible that interaction between Ski/SnoN and SETBP1 through
the SKI homology region could be affected by mutations, leading to transformation.
20,32
SETBP1 was shown to regulate PP2A activity via binding to SET
20
and decreased PP2A activity has been described in AML.
21,33
In fact, we observed that mutant Setbp1 immortalized myeloid progenitors displayed
increased tyrosine phosphorylation of Pp2ac over WT Setbp1 immortalized cells (Supplementary
Fig. 22), suggesting that SETBP1 mutations could cause further PP2A inhibition.
In summary, somatic recurrent SETBP1 mutations are new lesions that interact with
previously defined poor prognosis pathways, and provide new insights into the process
of leukemic evolution. The apparent association of SETBP1 mutations with poor clinical
outcomes observed here provides an important focal point for future mechanistic studies
as well as a goal for therapeutic targeting.
Methods
Patient population
Bone marrow aspirates or blood samples were collected from 727 patients with various
myeloid malignancies seen at Cleveland Clinic, University of Tokyo, University of
California Los Angeles, Sidney Kimmel Comprehensive Cancer Center at Johns Hopkins,
Chung Gung University and Showa University (Supplementary Table 6). Informed consent
for sample collection was obtained according to protocols approved by the Institutional
Review Board and in accordance with the Declaration of Helsinki. Diagnosis was confirmed
and assigned according to World Health Organization (WHO) classification criteria.
35
Prognostic risk assessment was assigned according to the International Scoring Criteria
for patients with MDS and chronic myelomonocytic leukemia with a white cell count
<12,000/ul.
30
For the purpose of this study, low-risk MDS was defined as patients having <5% myeloblasts.
Patients with ≥5% myeloblasts constituted those with higher-risk disease. Serial samples
were obtained for 12 patients with SETBP1 mutations. As a source of germ line controls,
immunoselected CD3+ lymphocytes were used in additional 9 cases. Cytogenetic analysis
was performed according to standard banding techniques based on 20 metaphases, if
available. Clinical parameters studied included age, sex, overall survival, bone marrow
blast counts, and metaphase cytogenetics.
Cytogenetics and single nucleotide polymorphism array (SNP-A)
Technical details regarding sample processing for SNP-A assays were previously described.
36,37
Affymetrix 250K and 6.0 Kit (Affymetrix, Santa Clara, CA) were used. A stringent algorithm
was applied for the identification of SNP-A lesions. Patients with SNP-A lesions concordant
with metaphase cytogenetics or typical lesions known to be recurrent required no further
analysis. Changes reported in our internal or publicly-available (Database of Genomic
Variants; http://projects.tcag.ca/variation) copy number variation (CNV) databases
were considered non-somatic and excluded. Results were analyzed using CNAG (v3.0)
38
or Genotyping Console (Affymetrix). All other lesions were confirmed as somatic or
germline by analysis of CD3-sorted cells.
39
Whole exome sequencing
Whole exome sequencing was performed as previously reported.
15
Briefly, tumor DNAs were extracted from patients’ bone marrow or peripheral blood
mononuclear cells. For germline controls, DNA was obtained from either paired CD3
positive T cells. Whole exome capture was accomplished based on liquid phase hybridization
of sonicated genomic DNA having 150 – 200bp of mean length to the bait cRNA library
synthesized on magnetic beads (SureSelect®, Agilent Technology), according to the
manufacture’s protocol. SureSelect Human All Exon 50Mb kit was used for 20 cases (Supplementary
Table 1). The captured targets were subjected to massive sequencing using Illumina
HiSeq 2000 with the pair end 75–108 bp read option, according to the manufacture’s
instruction. The raw sequence data generated from HiSeq 2000 sequencers were processed
through the in-house pipeline constructed for whole-exome analysis of paired cancer
genomes at the Human Genome Center, Institute of Medical Science, University of Tokyo,
which are summarized in a previous report.
15
The data processing is divided into two steps,
Generation of a bam file (http://samtools.sourceforge.net/) for paired normal and
tumor samples for each case.
Detection of somatic single nucleotide variants (SNVs) and indels by comparing normal
and tumor BAM files. Alignment of sequencing reads on hg19 was visualized using Integrative
Genomics Viewer (IGV) software (http://www.broadinstitute.org/igv/).
40
Among all the candidates for somatic mutations, the accuracy of prediction of such
SNVs and indels by whole exome sequencing was tested by validation of 65 genes (80
events) by Sanger sequencing and targeted deep sequencing as described in Methods.
The prediction had true positive rate of 47% (39% for missense mutation, 75% for nonsense
mutations and 75% for indels). Of note is that prediction of known somatic mutations
(for example, TET2 (N=9), CBL (N=2), SETBP1 (N=2) and ASXL1 (N=2)) showed accuracy
of 100% (Supplementary Tables 2–4).
Targeted deep sequencing
For detecting allelic frequency of mutations or SNPs, we apply deep sequencing to
targeted exons as previously described.
15
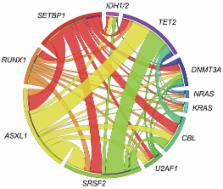
Briefly, we analyzed for possible mutations of SETBP1 and other genes which were concomitantly
mutated in the cases with SETBP1 mutation (U2AF1, DNMT3A, NRAS, ASXL1, SRSF2, CBL,
IDH1/2, SRSF2, TET2, PTPN11, RUNX1). Each targeted exon was amplified with NotI linker
attached to each primer. After digestion with NotI, the amplicons were ligated with
T4 DNA ligase and sonicated into up to 200bp fragments on average using Covaris. The
sequencing libraries were generated according to an Illumina pair-end library protocol
and subjected to deep sequencing on Illumina GAIIx or HiSeq 2000 sequencers according
to the standard protocol.
Sanger sequencing and allele-specific PCR
Exons of selected genes were amplified and underwent direct genomic sequencing by
standard techniques on the ABI 3730xl DNA analyzer (Applied Biosystems, Foster City,
CA) as previously described.
41–43
Coding and sequenced exons are shown in Supplementary Table 8. All mutations were
detected by bidirectional sequencing and scored as pathogenic if not present in non-clonal
paired CD3-derived DNA. When marginal volume of mutant clone size was not confirmed
by Sanger sequencing, cloning and sequencing individual colonies (TOPO TA cloning,
Invitrogen, Carlsbad, CA) was performed for validations. The allelic presence of p.Asp868Asn
and p.Gly870Ser alterations was determined by allele-specific PCR. Primers for SETBP1
sequencing and SETBP1 allele-specific PCR were provided in Supplementary Table 14.
Quantitative RT-PCR by TaqMan probes
Total RNA was extracted from bone marrow mononuclear cells and cell lines. cDNA was
synthesized from 500 ng total RNA using the iScript cDNA synthesis kit (BioRad, Hercules,
CA, USA). Quantitative gene expression levels were detected using real-time PCR with
the ABI PRISM 7500 Fast Sequence Detection System and FAM dye labeled TaqMan MGB probes
(Applied Biosystems). TaqMan probes for all genes analyzed were purchased from Applied
Biosystems gene expression assays products (SETBP1: Hs00210209_m1; HOXA9: Hs00365956_m1;
HOXA10: Hs00172012_m1; GAPDH: Hs99999905_m1). The expression level of target genes
was normalized to the GAPDH mRNA.
Retrovirus generation
pMYs-Setbp1 retrovirus expressing 3xFLAG-tagged wild-type Setbp1 protein and GFP marker
was described previously.
31
Point mutations of Setbp1 (p.Asp868Asn and p.Ile871Thr) were generated using the same
construct and QuickChange II site-directed mutagenesis kit (Agilent). Virus was produced
by transient transfection of Plat-E cells using Fugene 6 (Roche). Viral titers were
calculated by infecting NIH-3T3 cells with serially diluted viral stock and counting
GFP positive colonies 48 hours after infection.
Immortalization of myeloid progenitors
Immortalization of myeloid progenitors was performed as described.
31
Briefly, whole bone marrow cells harvested from young C57BL/6 mice were first cultured
in StemSpan medium (Stemcell Technologies) with 10 ng/ml mouse SCF, 20 ng/ml mouse
TPO, 20 ng/ml mouse IGF-2 (all from R&D Systems), and 10 ng/ml human FGF-1 (Invitrogen)
for 6 days to expand primitive stem and progenitor cells. Myeloid differentiation
was subsequently induced by growing the expanded cells in IMDM plus 20% heat-inactivated
horse serum with 100 ng/ml of mouse SCF (PeproTech, Rocky Hill, NJ) and 10 ng/ml of
mouse IL-3 for 4 days. 5 × 10⁵ resulting cells were subsequently infected with retrovirus
(1 × 10⁵ cfu) on plates coated with Retronectin (Takara) for 48 hours. Infected cells
were then continuously passaged at 1:10 ratio every 3 days for 4 weeks to test whether
the transduction causes immortalization of myeloid progenitors. In the absence of
immortalization of myeloid progenitors, transduced cultures generally cease expansion
in 2 weeks.
Methylation analysis
The DNA methylation status of bisulfite-treated genomic DNA was probed at 27,578 CpG
dinucleotides using the Illumina Infinium 27k array (Illumina) as previously described.
44
Briefly, methylation status was calculated from the ratio of methylation-specific
and demethylation-specific fluorophores (β-value) using BeadStudio Methylation Module
(Illumina).
Resistance of SETBP1 protein degradation associated with SETBP1 mutation
3xHA tagged full-length wild-type human SETBP1 cDNA was cloned from peripheral blood
mononuclear cells. Mutagenesis of SETBP1 (p.Asp868Asn and p.Ile871Thr) were performed
using PrimeSTAR Kit (Takara Bio co., Japan). Wild-type and mutant cDNAs were constructed
into the Lentivirus vector, CS-Ubc. Vector plasmids were co-transfected with packaging
and VSV-G- and Rev-expressing plasmids into 293-T cells and preparation of lentiviral
particles. Western blotting experiments of whole lysates from Jurkat cell line stably
transduced with wild-type and mutant SETBP1 were done with antibodies for HA (Covance)
and actin (Santa Cruiz). For proteasomal inhibition, the cell lines were treated with
Lactacystin 0.5µM (Peptide institute, Japan) and BafilomycinA1 0.25µM (Wako Junyaku,
Japan) for 2 hours.
Statistical analysis
The Kaplan-Meier method was used to analyze survival outcomes (overall survival) by
the log-rank test. Pairwise comparisons were performed by Wilcoxon test for continuous
variables and by 2-sided Fisher exact for categorical variables. Paired data was analyzed
by Wilcoxon signed-ranks test. For multivariate analyses, a Cox proportional hazards
model was conducted for overall survival. Variables considered for model inclusion
were IPSS risk group, age, sex, and gene mutational status. Variables with P<0.05
in univariate analyses were included in the model. The statistical analyses were performed
with JMP9 software (SAS, Cary, NC). Significance was determined at a two-sided alpha
level of 0.05, except for p values in multiple comparisons, for which were Bonferroni
correction was applied.
Supplementary Material
1
Related collections
Most cited references34
- Record: found
- Abstract: found
- Article: not found
International scoring system for evaluating prognosis in myelodysplastic syndromes.
P. Greenberg, C. Cox, M M LeBeau … (1997)
- Record: found
- Abstract: found
- Article: not found
Correction of X-linked chronic granulomatous disease by gene therapy, augmented by insertional activation of MDS1-EVI1, PRDM16 or SETBP1.
- Record: found
- Abstract: found
- Article: not found
Clonal architecture of secondary acute myeloid leukemia.
Matthew J. Walter, Dong Shen, Li Ding … (2012)