8
views
0
recommends
+1 Recommend
0 collections
    0
    shares
      • Record: found
      • Abstract: found
      • Article: found
      Is Open Access

      Comparison of amyloid PET measured in Centiloid units with neuropathological findings in Alzheimer’s disease

      research-article

      Read this article at

      Bookmark
          There is no author summary for this article yet. Authors can add summaries to their articles on ScienceOpen to make them more accessible to a non-specialist audience.

          Abstract

          Background

          The Centiloid scale was developed to standardise the results of beta-amyloid (Aβ) PET. We aimed to determine the Centiloid unit (CL) thresholds for CERAD sparse and moderate-density neuritic plaques, Alzheimer’s disease neuropathologic change (ADNC) score of intermediate or high probability of Alzheimer’s Disease (AD), final clinicopathological diagnosis of AD, and expert visual read of a positive Aβ PET scan.

          Methods

          Aβ PET results in CL for 49 subjects were compared with post-mortem findings, visual read, and final clinicopathological diagnosis. The Youden Index was used to determine the optimal CL thresholds from receiver operator characteristic (ROC) curves.

          Results

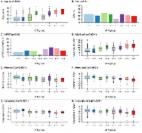
          A threshold of 20.1 CL (21.3 CL when corrected for time to death, AUC 0.97) yielded highest accuracy in detecting moderate or frequent plaque density while < 10 CL was optimal for excluding neuritic plaque. The threshold for ADNC intermediate or high likelihood AD was 49.4 CL (AUC 0.98). Those cases with a final clinicopathological diagnosis of AD yielded a median CL result of 87.7 (IQR ± 42.2) with 94% > 45 CL. Positive visual read agreed highly with results > 26 CL.

          Conclusions

          Centiloid values < 10 accurately reflected the absence of any neuritic plaque and > 20 CL indicated the presence of at least moderate plaque density, but approximately 50 CL or more best confirmed both neuropathological and clinicopathological diagnosis of Alzheimer’s disease.

          Supplementary information

          Supplementary information accompanies this paper at 10.1186/s13195-020-00587-5.

          Related collections

          Most cited references21

          • Record: found
          • Abstract: found
          • Article: not found

          National Institute on Aging-Alzheimer's Association guidelines for the neuropathologic assessment of Alzheimer's disease: a practical approach.

          We present a practical guide for the implementation of recently revised National Institute on Aging-Alzheimer's Association guidelines for the neuropathologic assessment of Alzheimer's disease (AD). Major revisions from previous consensus criteria are: (1) recognition that AD neuropathologic changes may occur in the apparent absence of cognitive impairment, (2) an "ABC" score for AD neuropathologic change that incorporates histopathologic assessments of amyloid β deposits (A), staging of neurofibrillary tangles (B), and scoring of neuritic plaques (C), and (3) more detailed approaches for assessing commonly co-morbid conditions such as Lewy body disease, vascular brain injury, hippocampal sclerosis, and TAR DNA binding protein (TDP)-43 immunoreactive inclusions. Recommendations also are made for the minimum sampling of brain, preferred staining methods with acceptable alternatives, reporting of results, and clinico-pathologic correlations.
            Bookmark
            • Record: found
            • Abstract: found
            • Article: not found

            Youden Index and optimal cut-point estimated from observations affected by a lower limit of detection.

            The receiver operating characteristic (ROC) curve is used to evaluate a biomarker's ability for classifying disease status. The Youden Index (J), the maximum potential effectiveness of a biomarker, is a common summary measure of the ROC curve. In biomarker development, levels may be unquantifiable below a limit of detection (LOD) and missing from the overall dataset. Disregarding these observations may negatively bias the ROC curve and thus J. Several correction methods have been suggested for mean estimation and testing; however, little has been written about the ROC curve or its summary measures. We adapt non-parametric (empirical) and semi-parametric (ROC-GLM [generalized linear model]) methods and propose parametric methods (maximum likelihood (ML)) to estimate J and the optimal cut-point (c *) for a biomarker affected by a LOD. We develop unbiased estimators of J and c * via ML for normally and gamma distributed biomarkers. Alpha level confidence intervals are proposed using delta and bootstrap methods for the ML, semi-parametric, and non-parametric approaches respectively. Simulation studies are conducted over a range of distributional scenarios and sample sizes evaluating estimators' bias, root-mean square error, and coverage probability; the average bias was less than one percent for ML and GLM methods across scenarios and decreases with increased sample size. An example using polychlorinated biphenyl levels to classify women with and without endometriosis illustrates the potential benefits of these methods. We address the limitations and usefulness of each method in order to give researchers guidance in constructing appropriate estimates of biomarkers' true discriminating capabilities. Copyright 2008 WILEY-VCH Verlag GmbH & Co. KGaA, Weinheim
              Bookmark
              • Record: found
              • Abstract: found
              • Article: found
              Is Open Access

              Age and sex specific prevalences of cerebral β-amyloidosis, tauopathy and neurodegeneration among clinically normal individuals aged 50-95 years: a cross-sectional study

              Summary Background A new descriptive classification scheme for biomarkers used in Alzheimer's and cognitive aging research, labeled ATN, was recently proposed. One implementation of this ATN construct dichotomizes biomarkers of amyloid, tau, and neurodegeneration/neuronal injury as normal or abnormal resulting in 2 × 2× 2=8 possible biomarker profiles. We determined the clinical characteristics and prevalence of each ATN group among clinically normal individuals aged 50 and older from a population based cohort. Methods All individuals in this study were participants in the Mayo Clinic Study of Aging, a population-based study of cognitive aging. Potential participants were randomly selected from the Olmsted County, Minnesota population by age- and sex-stratification and invited to participate in cognitive evaluations and undergo multimodality imaging. To be eligible for inclusion in this study, participants must have been judged clinically to have no cognitive impairment and have undergone multi-modality imaging. Imaging studies were obtained from October 11, 2006 to October 5, 2016. All participants were classified as having normal (A−) or abnormal (A+) amyloid using amyloid PET, normal (T−) or abnormal (T+) tau using tau PET, and normal (−) or abnormal (N+) neurodegeneration/neuronal injury using cortical thickness. The cut points used were SUVR 1·42 (centiloid 19) for amyloid PET, 1·23 SUVR for tau PET, and 2·67 mm for MRI cortical thickness. Age- and sex- specific prevalences of the eight ATN biomarker groups were determined using 435 individuals with amyloid PET, tau PET, and MR imaging and 1113 additional clinically normal individuals who underwent amyloid PET and MR imaging, but not tau PET imaging. Findings There were 165 A−T−N-, 35 A−T+N-, 63 A−T−N+, 19 A−T+N+, 44 A+T−N−, 25 A+T+N−, 35 A+T−N+, and 49 A+T+N+ individuals. Age differed by ATN group (p<0 001) ranging from a median age of 57 in the A−T−N-−and A−T+N− groups to 80 in the A+T−N+ and A+T+N+ groups. The frequency of APOE ε4 carriers differed by ATN group (p=0·04) with ε4 carriers roughly twice as frequent in A+ versus A−. White matter hyperintensity volume (p<0·0001), and cognitive performance (p<0·0001) also differed by ATN group. Tau PET and neurodegeneration biomarkers were discordant in the majority of individuals who would be labeled stage 2/3 preclinical AD (86% at age 65 and 51% at age 80) or suspected non-Alzheimer's pathophysiology (SNAP) (92% at age 65 and 78% at age 80). From age 50, A−T−N− prevalence declines while A+T+N+ and A−T+N+ increase continuously with age. In both men and women, A−T−N− is the most prevalent group until their late 70s. After about age 80, A+T+N+ is the most prevalent group until their late 70s. After about age 80, A+T+N+ is the most prevalent group. The remaining ATN groups reach individual peaks in the 60–90 age range and then decline in prevalence. By age 85 over 90% of men and women have one or more biomarker abnormalities. Interpretation Biomarkers of fibrillar tau deposition can be included with those of Aβ and neurodegeneration/neuronal injury to more fully characterize the heterogeneous pathological profiles in the population. The prevalence of each ATN group changes substantially with age with progression toward more biomarker abnormalities even among individuals who remain clinically normal. Both abnormal amyloid and normal amyloid pathological profiles can be identified in the clinically normal population.
                Bookmark

                Author and article information

                Contributors
                sanka.amadoru@austin.org.au
                Journal
                Alzheimers Res Ther
                Alzheimers Res Ther
                Alzheimer's Research & Therapy
                BioMed Central (London )
                1758-9193
                4 March 2020
                4 March 2020
                2020
                : 12
                : 22
                Affiliations
                [1 ]GRID grid.410678.c, Department of Molecular Imaging and Therapy, , Austin Health, ; 145 Studley Road, Heidelberg, Vic. 3084 Australia
                [2 ]GRID grid.492989.7, CSIRO Health and Biosecurity, ; Parkville, Victoria 3052 Australia
                [3 ]GRID grid.418025.a, ISNI 0000 0004 0606 5526, Victorian Brain Bank, , The Florey Institute of Neuroscience and Mental Health, ; Melbourne, Australia
                [4 ]GRID grid.1005.4, ISNI 0000 0004 4902 0432, Sydney Brain Bank, Neuroscience Research Australia and Faculty of Medicine, , University of NSW, ; Sydney, Australia
                [5 ]GRID grid.1013.3, ISNI 0000 0004 1936 834X, The Brain and Mind Centre, Faculty of Medicine and Health, , University of Sydney, ; Sydney, Australia
                Author information
                https://orcid.org/0000-0002-0522-6143
                https://orcid.org/0000-0002-8051-0558
                https://orcid.org/0000-0002-9259-8411
                https://orcid.org/0000-0002-0399-3218
                https://orcid.org/0000-0003-0422-8398
                https://orcid.org/0000-0002-8236-6561
                https://orcid.org/0000-0001-9317-0145
                https://orcid.org/0000-0003-3072-7940
                https://orcid.org/0000-0002-5832-9875
                https://orcid.org/0000-0003-3910-2453
                Article
                587
                10.1186/s13195-020-00587-5
                7057642
                32131891
                23ac1f50-be2f-423b-a473-618c3c684728
                © The Author(s) 2020

                Open AccessThis article is distributed under the terms of the Creative Commons Attribution 4.0 International License ( http://creativecommons.org/licenses/by/4.0/), which permits unrestricted use, distribution, and reproduction in any medium, provided you give appropriate credit to the original author(s) and the source, provide a link to the Creative Commons license, and indicate if changes were made. The Creative Commons Public Domain Dedication waiver ( http://creativecommons.org/publicdomain/zero/1.0/) applies to the data made available in this article, unless otherwise stated.

                History
                : 6 November 2019
                : 13 February 2020
                Categories
                Research
                Custom metadata
                © The Author(s) 2020

                Neurology
                amyloid imaging,alzheimer’s disease,centiloids,positron emission tomography,neuropathology

                Comments

                Comment on this article