- Record: found
- Abstract: found
- Article: found
Author Correction: Increased EphA4-ephexin1 signaling in the medial prefrontal cortex plays a role in depression-like phenotype
correction
Read this article at
There is no author summary for this article yet. Authors can add summaries to their articles on ScienceOpen to make them more accessible to a non-specialist audience.
Abstract
Correction to: Scientific Reports 10.1038/s41598-017-07325-2, published online 02
August 2017
This Article contains errors. The representative western blot bands do not agree with
the original western blot data shown in the respective Supplementary Figures in the
following original Figures:
Figure 1b (DG), 1c (NAc and CA3), 1e (CA3 and DG);
Figure 4c (PFC, NAc, and CA3), 4d (CA3), 4e (PFC, NAc, and DG), 4f (CA3);
Figure 6g and 6k.
The corrected Figures 1, 4, and 6 and accompanying legends appear below.
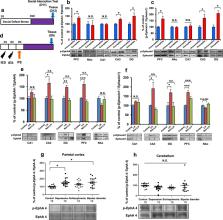
Figure 1
p-EphA4/EphA4 and p-ephexin1/ephexin1 ratios in the brain regions of mice with the
depression-like phenotype and the postmortem brains of depressed patients. (a) Schedule
of social defeat stress (10 days), social interaction test and brain sample collection.
(b and c) The ratios of p-EphA4/EphA4 and p-ephexin1/ephexin1 in the mouse brain regions
from social defeat stress (susceptible) mice and control (unsusceptible) mice. Data
represent the mean ± S.E.M. (n = 5 or 6). *P < 0.05 compared with the control group.
N.S.: not significant (Student’s t-test). (d) Schedule of learned helplessness (LH)
and brain sample collection. (e and f) The ratios of p-EphA4/EphA4 and p-Ephexin1/Ephexin1
in the rat brain regions from control, LH, and non-LH rats (n = 5–6). Data represent
the mean ± S.E.M. *P < 0.05, **P < 0.01 and ***P < 0.01 compared with the control
group. N.S.: not significant. (g and h): The ratios of p-EphA4/EphA4 in the postmortem
brain samples (parietal cortex and cerebellum) from control, depression, schizophrenia,
and bipolar disorder subjects. Data represent the mean ± S.E.M. (n = 15). *P < 0.05
compared with control group, N.S.: not significant.
Figure 4
Role of EphA4-ephexin1-Cdk5 signaling, BDNF-TrkB signaling and synaptic protein in
the antidepressant effect of rhynchophylline. (a) Schedule of social defeat stress
(10 days), drug treatment, and brain sample collection. (b) Western blot analysis
of EphA4 and p-EphA4 in the PFC, NAc, CA1, CA3, and DG of hippocampus. (c) Western
blot analysis of ephexin1 and p-ephexin1 in the PFC, NAc, CA1, CA3, and DG of hippocampus.
(d) Western blot analysis of p-Cdk5 (Tyr15)/Cdk5 in the PFC, NAc, CA1, CA3, and DG
of hippocampus. The values are expressed as percentages relative to those in the control
mice. The values represent the mean ± S.E.M. (n = 5 or 6). *P < 0.05 compared with
the vehicle + stressed group. N.S.: not significant. (e): Western blot of BDNF in
the PFC, NAc, CA1, CA3, and DG of hippocampus. (f): Western blot analysis of TrkB
and p-TrkB in the PFC, NAc, CA1, CA3, and DG of hippocampus. (g): Western blot analysis
of PSD-95 in the PFC, NAc, CA1, CA3, and DG of hippocampus. The values are expressed
as percentages relative to those in the control mice. The values represent the mean ± S.E.M.
(n = 5 or 6). *P < 0.05 compared with the vehicle + stressed group. N.S.: not significant.
Figure 6
Depression-like phenotype after bilateral injection of pAAV-PGK:: EphA4-Venus into
the mPFC. (a) Schedule of pAAV vector injection, drug treatment, and behavioral tests.
(b) Representative photographs of the injection sites and coronal brain sections in
the mPFC. The success of AAV vector injection into the mPFC was confirmed by the presence
of mRFP fluorescence. Scale bars = 200 μm (low-power images) and 20 μm (high-power
images). (c) LMT. (d) TST. (e) FST. (f) SPT. The values represent the mean ± S.E.M.
(n = 7). *P < 0.05 compared with the vehicle + EphA4 group. N.S.: not significant.
(g) p-EphA4/EphA4 ratio in the PFC. (h) p-Ephexin1/Ephexin1 ratio in the PFC. (i)
p-Cdk5(Tyr15)/Cdk5 ratio in the PFC. (j) BDNF in the PFC. (k) p-TrkB/TrkB ratio in
the PFC. (l) PSD-95 in the PFC. The values represent the mean ± S.E.M. (n = 5 or 6).
*P < 0.05 compared with the vehicle + EphA4 group. N.S.: not significant.
In addition, the Supplementary Information file published with this Article contains
errors.
In Supplementary Figure S5 the same original blot is shown for P-EphA4 and P-TrkB;
Supplementary Figure S4 is wrongly labelled to show the original western blots from
Figure 3;
Supplementary Figure S5 is wrongly labelled to show the original western data blots
from Figure 5.
The corrected Supplementary Information file is provided below and is updated to include
the following changes:
The correct original western blot data for the P-EphA4 panel in Supplementary Figure
S5A are provided;
Supplementary Figure S4 indicates now that it contains the original western blot data
from Figure 4;
Supplementary Figure S5 indicates now that it contains the original western blot data
from Figure 6;
The original western blot data for Figures S1 and S2 are shown in Supplementary Figure
S6.
Supplementary Information
Supplementary Information.
Related collections
Author and article information
Comments
Comment on this article
scite_