75
views
0
recommends
+1 Recommend
0 collections
    0
    shares
      • Record: found
      • Abstract: found
      • Article: found
      Is Open Access

      Increased spontaneous MEG signal diversity for psychoactive doses of ketamine, LSD and psilocybin

      research-article

      Read this article at

      Bookmark
          There is no author summary for this article yet. Authors can add summaries to their articles on ScienceOpen to make them more accessible to a non-specialist audience.

          Abstract

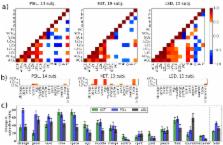
          What is the level of consciousness of the psychedelic state? Empirically, measures of neural signal diversity such as entropy and Lempel-Ziv (LZ) complexity score higher for wakeful rest than for states with lower conscious level like propofol-induced anesthesia. Here we compute these measures for spontaneous magnetoencephalographic (MEG) signals from humans during altered states of consciousness induced by three psychedelic substances: psilocybin, ketamine and LSD. For all three, we find reliably higher spontaneous signal diversity, even when controlling for spectral changes. This increase is most pronounced for the single-channel LZ complexity measure, and hence for temporal, as opposed to spatial, signal diversity. We also uncover selective correlations between changes in signal diversity and phenomenological reports of the intensity of psychedelic experience. This is the first time that these measures have been applied to the psychedelic state and, crucially, that they have yielded values exceeding those of normal waking consciousness. These findings suggest that the sustained occurrence of psychedelic phenomenology constitutes an elevated level of consciousness - as measured by neural signal diversity.

          Related collections

          Most cited references60

          • Record: found
          • Abstract: found
          • Article: not found

          A power primer.

          One possible reason for the continued neglect of statistical power analysis in research in the behavioral sciences is the inaccessibility of or difficulty with the standard material. A convenient, although not comprehensive, presentation of required sample sizes is provided here. Effect-size indexes and conventional values for these are given for operationally defined small, medium, and large effects. The sample sizes necessary for .80 power to detect effects at these levels are tabled for eight standard statistical tests: (a) the difference between independent means, (b) the significance of a product-moment correlation, (c) the difference between independent rs, (d) the sign test, (e) the difference between independent proportions, (f) chi-square tests for goodness of fit and contingency tables, (g) one-way analysis of variance, and (h) the significance of a multiple or multiple partial correlation.
            Bookmark
            • Record: found
            • Abstract: found
            • Article: not found

            Automated anatomical labeling of activations in SPM using a macroscopic anatomical parcellation of the MNI MRI single-subject brain.

            An anatomical parcellation of the spatially normalized single-subject high-resolution T1 volume provided by the Montreal Neurological Institute (MNI) (D. L. Collins et al., 1998, Trans. Med. Imag. 17, 463-468) was performed. The MNI single-subject main sulci were first delineated and further used as landmarks for the 3D definition of 45 anatomical volumes of interest (AVOI) in each hemisphere. This procedure was performed using a dedicated software which allowed a 3D following of the sulci course on the edited brain. Regions of interest were then drawn manually with the same software every 2 mm on the axial slices of the high-resolution MNI single subject. The 90 AVOI were reconstructed and assigned a label. Using this parcellation method, three procedures to perform the automated anatomical labeling of functional studies are proposed: (1) labeling of an extremum defined by a set of coordinates, (2) percentage of voxels belonging to each of the AVOI intersected by a sphere centered by a set of coordinates, and (3) percentage of voxels belonging to each of the AVOI intersected by an activated cluster. An interface with the Statistical Parametric Mapping package (SPM, J. Ashburner and K. J. Friston, 1999, Hum. Brain Mapp. 7, 254-266) is provided as a freeware to researchers of the neuroimaging community. We believe that this tool is an improvement for the macroscopical labeling of activated area compared to labeling assessed using the Talairach atlas brain in which deformations are well known. However, this tool does not alleviate the need for more sophisticated labeling strategies based on anatomical or cytoarchitectonic probabilistic maps.
              Bookmark
              • Record: found
              • Abstract: found
              • Article: found
              Is Open Access

              BrainNet Viewer: A Network Visualization Tool for Human Brain Connectomics

              The human brain is a complex system whose topological organization can be represented using connectomics. Recent studies have shown that human connectomes can be constructed using various neuroimaging technologies and further characterized using sophisticated analytic strategies, such as graph theory. These methods reveal the intriguing topological architectures of human brain networks in healthy populations and explore the changes throughout normal development and aging and under various pathological conditions. However, given the huge complexity of this methodology, toolboxes for graph-based network visualization are still lacking. Here, using MATLAB with a graphical user interface (GUI), we developed a graph-theoretical network visualization toolbox, called BrainNet Viewer, to illustrate human connectomes as ball-and-stick models. Within this toolbox, several combinations of defined files with connectome information can be loaded to display different combinations of brain surface, nodes and edges. In addition, display properties, such as the color and size of network elements or the layout of the figure, can be adjusted within a comprehensive but easy-to-use settings panel. Moreover, BrainNet Viewer draws the brain surface, nodes and edges in sequence and displays brain networks in multiple views, as required by the user. The figure can be manipulated with certain interaction functions to display more detailed information. Furthermore, the figures can be exported as commonly used image file formats or demonstration video for further use. BrainNet Viewer helps researchers to visualize brain networks in an easy, flexible and quick manner, and this software is freely available on the NITRC website (www.nitrc.org/projects/bnv/).
                Bookmark

                Author and article information

                Journal
                Sci Rep
                Sci Rep
                Scientific Reports
                Nature Publishing Group
                2045-2322
                19 April 2017
                2017
                : 7
                : 46421
                Affiliations
                [1 ]Sackler Centre for Consciousness Science, University of Sussex, Informatics Department , Brighton, BN1 9QJ, UK
                [2 ]Psychedelic Research Group, Centre for Psychiatry, Division of Brain Science, Imperial College London , W12 0NN, UK
                [3 ]School of Pharmacy, School of Psychology, University of Auckland , Auckland, 1010, New Zealand
                Author notes
                Article
                srep46421
                10.1038/srep46421
                5396066
                28422113
                1dba2a92-ed52-4816-9b7a-cfc7a1a331a7
                Copyright © 2017, The Author(s)

                This work is licensed under a Creative Commons Attribution 4.0 International License. The images or other third party material in this article are included in the article’s Creative Commons license, unless indicated otherwise in the credit line; if the material is not included under the Creative Commons license, users will need to obtain permission from the license holder to reproduce the material. To view a copy of this license, visit http://creativecommons.org/licenses/by/4.0/

                History
                : 25 November 2016
                : 15 March 2017
                Categories
                Article

                Uncategorized
                Uncategorized

                Comments

                Comment on this article