8
views
0
recommends
+1 Recommend
0 collections
    0
    shares
      • Record: found
      • Abstract: found
      • Article: not found

      Ultra-processed food consumption and excess weight among US adults

      Read this article at

      ScienceOpenPublisherPubMed
      Bookmark
          There is no author summary for this article yet. Authors can add summaries to their articles on ScienceOpen to make them more accessible to a non-specialist audience.

          Abstract

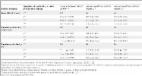
          Ultra-processed foods provide 58 % of energy intake and 89 % of added sugars in the American diet. Nevertheless, the association between ultra-processed foods and excess weight has not been investigated in a US sample. The present investigation therefore aims to examine the association between ultra-processed foods and excess weight in a nationally representative sample of US adults. We performed a cross-sectional analysis of anthropometric and dietary data from 15 977 adults (20–64 years) participating in the National Health and Nutrition Examination Survey 2005–2014. Dietary data were collected by 24-h recall. Height, weight and waist circumference (WC) were measured. Foods were classified as ultra-processed/non-ultra-processed according to the NOVA classification. Multivariable linear and logistic regression was used to evaluate the association between ultra-processed food consumption (% energy) and BMI, WC and odds of BMI≥25 kg/m 2, BMI≥30 kg/m 2 and abdominal obesity (men: WC≥102 cm, women: WC≥88 cm). Prevalence of BMI≥25 kg/m 2, BMI≥30 kg/m 2 and abdominal obesity was 69·2, 36·1 and 53·0 %, respectively. Consuming ≥74·2 v. ≤36·5 % of total energy from ultra-processed foods was associated with 1·61 units higher BMI (95 % CI 1·11, 2·10), 4·07 cm greater WC (95 % CI 2·94, 5·19) and 48, 53 and 62 % higher odds of BMI≥25 kg/m 2, BMI≥30 kg/m 2 and abdominal obesity, respectively (OR 1·48; 95 % CI 1·25, 1·76; OR 1·53; 95 % CI 1·29, 1·81; OR 1·62; 95 % CI 1·39, 1·89, respectively; P for trend<0·001 for all). A significant interaction between being female and ultra-processed food consumption was found for BMI ( F 4,79=4·89, P=0·002), WC ( F 4,79=3·71, P=0·008) and BMI≥25 kg/m 2 ( F 4,79=5·35, P<0·001). As the first study in a US population, our findings support that higher consumption of ultra-processed food is associated with excess weight, and that the association is more pronounced among women.

          Related collections

          Most cited references11

          • Record: found
          • Abstract: found
          • Article: not found

          Global, regional, and national prevalence of overweight and obesity in children and adults during 1980-2013: a systematic analysis for the Global Burden of Disease Study 2013.

          In 2010, overweight and obesity were estimated to cause 3·4 million deaths, 3·9% of years of life lost, and 3·8% of disability-adjusted life-years (DALYs) worldwide. The rise in obesity has led to widespread calls for regular monitoring of changes in overweight and obesity prevalence in all populations. Comparable, up-to-date information about levels and trends is essential to quantify population health effects and to prompt decision makers to prioritise action. We estimate the global, regional, and national prevalence of overweight and obesity in children and adults during 1980-2013. We systematically identified surveys, reports, and published studies (n=1769) that included data for height and weight, both through physical measurements and self-reports. We used mixed effects linear regression to correct for bias in self-reports. We obtained data for prevalence of obesity and overweight by age, sex, country, and year (n=19,244) with a spatiotemporal Gaussian process regression model to estimate prevalence with 95% uncertainty intervals (UIs). Worldwide, the proportion of adults with a body-mass index (BMI) of 25 kg/m(2) or greater increased between 1980 and 2013 from 28·8% (95% UI 28·4-29·3) to 36·9% (36·3-37·4) in men, and from 29·8% (29·3-30·2) to 38·0% (37·5-38·5) in women. Prevalence has increased substantially in children and adolescents in developed countries; 23·8% (22·9-24·7) of boys and 22·6% (21·7-23·6) of girls were overweight or obese in 2013. The prevalence of overweight and obesity has also increased in children and adolescents in developing countries, from 8·1% (7·7-8·6) to 12·9% (12·3-13·5) in 2013 for boys and from 8·4% (8·1-8·8) to 13·4% (13·0-13·9) in girls. In adults, estimated prevalence of obesity exceeded 50% in men in Tonga and in women in Kuwait, Kiribati, Federated States of Micronesia, Libya, Qatar, Tonga, and Samoa. Since 2006, the increase in adult obesity in developed countries has slowed down. Because of the established health risks and substantial increases in prevalence, obesity has become a major global health challenge. Not only is obesity increasing, but no national success stories have been reported in the past 33 years. Urgent global action and leadership is needed to help countries to more effectively intervene. Bill & Melinda Gates Foundation. Copyright © 2014 Elsevier Ltd. All rights reserved.
            Bookmark
            • Record: found
            • Abstract: found
            • Article: not found

            Consumption of ultra-processed foods predicts diet quality in Canada.

            This study describes food consumption patterns in Canada according to the types of food processing using the Nova classification and investigates the association between consumption of ultra-processed foods and the nutrient profile of the diet. Dietary intakes of 33,694 individuals from the 2004 Canadian Community Health Survey aged 2 years and above were analyzed. Food and drinks were classified using Nova into unprocessed or minimally processed foods, processed culinary ingredients, processed foods and ultra-processed foods. Average consumption (total daily energy intake) and relative consumption (% of total energy intake) provided by each of the food groups were calculated. Consumption of ultra-processed foods according to sex, age, education, residential location and relative family revenue was assessed. Mean nutrient content of ultra-processed foods and non-ultra-processed foods were compared, and the average nutrient content of the overall diet across quintiles of dietary share of ultra-processed foods was measured. In 2004, 48% of calories consumed by Canadians came from ultra-processed foods. Consumption of such foods was high amongst all socioeconomic groups, and particularly in children and adolescents. As a group, ultra-processed foods were grossly nutritionally inferior to non-ultra-processed foods. After adjusting for covariates, a significant and positive relationship was found between the dietary share of ultra-processed foods and the content in carbohydrates, free sugars, total and saturated fats and energy density, while an inverse relationship was observed with the dietary content in protein, fiber, vitamins A, C, D, B6 and B12, niacin, thiamine, riboflavin, as well as zinc, iron, magnesium, calcium, phosphorus and potassium. Lowering the dietary share of ultra-processed foods and raising consumption of hand-made meals from unprocessed or minimally processed foods would substantially improve the diet quality of Canadian.
              Bookmark
              • Record: found
              • Abstract: found
              • Article: found
              Is Open Access

              Ultra-Processed Food Products and Obesity in Brazilian Households (2008–2009)

              Background Production and consumption of industrially processed food and drink products have risen in parallel with the global increase in overweight and obesity and related chronic non-communicable diseases. The objective of this study was to analyze the relationship between household availability of processed and ultra-processed products and the prevalence of excess weight (overweight plus obesity) and obesity in Brazil. Methods The study was based on data from the 2008–2009 Household Budget Survey involving a probabilistic sample of 55,970 Brazilian households. The units of study were household aggregates (strata), geographically and socioeconomically homogeneous. Multiple linear regression models were used to assess the relationship between the availability of processed and ultra-processed products and the average of Body Mass Index (BMI) and the percentage of individuals with excess weight and obesity in the strata, controlling for potential confounders (socio-demographic characteristics, percentage of expenditure on eating out of home, and dietary energy other than that provided by processed and ultra-processed products). Predictive values for prevalence of excess weight and obesity were estimated according to quartiles of the household availability of dietary energy from processed and ultra-processed products. Results The mean contribution of processed and ultra-processed products to total dietary energy availability ranged from 15.4% (lower quartile) to 39.4% (upper quartile). Adjusted linear regression coefficients indicated that household availability of ultra-processed products was positively associated with both the average BMI and the prevalence of excess weight and obesity, whereas processed products were not associated with these outcomes. In addition, people in the upper quartile of household consumption of ultra-processed products, compared with those in the lower quartile, were 37% more likely to be obese. Conclusion Greater household availability of ultra-processed food products in Brazil is positively and independently associated with higher prevalence of excess weight and obesity in all age groups in this cross-sectional study.
                Bookmark

                Author and article information

                Journal
                applab
                British Journal of Nutrition
                Br J Nutr
                Cambridge University Press (CUP)
                0007-1145
                1475-2662
                May 6 2018
                : 1-11
                Article
                10.1017/S0007114518001046
                29729673
                0a493969-a773-487e-a8f5-3bad8c9a4e21
                © 2018
                History

                Comments

                Comment on this article