1
views
0
recommends
+1 Recommend
0 collections
    0
    shares
      • Record: found
      • Abstract: found
      • Article: found
      Is Open Access

      Socioeconomic inequalities in cancer incidence and mortality: An analysis of GLOBOCAN 2022.

      Read this article at

          There is no author summary for this article yet. Authors can add summaries to their articles on ScienceOpen to make them more accessible to a non-specialist audience.

          Abstract

          Given the recent updates in cancer burden estimates by GLOBOCAN 2022, this study was undertaken to provide pertinent perspectives within the context of the Human Development Index (HDI) and major world economies.

          Related collections

          Most cited references29

          • Record: found
          • Abstract: found
          • Article: not found

          Cancer statistics in China, 2015.

          With increasing incidence and mortality, cancer is the leading cause of death in China and is a major public health problem. Because of China's massive population (1.37 billion), previous national incidence and mortality estimates have been limited to small samples of the population using data from the 1990s or based on a specific year. With high-quality data from an additional number of population-based registries now available through the National Central Cancer Registry of China, the authors analyzed data from 72 local, population-based cancer registries (2009-2011), representing 6.5% of the population, to estimate the number of new cases and cancer deaths for 2015. Data from 22 registries were used for trend analyses (2000-2011). The results indicated that an estimated 4292,000 new cancer cases and 2814,000 cancer deaths would occur in China in 2015, with lung cancer being the most common incident cancer and the leading cause of cancer death. Stomach, esophageal, and liver cancers were also commonly diagnosed and were identified as leading causes of cancer death. Residents of rural areas had significantly higher age-standardized (Segi population) incidence and mortality rates for all cancers combined than urban residents (213.6 per 100,000 vs 191.5 per 100,000 for incidence; 149.0 per 100,000 vs 109.5 per 100,000 for mortality, respectively). For all cancers combined, the incidence rates were stable during 2000 through 2011 for males (+0.2% per year; P = .1), whereas they increased significantly (+2.2% per year; P < .05) among females. In contrast, the mortality rates since 2006 have decreased significantly for both males (-1.4% per year; P < .05) and females (-1.1% per year; P < .05). Many of the estimated cancer cases and deaths can be prevented through reducing the prevalence of risk factors, while increasing the effectiveness of clinical care delivery, particularly for those living in rural areas and in disadvantaged populations.
            Bookmark
            • Record: found
            • Abstract: found
            • Article: found
            Is Open Access

            Global, regional, and national age-sex specific mortality for 264 causes of death, 1980–2016: a systematic analysis for the Global Burden of Disease Study 2016

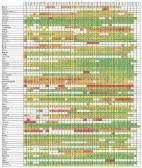
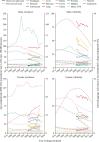
            Summary Background Monitoring levels and trends in premature mortality is crucial to understanding how societies can address prominent sources of early death. The Global Burden of Disease 2016 Study (GBD 2016) provides a comprehensive assessment of cause-specific mortality for 264 causes in 195 locations from 1980 to 2016. This assessment includes evaluation of the expected epidemiological transition with changes in development and where local patterns deviate from these trends. Methods We estimated cause-specific deaths and years of life lost (YLLs) by age, sex, geography, and year. YLLs were calculated from the sum of each death multiplied by the standard life expectancy at each age. We used the GBD cause of death database composed of: vital registration (VR) data corrected for under-registration and garbage coding; national and subnational verbal autopsy (VA) studies corrected for garbage coding; and other sources including surveys and surveillance systems for specific causes such as maternal mortality. To facilitate assessment of quality, we reported on the fraction of deaths assigned to GBD Level 1 or Level 2 causes that cannot be underlying causes of death (major garbage codes) by location and year. Based on completeness, garbage coding, cause list detail, and time periods covered, we provided an overall data quality rating for each location with scores ranging from 0 stars (worst) to 5 stars (best). We used robust statistical methods including the Cause of Death Ensemble model (CODEm) to generate estimates for each location, year, age, and sex. We assessed observed and expected levels and trends of cause-specific deaths in relation to the Socio-demographic Index (SDI), a summary indicator derived from measures of average income per capita, educational attainment, and total fertility, with locations grouped into quintiles by SDI. Relative to GBD 2015, we expanded the GBD cause hierarchy by 18 causes of death for GBD 2016. Findings The quality of available data varied by location. Data quality in 25 countries rated in the highest category (5 stars), while 48, 30, 21, and 44 countries were rated at each of the succeeding data quality levels. Vital registration or verbal autopsy data were not available in 27 countries, resulting in the assignment of a zero value for data quality. Deaths from non-communicable diseases (NCDs) represented 72·3% (95% uncertainty interval [UI] 71·2–73·2) of deaths in 2016 with 19·3% (18·5–20·4) of deaths in that year occurring from communicable, maternal, neonatal, and nutritional (CMNN) diseases and a further 8·43% (8·00–8·67) from injuries. Although age-standardised rates of death from NCDs decreased globally between 2006 and 2016, total numbers of these deaths increased; both numbers and age-standardised rates of death from CMNN causes decreased in the decade 2006–16—age-standardised rates of deaths from injuries decreased but total numbers varied little. In 2016, the three leading global causes of death in children under-5 were lower respiratory infections, neonatal preterm birth complications, and neonatal encephalopathy due to birth asphyxia and trauma, combined resulting in 1·80 million deaths (95% UI 1·59 million to 1·89 million). Between 1990 and 2016, a profound shift toward deaths at older ages occurred with a 178% (95% UI 176–181) increase in deaths in ages 90–94 years and a 210% (208–212) increase in deaths older than age 95 years. The ten leading causes by rates of age-standardised YLL significantly decreased from 2006 to 2016 (median annualised rate of change was a decrease of 2·89%); the median annualised rate of change for all other causes was lower (a decrease of 1·59%) during the same interval. Globally, the five leading causes of total YLLs in 2016 were cardiovascular diseases; diarrhoea, lower respiratory infections, and other common infectious diseases; neoplasms; neonatal disorders; and HIV/AIDS and tuberculosis. At a finer level of disaggregation within cause groupings, the ten leading causes of total YLLs in 2016 were ischaemic heart disease, cerebrovascular disease, lower respiratory infections, diarrhoeal diseases, road injuries, malaria, neonatal preterm birth complications, HIV/AIDS, chronic obstructive pulmonary disease, and neonatal encephalopathy due to birth asphyxia and trauma. Ischaemic heart disease was the leading cause of total YLLs in 113 countries for men and 97 countries for women. Comparisons of observed levels of YLLs by countries, relative to the level of YLLs expected on the basis of SDI alone, highlighted distinct regional patterns including the greater than expected level of YLLs from malaria and from HIV/AIDS across sub-Saharan Africa; diabetes mellitus, especially in Oceania; interpersonal violence, notably within Latin America and the Caribbean; and cardiomyopathy and myocarditis, particularly in eastern and central Europe. The level of YLLs from ischaemic heart disease was less than expected in 117 of 195 locations. Other leading causes of YLLs for which YLLs were notably lower than expected included neonatal preterm birth complications in many locations in both south Asia and southeast Asia, and cerebrovascular disease in western Europe. Interpretation The past 37 years have featured declining rates of communicable, maternal, neonatal, and nutritional diseases across all quintiles of SDI, with faster than expected gains for many locations relative to their SDI. A global shift towards deaths at older ages suggests success in reducing many causes of early death. YLLs have increased globally for causes such as diabetes mellitus or some neoplasms, and in some locations for causes such as drug use disorders, and conflict and terrorism. Increasing levels of YLLs might reflect outcomes from conditions that required high levels of care but for which effective treatments remain elusive, potentially increasing costs to health systems. Funding Bill & Melinda Gates Foundation.
              Bookmark
              • Record: found
              • Abstract: found
              • Article: found
              Is Open Access

              Cancer statistics in China and United States, 2022: profiles, trends, and determinants

              Background: The cancer burden in the United States of America (USA) has decreased gradually. However, China is experiencing a transition in its cancer profiles, with greater incidence of cancers that were previously more common in the USA. This study compared the latest cancer profiles, trends, and determinants between China and USA. Methods: This was a comparative study using open-source data. Cancer cases and deaths in 2022 were calculated using cancer estimates from GLOBOCAN 2020 and population estimates from the United Nations. Trends in cancer incidence and mortality rates in the USA used data from the Surveillance, Epidemiology, and End Results program and National Center for Health Statistics. Chinese data were obtained from cancer registry reports. Data from the Global Burden of Disease 2019 and a decomposition method were used to express cancer deaths as the product of four determinant factors. Results: In 2022, there will be approximately 4,820,000 and 2,370,000 new cancer cases, and 3,210,000 and 640,000 cancer deaths in China and the USA, respectively. The most common cancers are lung cancer in China and breast cancer in the USA, and lung cancer is the leading cause of cancer death in both. Age-standardized incidence and mortality rates for lung cancer and colorectal cancer in the USA have decreased significantly recently, but rates of liver cancer have increased slightly. Rates of stomach, liver, and esophageal cancer decreased gradually in China, but rates have increased for colorectal cancer in the whole population, prostate cancer in men, and other seven cancer types in women. Increases in adult population size and population aging were major determinants for incremental cancer deaths, and case-fatality rates contributed to reduced cancer deaths in both countries. Conclusions: The decreasing cancer burden in liver, stomach, and esophagus, and increasing burden in lung, colorectum, breast, and prostate, mean that cancer profiles in China and the USA are converging. Population aging is a growing determinant of incremental cancer burden. Progress in cancer prevention and care in the USA, and measures to actively respond to population aging, may help China to reduce the cancer burden.
                Bookmark

                Author and article information

                Journal
                Chin Med J (Engl)
                Chinese medical journal
                Ovid Technologies (Wolters Kluwer Health)
                2542-5641
                0366-6999
                Jun 20 2024
                : 137
                : 12
                Affiliations
                [1 ] Office of Cancer Screening, National Cancer Center/National Clinical Research Center for Cancer/Cancer Hospital, Chinese Academy of Medical Sciences and Peking Union Medical College, Beijing 100021, China.
                [2 ] Hangzhou Center for Disease Control and Prevention, Hangzhou, Zhejiang 310021, China.
                [3 ] The Third People's Hospital of Xiaoshan, Hangzhou, Zhejiang 311251, China.
                Article
                00029330-990000000-01042
                10.1097/CM9.0000000000003140
                11188912
                38616547
                a8b261fd-d79b-4b93-a082-6188e9df56eb
                History

                Comments

                Comment on this article