18
views
0
recommends
+1 Recommend
2 collections
    0
    shares
      • Record: found
      • Abstract: found
      • Article: found
      Is Open Access

      Trends in Outbreak-Associated Cases of COVID-19 — Wisconsin, March–November 2020

      research-article

      Read this article at

          There is no author summary for this article yet. Authors can add summaries to their articles on ScienceOpen to make them more accessible to a non-specialist audience.

          Abstract

          During September 3–November 16, 2020, daily confirmed cases of coronavirus disease 2019 (COVID-19) reported to the Wisconsin Department of Health Services (WDHS) increased at a rate of 24% per week, from a 7-day average of 674 (August 28–September 3) to 6,426 (November 10–16) ( 1 ). The growth rate during this interval was the highest to date in Wisconsin and among the highest in the United States during that time ( 1 ). To characterize potential sources of this increase, the investigation examined reported outbreaks in Wisconsin that occurred during March 4–November 16, 2020, with respect to their setting and number of associated COVID-19 cases. Outbreaks were defined as the occurrence of two or more confirmed COVID-19 cases* among persons who worked or lived together or among persons who attended the same facility or event, did not share a household, and were identified within 14 days of each other (by symptom onset date or sample collection date). During March 4–November 16, local and tribal health departments in Wisconsin reported suspected COVID-19 outbreaks to WDHS using established reporting criteria † ; 5,757 reported outbreaks meeting the outbreak definition were included in the analysis. Confirmed cases of COVID-19 that were linked § to these outbreaks were analyzed by symptom onset date (or sample collection date), the reported setting ¶ of the associated outbreak or outbreaks during three periods: before and during Wisconsin’s Safer At Home order** (March 4–May 12), summer and return-to-school (May 13–September 2), and the exponential growth phase †† (September 3–November 16). This activity was reviewed by CDC and was conducted in a manner consistent with applicable federal law and CDC policy. §§ A total of 57,991 confirmed cases of COVID-19 were linked to 5,757 outbreaks during March 4–November 16, accounting for 18.3% of 316,758 confirmed cases in Wisconsin during this period (Table). Overall, outbreaks at long-term care facilities (26.8%), correctional facilities (14.9%), and colleges or universities (15.0%) accounted for the largest numbers of outbreak-associated cases in Wisconsin. Before and during Wisconsin’s Safer At Home order, 4,552 outbreak-associated cases were linked to 507 reported outbreaks. Outbreaks at manufacturing or food processing facilities (2,146 cases; 47.1%) and long-term care facilities (1,324 cases; 29.1%) accounted for the majority of outbreak-associated cases during this period (Figure). During May 13–September 2, a total of 13,506 cases were linked to 2,444 outbreaks. Long-term care facilities (2,850 cases; 21.1%) and manufacturing or food processing facilities (2,672 cases; 19.8%) continued to account for the largest number of outbreak-associated cases during this period. However, a variety of other settings including restaurants and bars (1,633 cases; 12.1%) and other workplaces (1,320 cases; 9.8%) accounted for an increasing proportion of outbreak-associated cases until mid-August, when a sharp increase in college- and university-associated outbreaks was observed (1,739 cases; 12.9%). Beginning on September 3, COVID-19 cases in Wisconsin increased exponentially overall and within outbreak settings. During this phase of increasing community transmission, 39,933 cases were associated with 3,861 reported outbreaks, which accounted for 16.7% of 239,629 confirmed cases in Wisconsin. Among outbreak-associated cases, 11,386 (28.5%) were associated with long-term care facilities, 7,397 (18.5%) with correctional facilities, 7,178 (18.0%) with colleges or universities, and 5,703 (14.3%) with schools or child care facilities. During this period of exponential growth, the number of cases associated with long-term care and correctional facilities increased by an average of 24% and 23% per week, respectively. TABLE Laboratory-confirmed COVID-19 cases associated with outbreaks by settings, and period of the COVID-19 response — Wisconsin, March–November 2020 Outbreak setting No. (%) Mar 4–May 12 May 13–Sep 2 Sep 3–Nov 16 Total Long-term care facility 1,324 (29.1) 2,850 (21.1) 11,386 (28.5) 15,529 (26.8) College or university 36 (0.8) 1,739 (12.9) 7,178 (18.0) 8,689 (15.0) Correctional facility 307 (6.7) 964 (7.1) 7,397 (18.5) 8,661 (14.9) K–12 school or child care facility 10 (0.2) 461 (3.4) 5,704 (14.3) 6,145 (10.6) Food production or manufacturing facility* 2,146 (47.1) 2,672 (19.8) 3,631 (9.1) 8,436 (14.5) Restaurant or bar 82 (1.8) 1,633 (12.1) 917 (2.3) 2,628 (4.5) Retail or public establishment 45 (1.0) 814 (6.0) 1,053 (2.6) 1,902 (3.3) Event or gathering 39 (0.9) 761 (5.6) 1,113 (2.8) 1,885 (3.3) Health care facility 115 (2.5) 444 (3.3) 1,214 (3.0) 1,768 (3.0) Other group housing facility 249 (5.5) 352 (2.6) 781 (2.0) 1,375 (2.4) Other workplaces† 292 (6.4) 1,320 (9.8) 1,985 (5.0) 3,585 (6.2) Other settings 48 (1.1) 794 (5.9) 1,424 (3.6) 2,222 (3.8) Total§ 4,552 13,506 39,933 57,991 Abbreviations: COVID-19 = coronavirus disease 2019; K–12 = kindergarten through grade 12. * Includes food production and processing, meat processing, manufacturing facilities, and distribution or warehouse facilities. † Includes agriculture, farming, forestry, construction, contracting, office or other indoor workplace, public safety, transportation, and utilities. § Some cases were associated with multiple outbreak settings because multiple epidemiologic linkages were identified during the outbreak investigation; thus, the sum of all categories exceeds the total number of cases listed for each period.
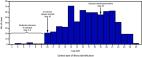
 FIGURE Trends* in the number of laboratory-confirmed COVID-19 cases associated with outbreaks, by setting † and period of the COVID-19 response — Wisconsin, March–November 2020 Abbreviations: COVID-19 = coronavirus disease 2019; K–12 = kindergarten through grade 12. * Data from November 10–16, 2020 are not displayed in the figure, but are represented in the counts that appear in text and footnotes. † All other categories includes restaurant or bar (4.2%), retail or other public establishment (3.1%), event or gathering (3.0%), health care facility (2.8%), other group housing (2.2%), other workplaces (5.7%), and other settings (3.5%). The figure is a line chart showing trends in the number of laboratory-confirmed COVID-19 cases associated with outbreaks, by setting and period, in Wisconsin during March–November 2020. Discussion The majority of outbreak-associated COVID-19 cases in Wisconsin occurred in long-term care facilities, correctional facilities, and colleges and universities; however, various settings were affected by COVID-19 outbreaks over the course of March–November 2020. During Wisconsin’s Safer At Home order, outbreaks were concentrated in manufacturing and food processing facilities, which continued to operate as essential businesses under the statewide order. This aligned with national data showing a high incidence of COVID-19 outbreaks at meat processing facilities across the United States during this time, including among beef and pork processing facilities in Wisconsin ( 2 ). During early summer (June–July), outbreaks continued to occur in long-term care facilities and manufacturing and food processing facilities; restaurants and bars, other workplaces, events, and other public establishments were increasingly reported as outbreak settings, which might have corresponded to fewer restrictions on social gatherings and decreased risk perception among some groups during this period ( 3 ). In late August, a rapid increase in cases associated with outbreaks at colleges and universities in Wisconsin occurred, correlating with return to campus for many of these institutions. This pattern was consistent with national trends for COVID-19 among young adults aged 18–22 years ( 4 ) and corresponded with outbreaks observed at colleges and universities in other states during this time ( 5 ). In Wisconsin, the college and university surge occurred at the beginning of a period of increasing community transmission, which was characterized by exponential growth in COVID-19 incidence across the state and a surge of outbreaks in high-risk congregate settings such as long-term care facilities and correctional facilities. The extent to which COVID-19 outbreaks on college and university campuses led to increased community transmission and subsequent outbreaks in other high-risk congregate settings could not be directly assessed in this investigation. Nonetheless, the temporal correlation observed builds on prior evidence of increased incidence of COVID-19 among U.S. counties where in-person university instruction occurred in August 2020 ( 6 ), suggesting that outbreaks on college and university campuses could represent early indicators of community transmission and should be prioritized for surveillance and mitigation planning. The findings in this report are subject to at least three limitations. First, an absence of reported outbreaks in some settings should not be interpreted as an absence of COVID-19 cases in these settings, because local and tribal health departments in Wisconsin directed limited resources to investigate outbreaks in high-risk congregate settings. Therefore, lower-risk settings might be underrepresented. Second, local and tribal health departments could not verify epidemiologic linkages for all cases in all outbreaks, and some outbreak-associated cases could have occurred in other settings not represented in this analysis. Finally, use of these surveillance data alone cannot determine whether outbreaks in one setting are directly responsible for increases in community transmission or outbreaks in other settings; more detailed epidemiologic or genomic data are needed to explore whether such temporal correlations are causally related. Examining trends in COVID-19 outbreaks over time provides an important indicator of COVID-19 incidence across sectors in response to changing behaviors and policies. State, local, and tribal health departments should continue to collect and report such information, particularly among highly affected sectors such as long-term care facilities and correctional facilities. Further, given the importance of college and university outbreaks as potential early indicators of outbreaks in other settings, colleges and universities should work with public health officials to strengthen surveillance and mitigation strategies to prevent COVID-19 transmission. Summary What is already known about this topic? COVID-19 incidence grew sharply in Wisconsin during September–November 2020; however, the underlying cause of this rapid growth is unknown. What is added by this report? An examination of COVID-19 outbreaks in Wisconsin showed that cases linked to outbreaks on college and university campuses increased sharply in August 2020 and were followed by outbreaks in other high-risk congregate settings. Overall, outbreaks at long-term care facilities (26.8%), correctional facilities (14.9%), and colleges or universities (15.0%) accounted for the largest numbers of outbreak-associated cases in Wisconsin. What are the implications for public health practice? COVID-19 surveillance and mitigation planning should be prioritized for highly affected settings such as long-term care facilities, correctional facilities, and colleges and universities, which could represent early indicators of broader community transmission.

          Related collections

          Most cited references5

          • Record: found
          • Abstract: found
          • Article: not found

          COVID-19 Among Workers in Meat and Poultry Processing Facilities ― 19 States, April 2020

          Congregate work and residential locations are at increased risk for infectious disease transmission including respiratory illness outbreaks. SARS-CoV-2, the virus that causes coronavirus disease 2019 (COVID-19), is primarily spread person to person through respiratory droplets. Nationwide, the meat and poultry processing industry, an essential component of the U.S. food infrastructure, employs approximately 500,000 persons, many of whom work in proximity to other workers (1). Because of reports of initial cases of COVID-19, in some meat processing facilities, states were asked to provide aggregated data concerning the number of meat and poultry processing facilities affected by COVID-19 and the number of workers with COVID-19 in these facilities, including COVID-19-related deaths. Qualitative data gathered by CDC during on-site and remote assessments were analyzed and summarized. During April 9-27, aggregate data on COVID-19 cases among 115 meat or poultry processing facilities in 19 states were reported to CDC. Among these facilities, COVID-19 was diagnosed in 4,913 (approximately 3%) workers, and 20 COVID-19-related deaths were reported. Facility barriers to effective prevention and control of COVID-19 included difficulty distancing workers at least 6 feet (2 meters) from one another (2) and in implementing COVID-19-specific disinfection guidelines.* Among workers, socioeconomic challenges might contribute to working while feeling ill, particularly if there are management practices such as bonuses that incentivize attendance. Methods to decrease transmission within the facility include worker symptom screening programs, policies to discourage working while experiencing symptoms compatible with COVID-19, and social distancing by workers. Source control measures (e.g., the use of cloth face covers) as well as increased disinfection of high-touch surfaces are also important means of preventing SARS-CoV-2 exposure. Mitigation efforts to reduce transmission in the community should also be considered. Many of these measures might also reduce asymptomatic and presymptomatic transmission (3). Implementation of these public health strategies will help protect workers from COVID-19 in this industry and assist in preserving the critical meat and poultry production infrastructure (4).
            Bookmark
            • Record: found
            • Abstract: found
            • Article: found
            Is Open Access

            Multiple COVID-19 Clusters on a University Campus — North Carolina, August 2020

            On September 29, 2020, this report was posted online as an MMWR Early Release. Preventing transmission of SARS-CoV-2, the virus that causes coronavirus disease 2019 (COVID-19), in institutes of higher education presents a unique set of challenges because of the presence of congregate living settings and difficulty limiting socialization and group gatherings. Before August 2020, minimal data were available regarding COVID-19 outbreaks in these settings. On August 3, 2020, university A in North Carolina broadly opened campus for the first time since transitioning to primarily remote learning in March. Consistent with CDC guidance at that time ( 1 , 2 ), steps were taken to prevent the spread of SARS-CoV-2 on campus. During August 3–25, 670 laboratory-confirmed cases of COVID-19 were identified; 96% were among patients aged <22 years. Eighteen clusters of five or more epidemiologically linked cases within 14 days of one another were reported; 30% of cases were linked to a cluster. Student gatherings and congregate living settings, both on and off campus, likely contributed to the rapid spread of COVID-19 within the university community. On August 19, all university A classes transitioned to online, and additional mitigation efforts were implemented. At this point, 334 university A–associated COVID-19 cases had been reported to the local health department. The rapid increase in cases within 2 weeks of opening campus suggests that robust measures are needed to reduce transmission at institutes of higher education, including efforts to increase consistent use of masks, reduce the density of on-campus housing, increase testing for SARS-CoV-2, and discourage student gatherings. University A students returned to residence halls during August 3–9, 2020, and in-person classes began on August 10. Mitigation steps taken to prevent the spread of SARS-CoV-2 on campus included scheduling move-in appointments across a 1-week period, decreasing classroom density to facilitate physical distancing, and reducing maximum dining hall capacity and increasing takeout options. Students were required to sign an acknowledgment of community standards and university guidelines recommending daily symptom checks, use of masks in all indoor common spaces and classrooms, physical distancing of ≥6 feet in indoor and outdoor settings, and limitations on group gatherings consistent with local guidelines (groups of no more than 10 persons indoors and 25 outdoors). Approximately 95% of students signed the acknowledgment; however, data on adherence to these important mitigation strategies were not available. Reentry testing for COVID-19 and quarantine before or after arrival on campus were not used ( 1 ). Except for two dormitories reserved for isolation and quarantine, residence halls opened at 60%–85% capacity, with most students in double rooms. Those at increased risk for severe illness from COVID-19, according to CDC guidance ( 3 ), had the option to request a single room. Undergraduate enrollment in university A for the fall semester was 19,690 students. Approximately 5,800 (29%) of these undergraduate students resided on campus as of August 10. In 2019, 83% of undergraduate students were North Carolina residents. By August 25, 670 laboratory-confirmed cases of COVID-19 with a specimen collection date for SARS-CoV-2 testing of August 3 or later had been identified among students, faculty, and staff members at university A (Figure). Cases were identified by the student health clinic (by self-report or through testing at the student health clinic or the university hospital testing center) or linked to a university cluster by the local health department. Initial information was collected by the university at the time of testing; the university also implemented contact tracing, isolation, and quarantine. Additional investigation of cases was conducted by the local health department for students who were tested off campus. Cases were classified according to the Council of State and Territorial Epidemiologists COVID-19 2020 Interim Case Definition ( 4 ). An additional 120 potential cases identified by the student health clinic had insufficient information to meet criteria for confirmed or probable COVID-19 and were not included in the analysis. Information on cases reported only to the university employee occupational health clinic, which is separate from the student health clinic, was not available for review at the time of analysis. FIGURE Confirmed COVID-19 cases among university A students, faculty, and staff members (N = 670), by earliest illness identification date — North Carolina, August 2020 Abbreviation: COVID-19 = coronavirus disease 2019. The figure is a histogram, an epidemiologic curve showing 670 confirmed COVID-19 cases among university A students, faculty, and staff members, by earliest illness identification date, in North Carolina during August 2020. Among 670 confirmed cases with specimen collection dates during August 3–25 for SARS-CoV-2 testing, median patient age was 19 years (range = 17–50 years), and 293 (47%) cases occurred in males (information on gender was missing for 47 [7%] patients). Information on school affiliation (e.g., undergraduate versus graduate/professional student, faculty, or staff member) was not consistently recorded; however, considering patient age <22 years as an indicator of undergraduate status, 643 (96%) cases were estimated to have occurred in undergraduate students; among these students, 230 (36%) resided on campus, and at least 51 (8%) were members of a fraternity or sorority and 51 (8%) were student athletes. For the remainder, place of residence, including if living at home or in shared apartments, was not readily available. As of August 25, no COVID-19 patients were hospitalized or had died, and no cases of multisystem inflammatory syndrome in children or adults were reported. One student was kept for extended observation in a hospital emergency department. Information on other clinical manifestations, such as myocarditis, was not available. Clusters were defined as the occurrence of five or more epidemiologically linked cases (e.g., common residence, sports team, or fraternal organization membership) within 14 days of one another (by earliest date of illness identification). During August 3–25, 18 clusters at university A were identified, eight in residence halls, five among students with membership in a fraternity or sorority, one in off-campus apartments, and four among athletic teams. Overall, 201 (30%) cases were linked to a cluster. Clusters ranged in size from five to 106 patients (median = five), with the largest cluster associated with a university-affiliated apartment complex. On August 19, when 334 (50%) university A–associated cases had been reported to the local health department, all university A classes transitioned to online, and efforts to reduce the density of on-campus housing commenced. Testing for SARS-CoV-2 was recommended for all persons living in residence halls with case clusters and was offered to all students at the student health clinic and the university hospital testing center. Students living in on-campus residence halls were required to return home unless they applied for and received a hardship waiver indicating they could remain on campus. All students returning home were instructed to self-quarantine for 14 days following departure from campus. Off-campus testing sites were set up both to meet community needs and target off-campus student housing complexes with multiple cases. Discussion Rapid increases in COVID-19 cases occurred within 2 weeks of opening university A to students. Based on preliminary case investigations, student gatherings and congregate living settings, both on and off campus, likely contributed to the rapid spread of COVID-19 on campus. This suggests the need for robust and enhanced implementation of mitigation efforts and the need for additional mitigation measures specific to this setting. The findings in this report are subject at least five limitations. First, the number of reported cases at university A is likely an underestimate. For example, some cases were reported to students’ home jurisdictions, some students did not identify themselves as students to the county health department, some students did not report to the student health clinic, and not all students were tested. Second, the number of students possibly infected through affiliation with a fraternity or sorority is likely underestimated. Some students might not have disclosed their fraternity or sorority membership, and other students (who were not members of fraternities or sororities) might have participated in unofficial rush events and parties. Third, limited information was available on housing arrangements for students not identified to live on campus, as well as information about the extent of social gatherings and adherence to masking and other important mitigation efforts. Fourth, cases had limited clinical follow-up; thus, the extent of longer-term clinical complications is not known. Finally, because information available on cases in faculty and staff members was limited, the contribution of faculty or staff members to COVID-19 spread on campus cannot be estimated. The rapid increase in COVID-19 cases among college-aged persons at university A underscores the urgent need to implement comprehensive mitigation strategies ( 5 , 6 ). In addition to enforcement of mask requirements, measures needed to reduce transmission in college and university settings might include efforts to reduce the density of on-campus housing, increase testing for SARS-CoV-2, and discourage student gatherings. Emerging findings from ongoing monitoring and evaluation efforts at universities and colleges in North Carolina and nationwide are helping to update best practices, including optimal testing strategies, for preventing SARS-CoV-2 transmission on campus and in the adjacent communities. Summary What is already known about this topic? Before August 2020, minimal data were available about outbreaks and disease transmission in institutes of higher education within the United States. What is added by this report? A North Carolina university experienced a rapid increase in COVID-19 cases and clusters within 2 weeks of opening the campus to students. Student gatherings and congregate living settings, both on and off campus, likely contributed to the rapid spread of COVID-19 in this setting. What are the implications for public health practice? Enhanced measures are needed to reduce transmission at institutes of higher education and could include reducing on-campus housing density, ensuring adherence to masking and other mitigation strategies, increasing testing for SARS-CoV-2, and discouraging student gatherings.
              Bookmark
              • Record: found
              • Abstract: found
              • Article: found
              Is Open Access

              Opening of Large Institutions of Higher Education and County-Level COVID-19 Incidence — United States, July 6–September 17, 2020

              During early August 2020, county-level incidence of coronavirus disease 2019 (COVID-19) generally decreased across the United States, compared with incidence earlier in the summer ( 1 ); however, among young adults aged 18–22 years, incidence increased ( 2 ). Increases in incidence among adults aged ≥60 years, who might be more susceptible to severe COVID-19–related illness, have followed increases in younger adults (aged 20–39 years) by an average of 8.7 days ( 3 ). Institutions of higher education (colleges and universities) have been identified as settings where incidence among young adults increased during August ( 4 , 5 ). Understanding the extent to which these settings have affected county-level COVID-19 incidence can inform ongoing college and university operations and future planning. To evaluate the effect of large colleges or universities and school instructional format* (remote or in-person) on COVID-19 incidence, start dates and instructional formats for the fall 2020 semester were identified for all not-for-profit large U.S. colleges and universities (≥20,000 total enrolled students). Among counties with large colleges and universities (university counties) included in the analysis, remote-instruction university counties (22) experienced a 17.9% decline in mean COVID-19 incidence during the 21 days before through 21 days after the start of classes (from 17.9 to 14.7 cases per 100,000), and in-person instruction university counties (79) experienced a 56.2% increase in COVID-19 incidence, from 15.3 to 23.9 cases per 100,000. Counties without large colleges and universities (nonuniversity counties) (3,009) experienced a 5.9% decline in COVID-19 incidence, from 15.3 to 14.4 cases per 100,000. Similar findings were observed for percentage of positive test results and hotspot status (i.e., increasing among in-person–instruction university counties). In-person instruction at colleges and universities was associated with increased county-level COVID-19 incidence and percentage test positivity. Implementation of increased mitigation efforts at colleges and universities could minimize on-campus COVID-19 transmission. The National Center for Educational Statistics’ Integrated Postsecondary Education Data System ( 6 ) was used to identify not-for-profit baccalaureate degree–granting colleges and universities enrolling ≥20,000 full-time and part-time students. Colleges and universities that enrolled 100 new COVID-19 cases in the most recent 7 days; 2) an increase in the most recent 7-day COVID-19 incidence over the preceding 7-day incidence; 3) a decrease of no more than 60% or an increase in the most recent 3-day COVID-19 incidence over the preceding 3-day incidence; and 4) a ratio of 7-day incidence to 30-day incidence exceeding 0.31. In addition to those four criteria, hotspots met at least one of the following criteria: 1) >60% change in the most recent 3-day COVID-19 incidence or 2) >60% change in the most recent 7-day incidence. FIGURE Trends* in COVID-19 testing rates (A, D), percentage test positivity (B, E), and incidence (C, F) for unmatched U.S. counties † and counties matched § based on population size and geographic proximity, 7-day moving average — United States, 2020 Abbreviation: COVID-19 = coronavirus disease 2019. * Trends are presented relative to the start date for fall 2020 classes for counties with large colleges and universities (university counties) and the assigned start date for nonuniversity counties. † University counties with remote (n = 22) and in-person (n = 79) instruction versus nonuniversity (n = 3,009) counties. § University counties with in-person instruction versus nonuniversity counties (68 matched pairs). Matches for each in-person university county were identified by listing all candidate (county) matches without large colleges or universities that had a similar population size (± 30%) and that were located within 500 miles (805 km) of each university county. From these candidate matches, the final match was selected based on closest proximity such that no nonuniversity county was matched more than once. After matching, the average distance between counties in matched in-person university county and nonuniversity county pairs was 114 miles (183 km) with a maximum distance of 471 miles (758 km). Eleven in-person university counties were excluded from the matched analysis because there were no candidate matches meeting population size and proximity specifications. All remote university counties were excluded from the matched analysis because there was an insufficient number of nonuniversity county matches. The figure is a series of line charts showing trends in COVID-19 testing rates (A, D), percentage test positivity (B, E), and incidence (C, F) for unmatched U.S. counties and counties matched based on population size and geographic proximity, 7-day moving average, in the United States, during 2020. COVID-19 outcomes were similar in the matched analysis. Compared with nonuniversity counties, in-person instruction university counties experienced a higher relative change in testing rates (18.8% versus –5.6%), a higher absolute change in test positivity (1.6% versus –0.8%), a higher relative change in incidence (78.3% versus –19.5%) (Table) (Figure), and a higher absolute change in the percentage identified as hotspots (33.8% versus 1.5%). Based on the difference-in-difference analysis, university counties with in-person instruction were associated with an increase of 14.4 cases per 100,000 (p<0.05) and an increase of 2.4 percent test positivity (p<0.05) relative to nonuniversity counties with in-person instruction. When adjusting incidence for the influx of full-time students, in-person instruction university counties were associated with an increase of 10.6 cases per 100,000 (p<0.05) (Supplementary Table, https://stacks.cdc.gov/view/cdc/99533). These results did not change meaningfully in the sensitivity analysis. Discussion County-level COVID-19 incidence decreased in much of the United States in late summer 2020. Comparing the 21 days before and after instruction start dates, university counties with in-person instruction experienced a 56% increase in incidence and 30% increase in hotspot occurrence as well as increases in COVID-19-related testing and test percentage positivity. Results from the unmatched analysis were consistent with those from the matched analysis. If percentage positivity had been stable or declining across the observation period, then efforts on the part of many colleges and universities to conduct or require testing before students’ return to campus and their ongoing surveillance efforts might explain an increase in case counts, as a result of increased case discovery. However, the concurrent increases in percentage positivity and in incidence in these counties suggest that higher levels of transmission, in addition to increased case discovery, occurred in these communities ( 2 ). The findings in this report are subject to at least six limitations. First, data abstraction for schools’ instructional formats was conducted in early September and focused on identifying the format used on the first day of classes; some misclassification of instructional format might have occurred because of changes during the first few weeks of instruction. Second, this study did not adjust for mitigation strategies (e.g., mask and social distancing requirements and limits on large crowds and athletic events) implemented at local or state levels or at colleges and universities, which could have affected the association between the institution’s opening and county-level incidence. Similarly, whether cases in university counties were college- or university-related (i.e., through contact in classrooms, dormitories, cafeterias, or off-campus activities) or related to community transmission could not be discerned. Third, these results might not be generalizable to counties with smaller colleges and universities. Fourth, U.S. Census 2019 population estimates were used to calculate rates, which do not include all college and university enrollments. County-level rate calculations could be inflated for university counties, especially those for which the enrollment numbers are relatively large compared with the county’s population size. Fifth, the longer-term implications for county incidence (i.e., beyond 21 days) were not assessed. Finally, the university counties in the unmatched analysis have larger populations and likely additional characteristics that are different from those of nonuniversity counties. This limitation prompted the decision to conduct the matched analysis, which focused on counties with more similar population levels and geographic proximity. However, broader generalizations based on the matched analysis might not be warranted because 11 university counties with in-person instruction were excluded from the matched analysis because no appropriate matches were available. COVID-19 incidence, hotspot occurrence, COVID-19-related testing, and test positivity increased in university counties with in-person instruction. Efforts to prevent and mitigate COVID-19 transmission are critical for U.S. colleges and universities. Congregate living settings at colleges and universities were linked to transmissions ( 7 ). Testing students for COVID-19 when they return to campus and throughout the semester might be an effective strategy to rapidly identify and isolate new cases to interrupt and reduce further transmissions ( 8 ). Colleges and universities should work to achieve greater adherence to the recommended use of masks, hand hygiene, social distancing, and COVID-19 surveillance among students ( 9 ), including those who are exposed, symptomatic, and asymptomatic. The increase in testing rates likely reflects local efforts already underway to improve COVID-19 surveillance and response. Increasing testing capacity and engaging in other COVID-19 mitigation strategies might be especially important for colleges and universities in areas where transmission from students into the broader community could exacerbate existing disparities, including access to and utilization of health care, as well as the disproportionate morbidity and mortality of COVID-19 among populations with prevalent underlying conditions associated with more severe outcomes following infection. Some university counties might have one or more concerning factors, such as higher levels of older adult populations, high rates of obesity and cardiovascular disease, or strained health care resources. These counties might need to consider the implications of in-person instruction on spread of COVID-19 among a student population that might have interactions with persons at higher risk in the community. College and university administrators should work with local decision-makers and public health officials to strengthen community mitigation, in addition to continuing efforts to slow the spread of COVID-19 on college and university campuses. Summary What is already known about this topic? Increasing COVID-19 incidence was observed among young adults in August 2020, and outbreaks have been reported at institutions of higher education (colleges and universities). What is added by this report? U.S. counties with large colleges or universities with remote instruction (n = 22) experienced a 17.9% decrease in incidence and university counties with in-person instruction (n = 79) experienced a 56% increase in incidence, comparing the 21-day periods before and after classes started. Counties without large colleges or universities (n = 3,009) experienced a 6% decrease in incidence during similar time frames. What are the implications for public health practice? Additional implementation of effective mitigation activities at colleges and universities with in-person instruction could minimize on-campus COVID-19 transmission and reduce county-level incidence.
                Bookmark

                Author and article information

                Journal
                MMWR Morb Mortal Wkly Rep
                MMWR Morb Mortal Wkly Rep
                WR
                Morbidity and Mortality Weekly Report
                Centers for Disease Control and Prevention
                0149-2195
                1545-861X
                29 January 2021
                29 January 2021
                : 70
                : 4
                : 114-117
                Affiliations
                Wisconsin Department of Health Services; CDC COVID-19 Response Team; Epidemic Intelligence Service, CDC; School of Medicine and Public Health, University of Wisconsin—Madison.
                Author notes
                Corresponding author: Ian Pray, ian.pray@ 123456dhs.wisconsin.gov .
                Article
                mm7004a2
                10.15585/mmwr.mm7004a2
                7842809
                33507887
                54fe8959-105a-4539-a326-2e34db7226e6

                All material in the MMWR Series is in the public domain and may be used and reprinted without permission; citation as to source, however, is appreciated.

                History
                Categories
                Full Report

                Comments

                Comment on this article