- Record: found
- Abstract: found
- Article: not found
Integration of electrophysiological recordings with single-cell RNA-seq data identifies novel neuronal subtypes
research-article
János Fuzik
1
,
2 ,
Amit Zeisel
1 ,
Zoltán Máté
4 ,
Daniela Calvigioni
1
,
2 ,
Yuchio Yanagawa
5 ,
Gábor Szabó
4 ,
Sten Linnarsson
1 ,
Tibor Harkany
1
,
2
21 December 2015
Read this article at

There is no author summary for this article yet. Authors can add summaries to their articles on ScienceOpen to make them more accessible to a non-specialist audience.
Abstract
Traditionally, neuroscientists have defined the identity of neurons by the cells’
location, morphology, connectivity and excitability. However, the direct relationship
between these parameters and molecular phenotypes establishing cellular heterogeneity
has remained largely unexplored. Here, we present a method to obtain full transcriptome
data from single neocortical pyramidal cells and interneurons after whole-cell patch-clamp
recordings in mouse brain slices. In our approach, termed Patch-seq, a patch-clamp
stimulus protocol is followed by aspirating the entire somatic compartment into the
recording pipette, amplification by single-cell tagged reverse transcription in a
tube reaction and Illumina sequencing. We show that Patch-seq reveals a close link
between electrophysiological characteristics, responses to acute chemical challenges
and RNA expression of neurotransmitter receptors and channels. Moreover, it distinguishes
neuronal subpopulations that correspond to both well-established and, to our knowledge,
hitherto undescribed neuronal subtypes. Our findings demonstrate the ability of Patch-seq
to precisely map neuronal subtypes and predict their network contributions in the
brain
The morphology, excitability, connectivity and neurotransmitter utilization of individual
neurons underlie the distinct computations each neuronal circuit can perform in the
nervous system
1-3
. Thus, the identification of distinct subclasses of neurons remains a key challenge
in neuroscience. Neuronal taxonomy based on a combination of developmental, morphological
and neurophysiological traits is well accepted, particularly for interneurons in the
cerebral cortex
4-6
. These classification systems primarily rely on candidate marker analysis by a mixture
of patch-clamp electrophysiology and single-cell semi-quantitative PCR (qPCR)
4,7-10
. More recently, advances in single-cell RNA sequencing (RNA-seq) in the central nervous
system
11-13
led to the identification of novel cell-types. Particularly, RNA-seq allowed the molecular
classification of neurons in the somatosensory cortex and CA1 subfield of the hippocampus
into 47 subtypes, including 16 subclasses of interneurons
11
. Despite pioneering work using microarrays
14-16
, multiplexed qPCR
17,18
and even proof-of-concept RNA-seq on single neurons
19
, no robust method exists to simultaneously investigate the electrophysiology, morphology
and transcriptome profiles of the same neuron. Combining patch-clamp electrophysiology
and post-hoc morphological reconstructions with the resolution of quantitative RNA-seq
in single neurons would present a potentially critical advance for neuronal classification
as it can resolve transcriptome-wide variations in gene expression to reveal cell-type-specific
determinants of neuronal cytoarchitecture and biophysical properties. Nevertheless,
only Qiu et al.
19
attempted RNA-seq on material taken from three neurons through a patch pipette without
prior patch-clamp recordings, which yielded RNA-seq data of variable quality.
Here, we describe Patch-seq, a method relying on sequencing RNA aspirated from the
soma of single patch-clamp-recorded neurons. We validate Patch-seq transcriptomes
by aligning them with larger single-cell datasets to achieve high-quality classification,
particularly to resolve cortical (inter-)neuron types previously considered homogenous
into distinct subtypes. We also show that Patch-seq is compatible with the post-hoc
morphological analysis of neurons in optically cleared tissues, and produces a quantitative
dataset that simultaneously resolves mRNAs for all known ion channels, receptors and
synaptic proteins. Acute pharmacological probing of cortical interneurons established
causality between RNA-seq-based predictions and experimentally observed neuronal responses
ex vivo. Thus, Patch-seq is suited to discover molecular determinants of neuronal
morphology and excitability.
Results
Data collection and characterization
We focused on cholecystokinin (CCK)-containing(+) GABAergic interneurons because their
morphological and molecular features are thought to form a quasi-continuum from axon-
to dendrite-targeting interneurons in cortical areas
3,5,11
. CCK+ interneurons are the plastic and dynamic gate-keepers of neuronal circuits
20
. Their inactivation likely contributes to anxiety, mood disorders and schizophrenia
21,22
. As reliable histochemical detection of CCK+ interneurons is particularly challenging,
we established a dual-labeled CCKBAC/dsRedT3::GAD67gfp/+ mouse reporter
23,24
(Fig. 1a, Supplementary Fig. 1a), and sampled dual DsRed+/GFP+ interneurons in layers
(L)1/2 of the somatosensory cortex. We took advantage of moderate CCK expression in
cortical pyramidal cells
11
(DsRed+ only) to build a reference database of electrophysiological and molecular
features that resolve cortical layer specificity for comparative analysis (Fig. 1a).
We first selected ~120 DsRed+ cortical neurons in total for patch-clamp electrophysiology
and morphological examination (as confirmed by epifluorescence microscopy prior to
recording; Fig. 1a), of which 83 cells proved suitable for combined electrophysiology
and RNA-seq analysis. Forty-five were interneurons (inhibitory types, “I-types”
;
Fig. 1b-f) and DsRed+/GFP+ with an additional 38 being pyramidal cells (excitatory
types, “Exc-types”; Supplementary Fig. 1b-d). We only discarded neurons if their access
resistance showed >20% deviation from baseline (Online Methods) or if their electrophysiology
parameters did not resemble any I-type cluster (3 cells; data not shown). For each
neuron, we recorded their location (cortical layer), and analyzed their passive and
active membrane properties through a series of custom-written routines for whole-cell
patch-clamp electrophysiology (on a HEKA EPC-10 controlled by PatchMaster 2.80; Supplementary
Table 1). We also combined patch-clamp electrophysiology, biocytin filling, chromogenic
(DAB) labeling and tissue clearing for the reconstruction of (axonal) morphology in
optically cleared tissues
25,26
(Fig 1b-f). Our visualization method is also compatible with light-sheet
27
or two-photon microscopy in whole brain slices (300-350-μm thick), thus significantly
reducing processing time and increasing the three-dimensional integrity of neuronal
morphology.
Functional and morphological analysis of CCK interneurons
The most common nomenclature for (inter-)neurons
6
combines key biophysical and morphological features. Based on their pattern of postsynaptic
target innervation, interneurons fall into one of three morphologically distinct subclasses:
axo-axonic, perisomatic or dendrite-targeting cells
3,5-7,28
. Here, we first used patch-clamp electrophysiology to classify DsRed+/GFP+ interneurons
in cortical L1 into 5 subclasses (“I-types 1-5, Fig. 1b-f, Supplementary Table 1 and
Online Methods) purely based on their electrophysiological properties: I-type 1 interneurons
exhibited action potential (AP) accommodation with a low adaptation ratio. They began
to spike at the onset of a rheobasic stimulus without producing a burst, demonstrated
the smallest AP amplitude, the largest afterhyperpolarization (AHP) and most hyperpolarized
resting membrane potential (Vrest, Fig. 1b). I-type 2 cells had accommodating AP trains
without producing burst firing. These cells displayed the highest AP amplitude, the
steepest AP upstroke slope and the highest firing frequency of all recorded neurons.
They did not demonstrate ’sag’ depolarization indicating the activation of hyperpolarization-activated
non-selective cationic currents (Fig. 1c). I-type 3 interneurons produced AP bursts,
shallowest AP upstroke and significant accommodation (Fig. 1d). Each AP burst consisted
of 3-4 spikes after the first AP on 2-times threshold current. These neurons had a
large afterdepolarization (ADP), as well as the largest ’sag’ depolarization. I-type
4 interneurons were accommodating cells that displayed a small ADP before a slow AHP;
yet this was insufficient to produce a burst (Fig. 1e). These neurons had the highest
input resistance amongst all interneuron subclasses examined. I-type 5 interneurons
exhibited irregular spiking, and fired APs without producing a burst (Fig. 1f). These
cells had a small amplitude ADP on the falling trajectory of the AHP rise, and had
the highest rheobase amongst the interneuron types assessed.
For comparison and validation, we examined the 38 pyramidal cells recorded in L2/3,
L4 and L5 (“Exc L2/3, L4 and L5”, Supplementary Fig. 1b-d, Supplementary Table 1 and
Online Methods). L2/3 and L4 pyramidal cells (DsRed only) were categorized as non-bursting,
accommodating and regular spiking (Supplementary Fig. 1b,c). In contrast, L5 pyramidal
cells exhibited higher input resistance and pronounced ADP and a 2nd consecutive AP
when stimulated at 2x the threshold current (Supplementary Fig. 1d).
Next, we used post-hoc morphological reconstructions to identify the axonal nests
and dendritic arbors of the 5 putative interneuron subtypes (Fig. 1b-f). Our analysis
revealed substantial differences in cell morphology, such as: I-type 1 interneurons
had equally-sized processes throughout, thus precluding their unequivocal assignment
as axons or dendrites at the light-microscopy level. These processes concentrated
in L1 and L2. I-type 1 cells maintained gap junctions with neighboring non-pyramidal
cells and even to L2/3 pyramidal cells, as shown by dye-loading experiments using
Lucifer yellow (see also Fig. 6a,b). I-type 2 interneurons had somatic diameters at
least twice of I-type 1 cells, and resided at the L1-L2 transition. Whereas their
dendrites intruded into both L1 and L2, their axons were almost exclusively located
in L2. I-type 3 interneurons, similar to I-type 1 cells, also had processes with homogenous
diameters
yet
all were less than half of the process thickness of I-type 1 cells. Their axonal arbor
was less branched with the majority of processes coursing in L2. I-type 4 cells had
the majority of their elaborate axonal nests concentrated in L2 with some collaterals
reaching as far as L4. Their dendrites targeted apically. I-type 5 interneurons branched
horizontally in L1 and upper L2. Rarely, we saw dye coupling between I-type 5 interneurons
and neighboring pyramidal cells, with less dense network labeling than for I-type
1 cells
.
Cumulatively, the above correlated electrophysiology and morphological differences
identify I-type 1-5 CCK+ interneurons as bona fide interneuron subtypes. Their distinct
features suggest a critical diversity of molecular determinants for cell identity,
which can be interrogated by single-cell RNA-seq.
RNA sequencing of somatic aspirates
We next developed a method, called Patch-seq, for performing single-cell RNA sequencing
on the same neurons that we characterized by patch-clamp electrophysiology. (Fig.
2, 3a-c and Online Methods). After testing the neurons in a series of current-clamp
and voltage-clamp protocols within 20-25 min (see above), their entire somatic compartment
was aspirated into the recording pipette. We found, using an iterative approach on
~140 cells (Supplementary Fig. 2), that applying a continuum of positive voltage pulses
(to membrane potential +20 mV from holding potential −5 mV, each 5 ms in length with
5 ms intervals) reduced the loss of RNA by most efficiently holding negatively-charged
RNA molecules in the pipette solution. Subsequently, the samples (0.8-0.9 μl) were
ejected into lysis buffer (0.6 μl; Online Methods). RNA-seq was performed using a
modified version of single-cell tagged reverse transcription (STRT-C1)
29,30
designed to handle low RNA input samples in a tube reaction (Online Methods).
Next, we subjected each sample to RNA-seq, generating 1.6 million raw reads per cell,
of which 40% mapped uniquely to 2,068 distinct genes (on average, using UCSC conservative
gene models, mainly protein-coding). On average, we observed 5,977 and 6,760 mRNA
molecules in excitatory and inhibitory neurons, respectively (Fig. 3d). This corresponds
to an absolute capture efficiency of 7% per mRNA molecule per cell, as inferred by
comparison with previously published single-cell data
11
. By comparison, RNA-seq of single neurons from the mouse neocortex can recover ~19,000
RNA molecules/neuron, mapped to ~5,000 distinct genes
11
, with a capture efficiency of ~20%. We attribute losses to procedural differences,
leakage during cell aspiration and/or binding of aspirated RNA to glass or plastic
surfaces. Pan-neuronal markers
11
Thy1 and Stmn2 were detected in 79% and 87% of the cells, respectively.
To validate the quality of our RNA-seq data, we compared the results from inhibitory
and excitatory neurons. As expected, I-type neurons expressed Gad1 (the gene encoding
GAD67; 41 of 45 cells) and Gad2 (the gene encoding GAD65; 39 of 45 cells), as well
as Cck (44 of 45 cells). Moreover, all subtypes of interneurons contained mRNAs for
the vesicular inhibitory amino acid transporter (Slc32a1)
31
but lacked either vesicular glutamate transporter 1 (Slc17a7) or 2 (Slc17a6)
32,33
. Subsets of these interneurons also expressed mRNAs for neuropeptides (Vip, Npy and
Crh) and Ca2+-binding proteins (Calb1; Fig. 1g, 3e), markers known to co-exist with
CCK in interneurons
5,6
. None of the cells (0/45) contained parvalbumin (Pvalb) mRNA transcripts. By contrast,
Exc-type pyramidal cells only expressed Slc17a7, and to a lesser extent Slc17a6, but
not Slc32a1 (0 of 38 cells), along with considerably lower copy numbers of Cck mRNA
(Fig. 3d). Thus, our RNA-seq data accurately reflect the major functional distinction
between inhibitory and excitatory neurons in the cerebral cortex. Examining the RNA
phenotypes of each of the 5 I-types amongst interneurons revealed a distinct pattern
of common molecular markers (Fig. 1g, 3e). Thus, at this level of analysis, there
was a one-to-one correspondence between transcriptionally- and electrophysiologically-defined
cell identities.
Mapping neuronal identities on single-cell RNA-seq datasets
Electrophysiology is inherently limited in throughput. Consequently, the molecular
classification of neurons from small and/or heterogeneous groups of cells is challenging
because of the resulting low statistical power. To increase the reliability of our
molecular classification, we took advantage of the single-cell dataset on somatosensory
cortex we recently generated
11
, containing >3,000 single-cell transcriptomes. We reasoned that if Patch-seq data
could be aligned to this much larger dataset, we would be able to assign electrophysiological
properties to molecularly better-defined neuronal subclasses. Even though this approach
is not mandatory for neuronal classification, the increasing availability of reference
datasets for major brain regions will enhance overall classification accuracy in small-sized
sample populations.
We built a correlation-based classifier to assign each neuron from Patch-seq to one
of the possible neuronal subtypes distinguished earlier
11
. The classifier used an iterative process of selecting relevant features (e.g., genes),
ranking the candidate groups by correlation with any measured cell, and removing groups
with lower correlation (Fig. 4a and Online Methods). None of the excitatory cells
(0/38) were classified as interneurons, whereas a single interneuron (1/45) was classified
as a L5 pyramidal cells (Fig. 4b).
The anatomical position, electrophysiology classification and molecular phenotype
of pyramidal cells with high certainty corroborated their layer-specific L2/3-L5 identities
(Fig. 4c). All of the measured interneurons were assigned to CCK+ subclasses (Fig.
4d). None of the “I-type” interneuron subdivisions was classified into a single group
molecularly. Instead, I-types 1 and 5 were aligned to one set of closely related interneurons
(Int11-Int14 in ref.
11
; Fig. 4d). Likewise, I-types 2 and 3 were assigned to Int5-Int8, forming another
subset of closely-related cell types. I-type 4 showed exceptional heterogeneity with
half of the cells assigned to each of these subsets. This shows that the combination
of patch-clamp and RNA-seq methods benefits from an increased power of classification
through the combination of real-life biophysical (and morphological) criteria and
statistical predictions.
Molecular candidates to determine interneuron excitability
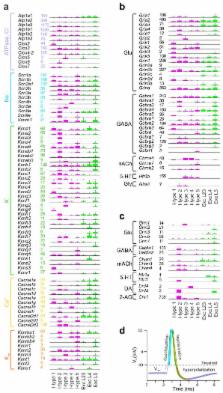
The depth of our molecular analysis allowed us to quantitatively assay the expression
of channels, ion pumps and receptors in the I-type interneurons (Fig. 5a-c). Having
our cells patch-clamp recorded, we could compare expression differences of any subunit
detected with membrane potential changes (Fig. 5d). For example, Na+/K+ adenosine
triphosphatase (ATPase) is a key electrogenic determinant of Vrest in excitable cells
34,35
. The quantitative expression of genes encoding ATPase subunits (Atp1a1-Atp1b3; Fig.
5a) closely and positively correlated with Vrest of each neuronal subtype in our dataset
(for Atp1a3 see Supplementary Fig. 3a).
Voltage-gated Cl− channels, a family of poorly understood ion channels
36
, are thought to modify Vrest by gating ion fluxes. Here, Clcn3 was shown to positively
correlate with Vrest (Supplementary Fig. 3b), potentially implicating these channels
in determining subthreshold membrane potential fluctuations.
For AP frequency modulation, Kv3.1 (Kcnc1), a delayed rectifier K+-channel, is broadly
assumed to confer the capacity to discharge at high frequencies upon prolonged depolarization
of fast-spiking interneurons
37
. Our data support this because interneurons firing in excess of pyramidal cells expressed
~3x higher RNA count/cell for Kcnc1 (p < 0.05 for the whole I-type cell population).
Similarly, coherence of the electrophysiology and RNA data was demonstrated by detecting
cyclic nucleotide-regulated ion channel Hcn1. We saw no expression in “I-type 1” cells,
where electrophysiology confirmed the lack of hyperpolarization-activated “sag” depolarization,
a biophysical consequence of Hcn1 activity (Fig. 1b; Supplementary Table 1). Thus,
our RNA-seq data will allow predictions for future neurophysiology studies interrogating
specific parameters of neuronal excitability.
Correlation matrix for use-dependent markers of neurons
Independent of any a priori classification, Patch-seq also permitted the analysis
of correlations between gene expression and electrophysiological parameters. Many
genes (748 out of 5,600) showed significant correlation with one or more electrophysiology
parameters. We took advantage of our quantitative datasets, and asked if rendering
mRNA copy numbers of ion channels and synapse-related proteins (167 passed our criteria,
Online Methods) as predictors returns meaningful association with specific biophysical
parameters of single APs or AP trains. We hypothesized that any sufficiently robust
correlation (filtered for correlation coefficients exceeding −0.4 and/or +0.4
11
; Supplementary Fig 4a,b) could be valuable for future studies if it allows for distinguishing
any CCK+ interneuron subtype. 24 genes (Clic4, Clip3, Cacna1g, Kcnma1, Kcnj11, Kcnc1,
Apba2, Cacna1g, Cadps2, Exoc8, Gria1, Grin2b, Htr7, Kcnma1, Npy, Pak1, Pcdh8, Slc32a1,
Slc6a17, Sort1, Stx4a, Syt6, Syt7, Tac2) had significant correlation with at least
one parameter (Supplementary Fig. 4d-i). The main advantage of this approach is that
it provides testable hypotheses by focusing on the preferential expression of genes
in one but not another subset of interneurons. For example, synuclein-γ (Sncg), synaptotagmin
7 (Syt7), vesicle-associated membrane protein 4 (Vamp4) and the GABA synaptic reuptake
transporter Slc6a1 were grouped together and associated with AP parameters. Although
the exact functional significance of these associations remains elusive, they provide
candidates for the future molecular dissection of neuronal networks under physiological
or pathological states.
Subtype-specific receptor repertoire in CCK interneurons
At any point in time, the intrinsic excitability of a neuron is dynamically tuned
by its afferent inputs. An advantage of our Patch-seq dataset is that it contains
information on most (if not all) ligand-gated ionotropic channels, metabotropic (G
protein-coupled) and other receptors, which determine the net network load on each
sampled neuron (Fig. 5a-c). This allows for inferences be made on the specificity
and heterogeneity of afferent inputs.
For example, fast glutamatergic transmission relies on α-amino-3-hydroxy-5-methyl-4-isoxazolepropionic
acid (AMPA) receptors expressed by all neurons. Its subunits, GluR1 (Gria1)-GluR4
(Gria4), are differentially expressed in various neuronal subtypes. As such, the fast
kinetics of AMPA receptor inactivation and desensitization in interneurons is usually
explained by their low levels of GluR2 (Gria2) subunit
38
. Here, we sampled 210 Gria1 mRNAs in total in 45 interneurons (4.46 ± 5.3 mRNA molecule/cell)
and 283 mRNAs cumulatively in 38 pyramidal cells (8.57 ± 8.08 mRNA molecule/cell;
p < 0.05, mean difference of 3.61; Fig. 5b), thus quantitatively recapitulating earlier
predictions by histochemistry and channel neurophysiology. Next, we examined the expression
of the type 1 cannabinoid receptor (Cnr1) in our sample, which was reported to be
highest in CCK+ interneurons in the brain
39,40
. Here, we find that I-type 1 cells lack appreciable Cnr1 mRNA expression (12 Cnr1
mRNA molecules in total), which contrasts with I-type 2-5 subclasses (678 Cnr1 mRNAs
in total; Fig. 5c). These differences suggest another hitherto undescribed level of
molecular complexity amongst cortical CCK+ interneurons.
Many developmental biology studies utilize the serotonin (5-HT) receptor 3a (Htr3a)
subtype to detect and classify CCK interneurons
4,41
. In our Patch-seq dataset, we observed no 5-HT3a expression in I-type 1 cells (Fig.
6a,c), low Htr3a mRNA expression in I-type 2 (Calb
+/Npy
+
/Vip
−) cells and high mRNA copy numbers in I-type 3 (Vip
+/Npy
−) and I-type 4 (Vip
+/Npy
+, Fig. 6b,c) and I-type 5 (Vip
−/Npy
+) interneurons. This suggests that Htr3a expression amongst CCK+ interneurons might
be more restricted than initially thought, likely leading to the under-sampling of
CCK interneurons by Htr3a-driven genetic tags
41
.
Subsequently, we expanded our analysis to all Htr1a-Htr7 subtypes (Fig. 6c). None
of the CCK+ interneurons contained Htr1a, Htr1b or Htr1d mRNAs. Notably, I-type 1
cells contained no mRNA copy for any of the 5-HT receptors. We validated our Patch-seq
results by measuring the excitatory effect of 5-HT on I-type 1 (n = 4) vs. I-type
4 (n = 4) interneurons (Fig. 6a,b) in whole-cell current-clamp experiments. While
clamping the cells to 0 pA, 5 μM (data not shown) and 25 μM 5-HT (Fig. 6d,e
upper trace) was bath-applied. Both subthreshold depolarization with 5 μM and suprathreshold
depolarization with 25 μM 5-HT
42-44
was observed in both I-type 1 and 4 interneurons. To dissect the origin of the depolarizing
5-HT effect and rule out indirect effects imposed by the neuronal network the recorded
cell was embedded into, 10 μM 5-HT was microejected (”puffed”) onto interneuron somata.
We controlled equal 5-HT load by coapplying a fluorescent tracer (Fig. 6d,e
middle). Direct 5-HT application onto I-type 1 interneurons did not cause depolarization
(Fig. 6d, bottom). By contrast, I-type 4 interneurons became readily depolarized (Fig.
6e, bottom). Our pharmacological rsults thus establish causality, considering that
RNA-seq predicts 5-HT insensitivity in I-type 1 interneurons due to the lack of any
metabortopic or ionotropic 5-HT receptors. Moreover, the morphological reconstruction
of the sampled interneurons (Fig 6a,b) is explanatory towards the depolarization of
I-type 1 cells upon bath application of 5-HT: I-type 1 interneurons were dye-coupled
to neighboring cortical non-pyramidal neurons, and even pyramidal cells. This allowed
for interneurons to synchronize their membrane potentials through gap junctions
45
, assigning I-type 1 cells as ”passive followers” of network depolarization at suprathreshold
5-HT load. Thus, our Patch-seq data primed us to identify a CCK+ interneuron with
a 5-HT-driven effector behavior in its L1 microcircuit even if itself lacked 5-HT
receptors. Overall, we suggest that our Patch-seq approach will help future systems
(neuro-)biology investigations to rationalize diverse functional outcomes by providing
a platform of identifying marks for specific modalities amongst neurons.
Discussion
The brain undoubtedly exhibits the highest level of cellular heterogeneity
10
, and contains an large variety of neurons that differ in their morphology, connectivity,
biophysical parameters and molecular phenotypes
5,6,46
. The taxonomy for neurons dates back to the first pioneers of neuroanatomy (e.g.,
Cajal and Golgi), who exclusively used morphological features, such as the size and
topography of axonal and dendritic arbors, for classification and is now based on
a wide array of neurophysiology, advanced histochemistry and RNA analyses
6
. Nevertheless, reliance on known candidate marks continued to dominate, and delayed
the inception of unbiased classification. Moreover, the limited number of markers
that could be probed at any given time (~20 for single-cell PCR and histochemistry)
7
together with the often mutually-exclusive experimental conditions that neurophysiology
and single-cell molecular biology tools require limited detailed fingerprinting of
cellular components in the brain.
We combined mouse genetics and patch-clamp electrophysiology to successfully target
a distinct cohort of interneurons
5,47
in order to overcome existing limitations of classical function-structure analyses.
In the CCK+ cell population studied, we expected considerable neuronal diversity,
which allowed us to improve and optimize Patch-seq to its present accuracy, even when
low copy numbers of mRNA molecules were present. We first classified our CCK+ interneuron
sample from L1/L2 (but not from deep cortical layers
11
or hippocampal subfields
5,47
) into the 5 commonly identified subtypes. We further showed that Patch-seq can identify
a select number of molecular determinants that can be used to further subdivide CCK+
interneuron subclasses. Each of these examples is significant because they reconcile
previously reported sets of data on receptors (5Ht3a, Cnr1) and channels (Hcn1). We
also note that Patch-seq can discover sets of cellular markers independent of other
classification systems or a priori knowledge of the cell-type of interest
.
We also show that Patch-seq can help to form hypotheses e.g. about neurotransmitter-receptor
relationships. We expect that similar approaches can be applied to essentially any
neuronal subtype, and will help to avoid false-negative data (due to under-sampling
of neuronal contingents) in cases when the resolution of available histochemical tools
is limited or if suitable reagents are not available. As such, the lack of Rgs12,
Htr3a and Cnr1 mRNA transcripts in I-type 1 interneurons raises the possibility that
this abundant subclass might have been systematically missed in prior genetic reporter
analyses, curtailing the analysis of their contribution to fundamental cortical network
events.
The efficiency of mRNA capture in Patch-seq is lower than that in single-cell RNA-seq
on dissociated tissues. However, it is still sufficient to efficiently sample even
“low” expressed genes because of its extremely low rate of false-positive identification
11,12
. Thus, mRNA copy numbers even at the range of 1-5 molecules return meaningful associations.
Moreover, the combination of Patch-seq with transgenic mouse technologies might allow
the future exploitation of external (“spike-in”) reference standards (e.g. transgene
products), thus facilitating positive cell identification. These methods together
with the progressive decoding of regional heterogeneity in the nervous system through
large-scale RNA-seq databases
11-13
can increase the stringency of neuronal classification. Such “reference atlases”,
once available, will allow for precise hierarchical landscapes be built even when
cell numbers from patch-clamp electrophysiology experiments are limited. However,
Patch-seq can stand alone and give much more complete and accurate information about
gene expression (~2,000 genes per cell) in selectively probed cell contingents, compared
to previous methods (e.g. qPCR for 10-20 genes/cell)
6,7
.
Patch-seq samples somatic material upon aspiration. For neurons, dendrites and axons
occupy large spaces and their intracellular volume is considered significant. Therefore,
one may argue that Patch-seq misses many mRNAs that are preferentially targeted to
distant domains of axons or dendrites. Although some mRNA is actively transported
into neurites
48
, this does not mean that they are absent from the soma. On the contrary, most (if
not all) mRNA species are more abundant in the soma than in neurites, and there is
not a single known case of an mRNA that is localized exclusively outside the soma.
This is true even for mRNAs thought to be actively transported into neurites, such
as CamKIIα and spinophilin
49
. It is also known that the axon and dendrite contain much less total mRNA than the
soma: axons are thought to contain about 1,000 – 4,500 mRNAs, whereas dendrites contain
>2,500 mRNAs
49
. These numbers are at least an order of magnitude lower than the soma (which contains
>100,000 mRNAs). As a result, sequencing the soma content can be expected to give
a representative view of mRNA expressed by a neuron, although without information
on which mRNAs are more or less efficiently transported into the neurites.
Another technical element that needs to be tightly controlled is the length of electrophysiology
recordings because electrical stimuli might alter the transcriptome. Here, we used
20-25 min protocols, which are compatible with the life-time of mRNA being on the
order of many hours (median: 9 hours) with none being known as shorter than 1 hour
50
. The quickest transcriptional response known in any setting is the induction of immediate
early genes (e.g., c-Fos, Jun, Egr2), and can be detectable after 30 min but peaks
at 3 hours. However, removing immediate early genes did not affect cell-type identification.
Thus, the impact of patch-clamp recordings that occur on a timescale less than one
hour can be expected to have minimal impact on the RNA transcriptome.
In conclusion, Patch-seq can be expected to facilitate the characterization of transcriptome-wide
changes in many experimental settings, thus contributing to a better understanding
of fundamental physiological and pathological processes.
Online methods
Animals and husbandry
We generated a dual reporter mouse line (Supplementary Fig. 1a) by crossing parental
lines that either expressed Discosoma red fluorescent protein (DsRed) under regulatory
elements of the cholecystokinin (CCK) promoter on a bacterial artificial chromosome
(BAC/CCK-DsRed)
24
or green fluorescent protein (GFP) knocked into the glutamate decarboxylase 67 gene
(GAD67+/gfp)
23
. The resulting CCKBAC/DsRed::GAD67+/gfp line appeared anatomically normal, particularly
without changes to brain size or deformities to its fine structures, including normal
cell proliferation, migration (data not shown) and laminar distribution (Supplementary
Fig. 1a). Animals were group-housed under 12:12 h/h light/dark cycle with ad libitum
access to water and food. Animals of both sexes were used for neurophysiology experiments
during postnatal days 17-23. Experiments on live animals conformed to the 86/609/EEC
directive and were approved by the regional authorities on animal ethics (Stockholm
Norra Djuretiska Nämnd; N512/12; Tierversuchsgesetz 2012, BGBI, Nr. 114/2012).
Preparation of brain slices, correlated differential-interference contrast and epifluorescence
microscopy, superfusion
All experiments on interneurons were performed in L1/2 of the primary somatosensory
cortex (S1). Coronal slices (300-μm thickness) were prepared on a VT1200S vibratome
(Leica, Germany) in ice-cold artificial cerebrospinal fluid containing (in mM): 90
NaCl, 2.5 KCl, 1.25 Na2HPO4, 0.5 CaCl2, 8 MgSO4, 26 NaHCO3, 20 D-glucose, 10 4-(2-hydroxyethyl)-1-piperazineethanesulfonic
acid (HEPES), 3 Na-pyruvate, 5 Na-ascorbate (pH 7.4). Brain slices were then incubated
at 22-24 °C for 60 min in a “recording” solution containing (in mM): 124 NaCl, 2.5
KCl, 1.25 Na2HPO4, 2 CaCl2, 2 MgSO4, 26 NaHCO3, 10 D-glucose (pH 7.4). All constituents
were from Sigma-Aldrich. Both solutions were aerated with carbogen (5% CO2/95% O2).
Temperature was set to 33 °C (TC-10, Npi, Germany) in the recording chamber. Brain
slices were superfused with “recording” solution at a rate of 4-6 ml/min.
Neurons were visualized by differential interference contrast microscopy on an Olympus
BX51WI microscope. Next, the co-existence of DsRed and GFP in interneurons was confirmed
by epifluorescence microscopy using a mercury arc light source (USH-1030L, USHIO)
and appropriate combinations of band- and long-pass excitation/emission filters (for
GFP: U-MWIG3 [excitation: 460-495 nm; emission: 510-550 nm]; for DsRed: U-MWIBA3 [excitation:
530-550 nm; emission: >575 nm]).
Serotonin (5-HT; Tocris) was directly dissolved in the recording solution at final
concentrations of 5 μM, 10 μM and 25 μM, and superfused at flow rates as above. Focal
5-HT ejection was performed using a microinjector (PDES-02TX-LA, Npi, Germany) after
filling borosilicate glass capillaries (Hilgenberg, 3-4 MΩ) with 10 μM 5-HT. Pressure
pulses of 500 mbar for 0.5 s were used with 30 s intervals. Pharmacological probing
of the interneurons was carried out at 33°C.
Patch-clamp electrophysiology
Recordings were carried out with borosilicate glass electrodes (Hilgenberg, Germany)
of 3-4 MΩ pulled on a P-1000 instrument (Sutter, USA). Electrodes were filled with
an intracellular solution containing (in mM): 130 K-gluconate, 6 NaCl, 4 ATP-Na2,
0.35 GTP-Na2, 8 phosphocreatine-Na2, 10 HEPES, 0.5 ethyleneglycolbis(2-aminoethylether)-N,N,N',N'-tetraacetate
(EGTA) and 0.5 mg/ml biocytin (pH 7.2 set with KOH). Whole-cell patch-clamp recordings
were made on an EPC-10 triple amplifier (HEKA, Germany). Current clamp recordings
were corrected for −9.99 ± 0.38 mV liquid junction potential between the intracellular
and recording solutions, as measured against a 3M KCl-electrode. Resting membrane
potential (Vrest, expressed as mVs) was measured in current-clamp mode at 0 pA current.
Input resistance (Rm, expressed as MΩ) was calculated using linear regression established
between electrotonic voltage responses (±15 mV from Vrest) and 500-ms current steps
of increasing amplitude (10 pA increments). Membrane time constant (τ, ms) was averaged
from 20 successive electrotonic voltage responses to hyperpolarizing (−40 pA) current
steps and fitted with a single exponential. The “sag” depolarization, indicating the
activation of hyperpolarization-activated non-selective cationic current (I
h
) was calculated as the ratio of the peak negative voltage and steady-state negative
voltage at a voltage response to hyperpolarizing current injections resulting in a
steady-state voltage of −100 mV. AP threshold (APthr, mV) was defined as the voltage
point where the upstroke’s slope trajectory first reached 10 mV/ms. AP amplitude was
defined as the difference in membrane potential between APthr and AP at peak. AP rise
time (ms) was the time from the APthr to the AP’s peak. AP duration (ms) was the time
interval from APthr to the same voltage value during repolarization. The amplitude
of afterhyperpolarization (AHP, mV) was defined as the difference between APthr and
the most negative membrane potential attained during the AHP. AP decay time was calculated
as the time from the AP’s peak to the peak of the AHP. Afterdepolarization (ADP) amplitude
(mV) was defined as the difference between AHP peak and the most positive voltage
value between AHP peak and the fast repolarization peak. In case of a lack of AHP,
ADP was recognized as the most positive membrane potential between steady-state voltage
and the peak of fast repolarization. Maximum AP up- and AP down-stroke were determined
as the maximum and minimum of the geometrical differential of the AP (mV/ms), respectively.
Maximum up- and down-stroke times were the times from APthr to reach maximum AP up-
and down-stroke, respectively. These parameters were measured for i) the first AP
elicited by 500-ms rheobasic current step; ii) the first AP evoked along a 1-s current
ramp of 0-150 pA and iii) the first three APs generated on a 750-ms trace as the voltage
deflection of double of the rheobasic current was injected. Adaptation ratio was calculated
as the ratio of the last inter-spike interval relative to the first five inter-spike
intervals. Firing frequency (Hz) was determined at saturating current injections producing
spike trains. AP amplitude accommodation was determined as a ratio of the average
of the last three AP peaks relative to the first five AP peaks (difference defined
in mVs). All parameters were measured (Supplementary Table 1) by applying manual procedures
custom-written in Matlab (MathWorks, USA).
Tissue clearing and light microscopy
Brain slices containing biocytin-filled neurons were post-fixed in 4% paraformaldehyde
in phosphate-buffer (PB, 0.1M, pH 7.8) at 4 °C overnight. Slices were repeatedly washed
in PB and cleared using “CUBIC reagent 1” (25 wt% urea, 25 wt% N,N,N’,N’-tetrakis(2-hydroxypropyl)
ethylenediamine and 15 wt% polyethylene glycol mono-p-isooctylphenyl ether/Triton
X-100) for 2 days
25,26
. After repeated washes in PB, biocytin localization was visualized using streptavidin-conjugated
horseradish peroxidase (Vectastain Elite) using 3.3′-diaminobenzidine (DAB) as chromogen
and H2O2 (0.05%) as substrate (in Tris-HCl, pH8.0). Slices were then re-washed in
PB and submerged in “CUBIC reagent 2” (50 wt% sucrose, 25 wt% urea, 10 wt% 2,20,20’-nitrilotriethanol
and 0.1% v/v% Triton X-100) for further clearing. Post-hoc neuroanatomy and neuronal
reconstructions were performed using 40x and 60x objectives on a light microscope
(Olympus BX51). Optionally, cleared tissues were imaged on a laser-scanning microscope
(LSM780 and ZEN2013 software, Zeiss). Three-dimensional filaments of DAB-stained cells
from 300 μm slices were reconstructed in Neurolucida (cx9000, Mbf Bioscience).
Cell harvesting for sequencing
A the end of each patch-clamp protocol, the micropipette was clamped to a holding
potential (Vhold) of −5 mV. Prior to the harvesting procedure, a continuous series
of depolarizing rectangular voltage pulses (5 ms at 5 ms intervals) were applied for
6-7 min with amplitudes of 25 mV from Vhold. The entire soma of each recorded neuron
was aspirated into the micropipette slowly (~1-2 min) by applying mild negative pressure
(−50 mPa). This procedure allowed us to retain a tight seal and to minimize RNA loss
by keeping the RNA molecules in the pipette solution. When we broke contact, the recording
pipette was pulled out from the recording chamber and then carefully rotated over
an expelling 0.2 μl tube, where its content (0.8-0.9 μl) was ejected onto a 0.6-μl
drop of lysis buffer pre-placed onto the side of a 0.2 ml tight-lock tube (TubeOne).
The resultant sample (1.5 μl) was span down (20 s) at 24 °C to the bottom of the conical
tube, stored at −80 °C and later subjected to in-tube reverse transcription (RT).
Lysis, cDNA synthesis and library preparation
Cell aspirates were dispensed into ~0.5 μl lysis mix consisting of 0.15% Triton X-100,
1 U/μl TaKaRa RNase inhibitor, 4 μM reverse transcription primer C1-P1-T31 5′-Bio-AATGATACGGCGACCACCGATCG
TTTTTTTTTTTTTTTTTTTTTTTTTTTTTTT-3′, 3.5 mM dNTP and 17.5 mM DTT. Samples were collected
and stored at −80 °C until batch processing. Before reverse transcription, samples
were thawed and lysed at 72 °C for 3 min, then cooled to 4 °C. Immediately following
the lysis step, 2 μl RT mix (1x SuperScript II First-Strand Buffer; Life Technologies)
supplemented with 10.6 mM MgCl2, 3.6 μM template-switching oligo C1-P1-RNA-TSO 5′-Bio-AAUGAUACGGCGACCACCGAUNNNNNNGGG-3′,
1.5 U/μl TaKaRa RNase inhibitor (Clontech), 1.45 M betaine and 21 U/μl Superscript
II reverse transcriptase (Life Technologies)) were added and incubated at 42 °C for
90 min followed by 72 °C for 10 min. Following reverse transcription, 8 μl PCR mix
(1x KAPA HiFi 2x ready mix and 240 nM C1-P1-PCR2 5′-Bio-GAATGATACGGCGACCACCGAT-3′)
were added and PCR-amplified using thermal cycling as follows: 95 °C for 3 min (5
cycles), 98 °C 20 s, 62 °C 4 min, 72 °C 6 min, (9 cycles) 98 °C 20 s, 68 °C 30 s,
72 °C 6 min, (7 cycles) 98 °C, 30 s, 68 °C 30 s, 72 °C 7 min. Subsequently, PCR samples
were cleaned using AMPure-XP beads (1:1 ratio; Beckman Coulter) and quantified by
qubit (Life Technologies) on an Agilent bioanalyzer. Library preparation was done
using tagmentation as described
29
.
Illumina sequencing
Libraries were sequenced on an Illumina Hiseq2000 instrument using C1-P1-PCR2 as read1
(50 nt) primer and C1-TN5-U PHO-CTGTCTCTTATACACATCTGACGC as index read (8 nt) primer.
Data analysis
Read processing and molecule counts were performed as reported recently
11
. We only analyzed cells with >1,500 mRNA molecules/cell (excluding mitochondrial,
repeat and rRNA) and if a complete catalogue of patch-clamp read-outs was available.
Alignment of interneurons and pyramidal cells on a cortical template
We used our recently described cortical dataset
11
to resolve each of the interneurons and pyramidal cells into one of template groups
(from >3,000 dissociated cells). First, we narrowed down our search to one of the
layer-specific pyramidal cell cohorts (S1PyrL1-L6) or interneuron groups (Int1-16),
22 groups in total. Because of a significant difference in the number of mRNA molecules
detected, we designed our classifier on correlation measures rather than Euclidian
distance. As feature selection is an important parameter for classification (e.g.,
which genes are “in use”), the classifier continuously updated the features for the
groups compared. First, the median expression for every group (in the cortex dataset)
was calculated. Because the standard deviation of the genes’ median expression (along
groups) did not depend strongly on their mean expression, we selected genes (features)
using a fixed threshold of standard deviation being >1.5 over the groups compared.
The process was as follows: i) selection of a Patch-seq cell for classification; ii)
setting the list of candidate groups to contain all 47 neuronal groups of the somatosensory
cortex; iii) selection of genes for the current iteration, std(gene median expression)
>1.5; iv) calculation of the correlation between a Patch-seq cell and all candidate
groups; v) ranking neuronal groups by their correlation to the Patch-seq cell (highest
to lowest); vi) removal of those candidate groups that were <50% with their correlation;
vii) if the list of candidate groups contained more than one group we looped back
to step iii. If only a single candidate group was left, the Patch-seq cell was assigned
to that particular group.
Correlation of gene expression and electrophysiology parameters
This analysis was aimed to identify mRNAs that might be predictors for electrophysiology
parameters. We focused on mRNAs coding for ion channels, receptors and synaptic transmission-related
proteins as sets of genes whose biological interpretation might be tested experimentally.
We tested the correlation between all genes (5,600) that passed our baseline criteria
(that is, more than 5 cells with non-zero expression, ~12% of data points) against
all electrophysiology parameters (110). Along with the correlation, p-values for the
null hypothesis of independent variables were calculated (permutation p-value shows
similar results). For each gene separately, we used a false recovery rate (FDR) of
10% to declare a significant correlation. This was performed separately for every
gene because otherwise the p-values strongly correlated and the assumptions for FDR
were violated. Next, we focused only on ion channels, receptors and synapse-related
genes (167 of these passed our above criteria). Correlation coefficients shown in
Supplementary Fig. 4 are for genes that exhibited correlation (or anti-correlation)
greater than 0.4.
Supplementary Material
Supplementary Figures 1-4
Supplementary Table 1
Related collections
Most cited references39
- Record: found
- Abstract: found
- Article: not found
Petilla terminology: nomenclature of features of GABAergic interneurons of the cerebral cortex.
- Record: found
- Abstract: found
- Article: not found
Quantitative single-cell RNA-seq with unique molecular identifiers.
Saiful Islam, Amit Zeisel, Simon Joost … (2014)