97
views
0
recommends
+1 Recommend
1 collections
    0
    shares
      • Record: found
      • Abstract: found
      • Article: found
      Is Open Access

      Using Social Media to Detect Outdoor Air Pollution and Monitor Air Quality Index (AQI): A Geo-Targeted Spatiotemporal Analysis Framework with Sina Weibo (Chinese Twitter)

      research-article

      Read this article at

          There is no author summary for this article yet. Authors can add summaries to their articles on ScienceOpen to make them more accessible to a non-specialist audience.

          Abstract

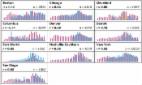
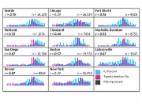
          Outdoor air pollution is a serious problem in many developing countries today. This study focuses on monitoring the dynamic changes of air quality effectively in large cities by analyzing the spatiotemporal trends in geo-targeted social media messages with comprehensive big data filtering procedures. We introduce a new social media analytic framework to (1) investigate the relationship between air pollution topics posted in Sina Weibo (Chinese Twitter) and the daily Air Quality Index (AQI) published by China’s Ministry of Environmental Protection; and (2) monitor the dynamics of air quality index by using social media messages. Correlation analysis was used to compare the connections between discussion trends in social media messages and the temporal changes in the AQI during 2012. We categorized relevant messages into three types, retweets, mobile app messages, and original individual messages finding that original individual messages had the highest correlation to the Air Quality Index. Based on this correlation analysis, individual messages were used to monitor the AQI in 2013. Our study indicates that the filtered social media messages are strongly correlated to the AQI and can be used to monitor the air quality dynamics to some extent.

          Related collections

          Most cited references5

          • Record: found
          • Abstract: found
          • Article: found
          Is Open Access

          The Reliability of Tweets as a Supplementary Method of Seasonal Influenza Surveillance

          Background Existing influenza surveillance in the United States is focused on the collection of data from sentinel physicians and hospitals; however, the compilation and distribution of reports are usually delayed by up to 2 weeks. With the popularity of social media growing, the Internet is a source for syndromic surveillance due to the availability of large amounts of data. In this study, tweets, or posts of 140 characters or less, from the website Twitter were collected and analyzed for their potential as surveillance for seasonal influenza. Objective There were three aims: (1) to improve the correlation of tweets to sentinel-provided influenza-like illness (ILI) rates by city through filtering and a machine-learning classifier, (2) to observe correlations of tweets for emergency department ILI rates by city, and (3) to explore correlations for tweets to laboratory-confirmed influenza cases in San Diego. Methods Tweets containing the keyword “flu” were collected within a 17-mile radius from 11 US cities selected for population and availability of ILI data. At the end of the collection period, 159,802 tweets were used for correlation analyses with sentinel-provided ILI and emergency department ILI rates as reported by the corresponding city or county health department. Two separate methods were used to observe correlations between tweets and ILI rates: filtering the tweets by type (non-retweets, retweets, tweets with a URL, tweets without a URL), and the use of a machine-learning classifier that determined whether a tweet was “valid”, or from a user who was likely ill with the flu. Results Correlations varied by city but general trends were observed. Non-retweets and tweets without a URL had higher and more significant (P<.05) correlations than retweets and tweets with a URL. Correlations of tweets to emergency department ILI rates were higher than the correlations observed for sentinel-provided ILI for most of the cities. The machine-learning classifier yielded the highest correlations for many of the cities when using the sentinel-provided or emergency department ILI as well as the number of laboratory-confirmed influenza cases in San Diego. High correlation values (r=.93) with significance at P<.001 were observed for laboratory-confirmed influenza cases for most categories and tweets determined to be valid by the classifier. Conclusions Compared to tweet analyses in the previous influenza season, this study demonstrated increased accuracy in using Twitter as a supplementary surveillance tool for influenza as better filtering and classification methods yielded higher correlations for the 2013-2014 influenza season than those found for tweets in the previous influenza season, where emergency department ILI rates were better correlated to tweets than sentinel-provided ILI rates. Further investigations in the field would require expansion with regard to the location that the tweets are collected from, as well as the availability of more ILI data.
            Bookmark
            • Record: found
            • Abstract: found
            • Article: not found

            Meta-analysis of time-series studies of air pollution and mortality: effects of gases and particles and the influence of cause of death, age, and season.

            A comprehensive, systematic synthesis was conducted of daily time-series studies of air pollution and mortality from around the world. Estimates of effect sizes were extracted from 109 studies, from single- and multipollutant models, and by cause of death, age, and season. Random effects pooled estimates of excess all-cause mortality (single-pollutant models) associated with a change in pollutant concentration equal to the mean value among a representative group of cities were 2.0% (95% CI 1.5-2.4%) per 31.3 microg/m3 particulate matter (PM) of median diameter < or = 10 microm (PM10); 1.7% (1.2-2.2%) per 1.1 ppm CO; 2.8% (2.1-3.5%) per 24.0 ppb NO2; 1.6% (1.1-2.0%) per 31.2 ppb O3; and 0.9% (0.7-1.2%) per 9.4 ppb SO2 (daily maximum concentration for O3, daily average for others). Effect sizes were generally reduced in multipollutant models, but remained significantly different from zero for PM10 and SO2. Larger effect sizes were observed for respiratory mortality for all pollutants except O3. Heterogeneity among studies was partially accounted for by differences in variability of pollutant concentrations, and results were robust to alternative approaches to selecting estimates from the pool of available candidates. This synthesis leaves little doubt that acute air pollution exposure is a significant contributor to mortality.
              Bookmark
              • Record: found
              • Abstract: found
              • Article: found
              Is Open Access

              The Complex Relationship of Realspace Events and Messages in Cyberspace: Case Study of Influenza and Pertussis Using Tweets

              Background Surveillance plays a vital role in disease detection, but traditional methods of collecting patient data, reporting to health officials, and compiling reports are costly and time consuming. In recent years, syndromic surveillance tools have expanded and researchers are able to exploit the vast amount of data available in real time on the Internet at minimal cost. Many data sources for infoveillance exist, but this study focuses on status updates (tweets) from the Twitter microblogging website. Objective The aim of this study was to explore the interaction between cyberspace message activity, measured by keyword-specific tweets, and real world occurrences of influenza and pertussis. Tweets were aggregated by week and compared to weekly influenza-like illness (ILI) and weekly pertussis incidence. The potential effect of tweet type was analyzed by categorizing tweets into 4 categories: nonretweets, retweets, tweets with a URL Web address, and tweets without a URL Web address. Methods Tweets were collected within a 17-mile radius of 11 US cities chosen on the basis of population size and the availability of disease data. Influenza analysis involved all 11 cities. Pertussis analysis was based on the 2 cities nearest to the Washington State pertussis outbreak (Seattle, WA and Portland, OR). Tweet collection resulted in 161,821 flu, 6174 influenza, 160 pertussis, and 1167 whooping cough tweets. The correlation coefficients between tweets or subgroups of tweets and disease occurrence were calculated and trends were presented graphically. Results Correlations between weekly aggregated tweets and disease occurrence varied greatly, but were relatively strong in some areas. In general, correlation coefficients were stronger in the flu analysis compared to the pertussis analysis. Within each analysis, flu tweets were more strongly correlated with ILI rates than influenza tweets, and whooping cough tweets correlated more strongly with pertussis incidence than pertussis tweets. Nonretweets correlated more with disease occurrence than retweets, and tweets without a URL Web address correlated better with actual incidence than those with a URL Web address primarily for the flu tweets. Conclusions This study demonstrates that not only does keyword choice play an important role in how well tweets correlate with disease occurrence, but that the subgroup of tweets used for analysis is also important. This exploratory work shows potential in the use of tweets for infoveillance, but continued efforts are needed to further refine research methods in this field.
                Bookmark

                Author and article information

                Contributors
                Role: Editor
                Journal
                PLoS One
                PLoS ONE
                plos
                plosone
                PLoS ONE
                Public Library of Science (San Francisco, CA USA )
                1932-6203
                27 October 2015
                2015
                : 10
                : 10
                : e0141185
                Affiliations
                [1 ]State Key Laboratory of Information Engineer in Surveying, Mapping and Remote Sensing, Wuhan University, Wuhan, Hubei, China
                [2 ]Department of Geography, San Diego State University, San Diego, California, United States of America
                Northwestern University, UNITED STATES
                Author notes

                Competing Interests: The authors have declared that no competing interests exist.

                Conceived and designed the experiments: YW WJ MT. Performed the experiments: WJ XF. Analyzed the data: YW WJ. Contributed reagents/materials/analysis tools: WJ MT XF. Wrote the paper: YW WJ MT.

                ‡ These authors also contributed equally to this work

                Article
                PONE-D-15-12474
                10.1371/journal.pone.0141185
                4624434
                26505756
                37784944-4fa4-406b-9066-3938e46880d9
                Copyright @ 2015

                This is an open access article distributed under the terms of the Creative Commons Attribution License, which permits unrestricted use, distribution, and reproduction in any medium, provided the original author and source are credited

                History
                : 28 March 2015
                : 6 October 2015
                Page count
                Figures: 8, Tables: 6, Pages: 18
                Funding
                This work is funded by the National Natural Science Foundation of China (Grant No. 41271399), China Special Fund for Surveying, Mapping and Geoinformation Research in the Public Interest(Grant No. 201512015), the Specialized Research Fund for the Doctoral Program of Higher Education (Grant No. 20120141110036), and the National Key Technology R&D Program of China (Grant No. 2012BAH35B03).
                Categories
                Research Article
                Custom metadata
                Data have been collected through the public Sina Weibo API ( http://open.weibo.com/wiki/SDK/en) and are stored at a repository of Wuhan University. Access to the data is restricted due to possible ethical/privacy considerations. Sina Weibo has published the policy ( http://open.weibo.com/wiki/平台公约), which stated that data from Sina Weibo cannot be published to third-party without authorization. Thus the data used for this analysis cannot be included in the manuscript, supplemental files, or a public repository. Those who are interested in the data can contact with Dr. Wang ( ydwang@ 123456whu.edu.cn ), and apply permission from Sina. In addition, the method how to collect the underlying data for this study using the Sina Weibo API has been introduced detailedly in the second paragraph of the section “Data collection”.

                Uncategorized
                Uncategorized

                Comments

                Comment on this article