3
views
0
recommends
+1 Recommend
0 collections
    0
    shares
      • Record: found
      • Abstract: found
      • Article: found
      Is Open Access

      Life Cycle GHG Perspective on U.S. Natural Gas Delivery Pathways

      research-article

      Read this article at

          There is no author summary for this article yet. Authors can add summaries to their articles on ScienceOpen to make them more accessible to a non-specialist audience.

          Abstract

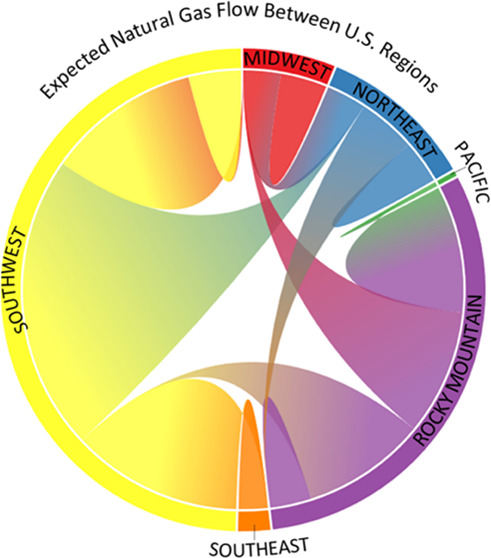
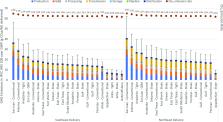
          Recent emission measurement campaigns have improved our understanding of the total greenhouse gas (GHG) emissions across the natural gas supply chain, the individual components that contribute to these emissions, and how these emissions vary geographically. However, our current understanding of natural gas supply chain emissions does not account for the linkages between specific production basins and consumers. This work provides a detailed life cycle perspective on how GHG emissions vary according to where natural gas is produced and where it is delivered. This is accomplished by disaggregating transmission and distribution infrastructure into six regions, balancing natural gas supply and demand locations to infer the likely pathways between production and delivery, and incorporating new data on distribution meters. The average transmission distance for U.S. natural gas is 815 km but ranges from 45 to 3000 km across estimated production-to-delivery pairings. In terms of 100-year global warming potentials, the delivery of one megajoule (MJ) of natural gas to the Pacific region has the highest mean life cycle GHG emissions (13.0 g CO 2e/MJ) and the delivery of natural gas to the Northeast U.S. has the lowest mean life cycle GHG emissions (8.1 g CO 2e/MJ). The cradle-to-delivery scenarios developed in this work show that a national average does not adequately represent the upstream GHG emission intensity for natural gas from a specific basin or delivered to a specific consumer.

          Abstract

          This study provides a detailed life cycle perspective on how GHG emissions vary according to where natural gas is produced and where it is delivered.

          Related collections

          Most cited references27

          • Record: found
          • Abstract: found
          • Article: not found

          Assessment of methane emissions from the U.S. oil and gas supply chain

          Methane emissions from the U.S. oil and natural gas supply chain were estimated using ground-based, facility-scale measurements and validated with aircraft observations in areas accounting for ~30% of U.S. gas production. When scaled up nationally, our facility-based estimate of 2015 supply chain emissions is 13 ± 2 Tg/y, equivalent to 2.3% of gross U.S. gas production. This value is ~60% higher than the U.S. EPA inventory estimate, likely because existing inventory methods miss emissions released during abnormal operating conditions. Methane emissions of this magnitude, per unit of natural gas consumed, produce radiative forcing over a 20-year time horizon comparable to the CO2 from natural gas combustion. Significant emission reductions are feasible through rapid detection of the root causes of high emissions and deployment of less failure-prone systems.
            Bookmark
            • Record: found
            • Abstract: found
            • Article: not found

            Measurements of methane emissions at natural gas production sites in the United States.

            Engineering estimates of methane emissions from natural gas production have led to varied projections of national emissions. This work reports direct measurements of methane emissions at 190 onshore natural gas sites in the United States (150 production sites, 27 well completion flowbacks, 9 well unloadings, and 4 workovers). For well completion flowbacks, which clear fractured wells of liquid to allow gas production, methane emissions ranged from 0.01 Mg to 17 Mg (mean = 1.7 Mg; 95% confidence bounds of 0.67-3.3 Mg), compared with an average of 81 Mg per event in the 2011 EPA national emission inventory from April 2013. Emission factors for pneumatic pumps and controllers as well as equipment leaks were both comparable to and higher than estimates in the national inventory. Overall, if emission factors from this work for completion flowbacks, equipment leaks, and pneumatic pumps and controllers are assumed to be representative of national populations and are used to estimate national emissions, total annual emissions from these source categories are calculated to be 957 Gg of methane (with sampling and measurement uncertainties estimated at ± 200 Gg). The estimate for comparable source categories in the EPA national inventory is ~1,200 Gg. Additional measurements of unloadings and workovers are needed to produce national emission estimates for these source categories. The 957 Gg in emissions for completion flowbacks, pneumatics, and equipment leaks, coupled with EPA national inventory estimates for other categories, leads to an estimated 2,300 Gg of methane emissions from natural gas production (0.42% of gross gas production).
              Bookmark
              • Record: found
              • Abstract: not found
              • Article: not found

              Energy and environment. Methane leaks from North American natural gas systems.

                Bookmark

                Author and article information

                Journal
                Environ Sci Technol
                Environ Sci Technol
                es
                esthag
                Environmental Science & Technology
                American Chemical Society
                0013-936X
                1520-5851
                24 October 2022
                15 November 2022
                : 56
                : 22
                : 16033-16042
                Affiliations
                []U.S. Department of Energy, National Energy Technology Laboratory Support Contractor , Pittsburgh, Pennsylvania 15236, United States
                []U.S. Department of Energy, National Energy Technology Laboratory , Pittsburgh, Pennsylvania 15236, United States
                Author notes
                Author information
                https://orcid.org/0000-0003-0546-4237
                Article
                10.1021/acs.est.2c01205
                9671042
                36279304
                94313abd-bd7a-4751-a875-1f6052b966b7
                © 2022 The Authors. Published by American Chemical Society

                Permits non-commercial access and re-use, provided that author attribution and integrity are maintained; but does not permit creation of adaptations or other derivative works ( https://creativecommons.org/licenses/by-nc-nd/4.0/).

                History
                : 17 February 2022
                : 04 October 2022
                : 03 October 2022
                Funding
                Funded by: Office of Fossil Energy, doi 10.13039/100006120;
                Award ID: NA
                Categories
                Article
                Custom metadata
                es2c01205
                es2c01205

                General environmental science
                natural gas value chain,natural gas transmission,natural gas distribution,greenhouse gas,global warming potential

                Comments

                Comment on this article