
Introduction
Type 2 diabetes mellitus (T2DM) is a common and complex metabolic disorder characterized by chronic hyperglycemia resulting from both insulin resistance in insulin-sensitive tissues and inadequate insulin secretion from β-pancreatic cells [1]. T2DM is a major global health concern with a substantial burden on health care systems worldwide [2]. T2DM is an outcome of the interplay between environmental, genetic, and epigenetic factors [3]. Despite extensive research, the precise mechanisms underlying the development and progression of T2DM remain elusive.
Recent investigations have uncovered an interesting link between the risk of T2DM and uric acid (UA) metabolism. These studies have yielded varied results. Some studies have reported an association between disease risk and elevated serum UA (SUA) levels [4–6], while other studies have reported a negative association [7] or no association [8]. UA, a metabolic terminal product of purine metabolism [9], has long been known for a role in gout, which is characterized by elevated UA levels [10]. Corollary studies have shown that the SUA level as is potentially involved in T2DM incidence and pathogenesis [6,11,12].
Elevated SUA levels are linked to β-cell dysfunction through UA-induced inflammation and oxidative stress, which increase the risk of developing T2DM [13]. High SUA levels have also been associated with T2DM complications, such as retinopathy [14] and cardiovascular disorders [15]. In contrast, a previous study showed no association between SUA and HbA1c levels among patients with T2DM in North Sumatera, Indonesia [16]. In addition, a study conducted in Jordan showed that the risk of hyperuricemia in patients with T2DM was notably elevated in female patients and patients with an increased waist circumference and a family history of hyperuricemia [17]. The primary objective of the current study was to determine SUA levels among Jordanian T2DM patients and assess correlations with disease control as reflected by HbA1c levels.
Recently, research has focused on determining the genetic basis for T2DM susceptibility [18]. This effort has led to the identification of multiple single nucleotide polymorphisms (SNPs) associated with T2DM [19]. SNPs, as the most prevalent genetic variations within the human genome, significantly influence an individual’s susceptibility to various diseases [20]. Notably, several SNPs have been linked to T2DM [19], reflecting the intricate genetic landscape contributing to this condition.
Hyperuricemia, a condition characterized by elevated UA levels, arises from increased UA synthesis or an impaired renal urate-transport system leading to decreased excretion [21]. The Solute carrier family 2 member 9 (SLC2A9) gene is one of the main genes involved in controlling the UA level. In fact, genetic variations within SLC2A9 influence UA transport, thereby impacting the UA level [22]. The SLC2A9 gene encodes the glucose transporter 9 (GLUT9) protein, which serves as a glucose and UA transporter [23]. There is evidence that SLC2A9 SNPs are susceptibility factors and have an essential role in maintaining glucose and UA homeostasis.
Among these SNPs, rs16890979 is strongly associated with variations in SUA levels [24,25]. Additionally, rs13129697 has been linked to impaired glucose tolerance and impaired fasting glucose complicated by hyperuricemia in diabetic Han Chinese males [23]. Given these findings, SLC2A9 SNPs (rs13129697, rs16890979) within Jordanian diabetics were the focus of the current study. Specifically, the objective of the current study was to explore the association between SLC2A9 SNPs and UA levels, and the impact on T2DM control.
Xanthine dehydrogenase/xanthine oxidase (XDH/XO) has a crucial role in UA synthesis. XDH/XO is a limiting factor in UA synthesis [26]. The formation of UA is primarily determined by the quantity of substrate and the enzymatic activity of XO [26]. Furthermore, XDH exhibits low reactivity and can undergo conversion to XO [27].Therefore, we reasoned that a study involving an SNP of the XDH gene and its relationship to T2DM glycemic control would add to our understanding of factors impacting T2DM. One of the SNPs that particularly piqued our interest is rs206833, which has been reported to be an intergenic variant (upstream) of XDH [28]. Surprisingly, despite the location of XDH, there has been a notable absence of literature exploring the association of this specific SNP with the incidence or control of T2DM. The current study marks a pioneering endeavor to link the rs206833 SNP to the regulation of T2DM, shedding new light on the potential role of rs206833 in this complex metabolic disorder.
In summary, this study represents a focused exploration into the intricate relationship between UA levels and the regulation of T2DM. As more evidence is generated, it appears that SLC2A9- and XDH-related SNPs are linked to controlling T2DM and keeping UA levels in check. By illuminating these genetic associations, our aim was to enhance our understanding concerning the molecular underpinnings of T2DM and UA dysregulation. Ultimately, this research will pave the way for more targeted and personalized approaches to the management and prevention of these complex metabolic disorders.
Materials and methods
Ethical approval
This study received approval from the Deanship of Research and the Institutional Review Board (IRB) Committee of Jordan University of Science and Technology (JUST) and the King Abdullah University Hospital (KAUH; IRB number: 41/132/2020). All enrolled patients in the study provided informed consent, indicating their willingness to contribute to this research endeavor.
Enrolled patient characteristics
One hundred eighty-four T2DM patients from northern Jordan attending the Endocrine Clinic at KAUH, which is located in northern Jordan, between September 2020 and July 2021, were examined. The inclusion criteria included patients diagnosed with T2DM ≥25 years of age. Patients <25 year of age, and patients who were pregnant and patients with gout or currently being treated with allopurinol were excluded from the study.
The study involved interviews with a clinical research coordinator. During these interviews the patients were informed about the study objectives, which involved the collection of a wide range of data, including demographic details, anthropometric measurements, clinical information, and blood samples. Demographic data, such as patient age, gender, and smoking status, were collected with anthropometric data, which included the height and weight to calculate the body mass index (BMI) using the following formula: BMI = weight in kg/square of height in m2. In addition, the HbA1c level was recorded. Patients were classified into controlled and uncontrolled diabetes groups based on the HbA1c level. The controlled T2DM patients were matched with uncontrolled T2DM patients for gender and age. Every effort was made to pair patients in both groups with exact age matches or within a ±5-year age range. Figure 1 represents the participant flow diagram.
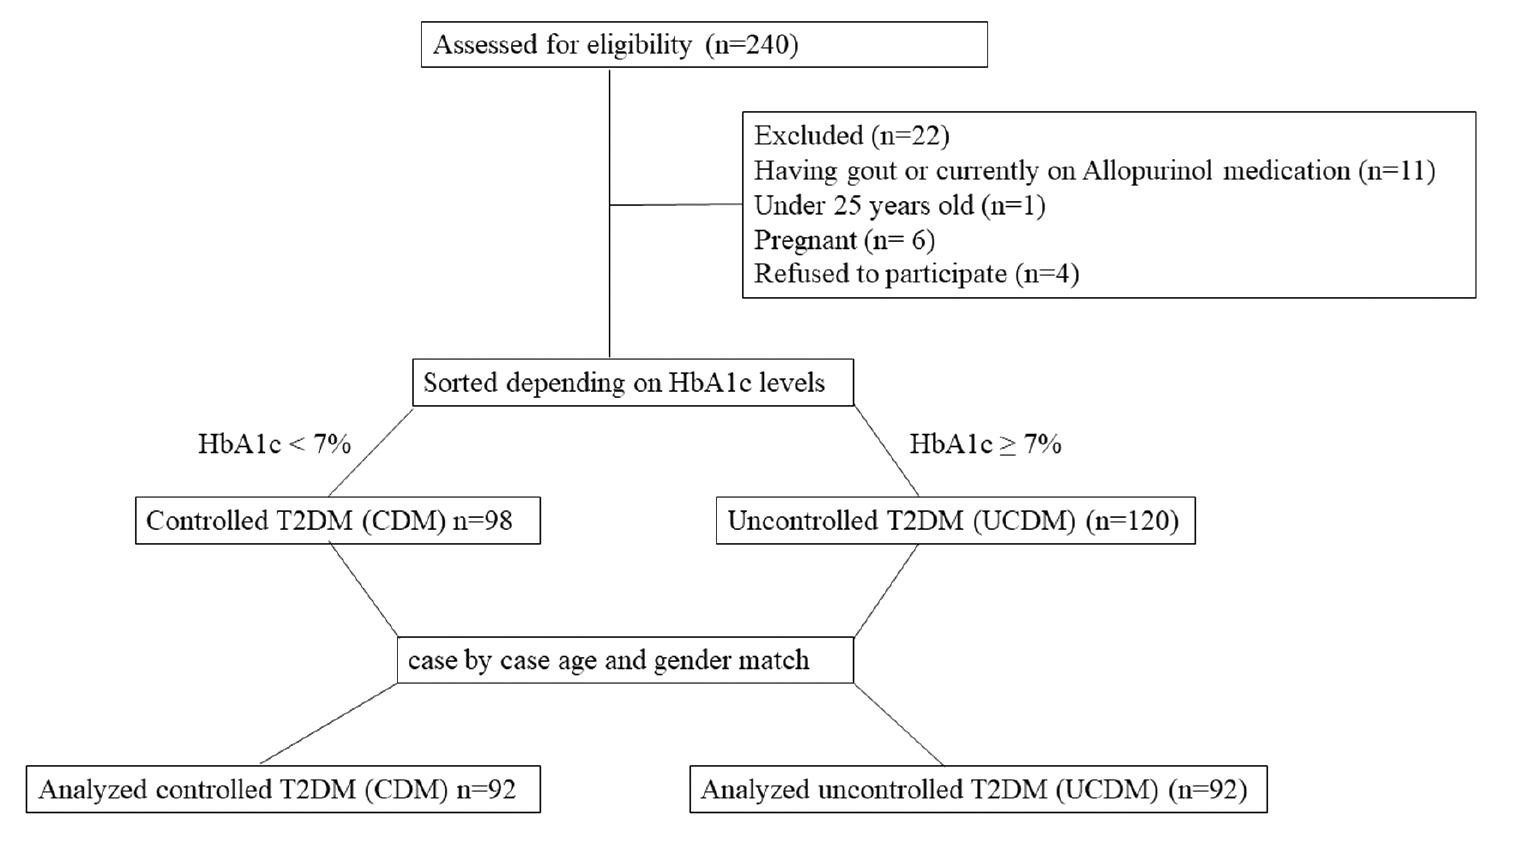
Flow diagram of participant screening. A total of 240 patients were evaluated to determine eligibility. A total of 22 participants did not match the inclusion criteria and were therefore excluded from the study. The HbA1c levels were assessed for the remaining participants (n=218). The patients were categorized based on the HbA1c levels. Only patients with controlled T2DM and uncontrolled T2DM who were matched for age and gender were included in the subsequent analysis. The total number of patients included in the analysis was 184.
Blood sample collection
Each participant provided two venous blood samples. The first sample was collected using ethylenediamine tetra-acetic acid (EDTA) tubes and was designated for molecular analysis. The first blood samples were stored at 4°C to preserve the genetic material for subsequent DNA extraction. The second blood sample was collected into plain tubes for biochemical analysis. After the natural coagulation process, the serum was extracted by centrifugation at 500×g. The serum samples were stored at −80°C to ensure preservation of the biochemical composition for future experiments.
Serum uric acid measurement
Serum uric acid (SUA) levels were measured according to the manufacturer’s protocol of the enzymatic colorimetric kit (OSR6098; Beckman Coulter, Brea, CA, USA).
DNA extraction
Genomic DNA extraction was conducted using a QIAamp DNA Blood Mini Kit (Qiagen, Hilden, Germany), according to the manufacturer’s protocol. After completion of the protocol, the concentration of the extracted DNA was measured using an ND-2000 Nanodrop (Thermo Fisher Scientific, Waltham, MA, USA). To preserve the integrity of these genetic materials, the DNA samples were stored at −20°C for subsequent processing and analysis.
Tetra-ARMS PCR
An amplification-refractory mutation system (ARMS) PCR was used to genotype polymorphisms. This method underwent rigorous optimization utilizing tetra-primers specifically designed for rs13129697, rs16890979, and rs206833. The ARMS PCR primers were designed using SNPgen® and the sequences of the primers are shown in Table 1 (https://snp.biotech.edu.lk/index.php).
Amplification-Refractory Mutation System (ARMS) Primers
| SNP | Primers 5′ to 3′ | Annealing (°C) | Product size (bp) |
|---|---|---|---|
| rs13129697 (T>G) | Forward outer CTTTGTTGCCTGCCTAGGACATCCTTT | 58 | 247 |
| Reverse outer CCACAGTAACACAGCATCCCTTAAATGG | |||
| Forward inner (T allele) TCTTGCACCTGTGTCTGTCTCTCTCGT | 133 | ||
| Reverse inner (G allele) ACGCCCCAGACAAGAGTGAAAGTACC | 167 | ||
| rs16890979 (C>T) | Forward outer ACAGAACTGAGATTTGAACCTGGGCGTCT | 64 | 436 |
| Reverse outer ATAGTTTCAAAGGCCCCTGCCAAGTTCC | |||
| Forward inner (C allele) CCAGGACCTCCTCTACCTCTTGGGACAC | 200 | ||
| Reverse inner (T allele) CCAAACGTTCTTGGGTAAAGCAGCCA | 290 | ||
| rs206833 (G>A) | Forward outer ACAGGCGTAGGAGGTAGCTGGAGACCCT | 64 | 438 |
| Reverse outer TTCAGGCTTTGGAGAGTCCAAGGTGAGC | |||
| Forward inner (G allele) CTTCTGAGAGCACTGTCCCAGGACGG | 222 | ||
| Reverse inner (A allele) GGTGTTTTTTGGCCAACAGAGATTCAGCAT | 272 |
A PCR reaction was carried out in a total volume of 20 μL. The reaction consisted of 0.5 μL (5 pmol) of each primer, which included forward outer, reverse outer, forward inner, and reverse inner primers. Additionally, 10 μL from 2× Taq® Green Master Mix (Promega, Madison, WI, USA) and approximately 2 μL of DNA (30-50 ng) from each patient sample were added to the mixture. The final volume of 20 μL was adjusted by adding nuclease-free ddH2O.
The PCR thermocycling conditions used were as follows: initial denaturation at 95°C for 12 min; followed by 30 cycles of 95°C for 15 seconds; annealing at a specific temperature ( Table 1 ) for each SNP for 30 seconds; 72°C for 2 min; and a final extension was run at 72°C for 10 min.
PCR products were separated using 2% agarose gel electrophoresis stained with ethidium bromide dye. The gel was visualized using a gel documentation system. The interesting region of the SNP site was amplified using both forward and reverse outer primers, resulting in the generation of a larger size band that served as the control. Each of the inner primers was designed to target a specific allele, as indicated in Table 1 .
Statistical analysis
The associations between the examined SNPs and the T2DM control, as well as finding the allele frequency, were performed using the SNPstat web tool for SNP analysis (https://www.snpstats.net/start.htm).
The comparison between SUA levels in the uncontrolled T2DM (UCDM) group and the controlled T2DM (CDM) group was analyzed using Student’s t-test and in different genotype groups using one-way ANOVA. For categorical analysis, a chi-square test was used. The significance threshold for all analyses was set at a P=0.05, with a significant result at a P≤0.05. Graphpad Prism software (version 9) was used to perform the statistical analysis.
Results
Demographic data of the patients
One hundred eighty-four patients diagnosed with T2DM were recruited and divided into 2 groups: 92 patients with CDM (HbA1c <7%), and 92 patients with UCDM (HbA1c ≥7%). The characteristics of these patients are presented in Table 2 .
Patient Characteristics
| CDM (n=92) | UCDM (n=92) | P value | |
|---|---|---|---|
| Gender: n (%) | |||
| Males | 42 (45.65) | 42 (45.65) | 1.0000 |
| Females | 50 (54.35) | 50 (54.35) | |
| Age mean (± SD) | 58.85 (± 9.96) | 58.84 (± 10.47) | 0.9943 |
| BMI mean (± SD) | 31.28 (± 7.40) | 31.35 (± 6.32) | 0.9508 |
| Smoking status n (%) | |||
| Active smoker | 13 (16.05) | 16 (18.60) | 0.7543 |
| Non-smoker | 64 (79.01) | 64 (74.42) | |
| Ex-smoker | 4 (4.94) | 6 (6.98) | |
| Missing | 11 | 6 | |
| HTN co-morbidity n (%) | 59 (72.84) | 61 (72.62) | 0.9746 |
| HbA1c mean (± SD) | 6.18 (0.47) | 8.69 (1.36) | 0.0001*** |
HTN: hypertension; CDM: controlled type 2 diabetes mellitus; UCDM: uncontrolled type 2 diabetes mellitus; ***P≤0.001.
A matching process for age and gender was assured. Consequently, there were no significant differences between both groups with respect to age or gender distribution. Furthermore, the BMI analysis revealed no significant difference between the CDM and UCDM groups, signifying a meticulous balance in this essential parameter.
Female patients comprised 54.35% of the patients in both groups. The mean patient age was approximately 58.8 years (±10 years). Additionally, the mean BMI was nearly the same in both groups (31.3 ±7 kg/m2).
There were also no noteworthy differences in smoking status between the groups. The majority of patients were non-smokers (79.01% and 74.42% in the CDM and UCDM groups, respectively). This meticulous attention to matching and comprehensive analysis not only strengthened the study reliability but also underscored the significance of the findings within a well-defined demographic context.
UA levels and the control of T2DM
To comprehend the intricate relationship between the SUA level and management of T2DM, our initial endeavor was to meticulously assess the SUA concentrations among the enrolled patients using a highly sensitive colorimetric assay.
The unexpected results, presented graphically in Figure 2 , revealed no statistically significant difference in SUA levels between the CDM and UCDM groups (P=0.6563). Both groups exhibited comparable mean SUA levels (333.88 and 327.45 μmol/L for the CDM and UCDM groups, respectively) underscoring the nuanced nature of UA levels within the context of T2DM management.
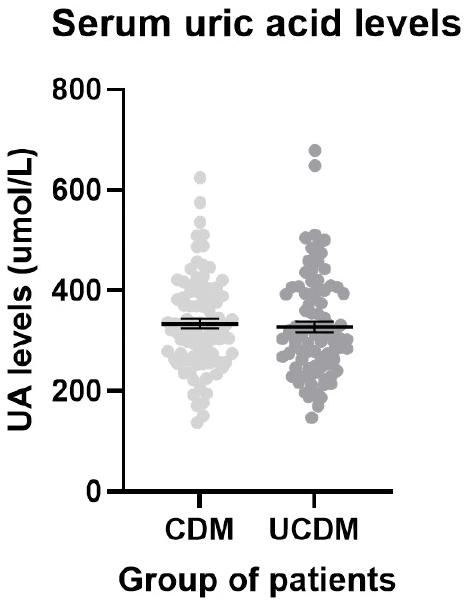
A scatter dot plot representing the serum uric acid (SUA) levels of the T2DM patients. The lines represent the mean and the bars represent the SEM. The controlled T2DM (CDM) mean was 333.88 ± 9.70 μmol/L and the uncontrolled T2DM (UCDM) mean was 327.45 ± 10.58 μmol/L There was no statistical difference between the SUA mean of the CDM and UCDM patients (P=0.7318).
SNP genotypes and T2DM control
Next, the two SNPs within the urate transporter SLC2A9 (GLUT9) gene and the rs206833 variant linked to the XDH gene within the context of controlling T2DM were investigated using the SNPstat web tool. The objective was to discern any potential associations between these SNPs and T2DM control. The frequencies of each SNP genotype among the CDM and UCDM groups are documented in Table 3 .
Genotype Frequency of SLC2A9 and XDH SNPs in T2DM
| SNP ID | Genotype | All subjects | CDM (n=92) | UCDM (n=92) | OR (95% CI) | P-value |
|---|---|---|---|---|---|---|
| rs13129697 n (%) | TT | 63 (34.4) | 31 (33.7) | 32 (35.2) | Reference | 0.3120 |
| TG | 86 (47.0) | 40 (43.5) | 46 (50.6) | 1.11 (0.58-2.14) | ||
| GG | 34 (18.6) | 21 (22.8) | 13 (14.3) | 0.60 (0.26-1.40) | ||
| Missing | 1 (--) | 0 (--) | 1 (--) | |||
| rs16890979 n (%) | CC | 93 (51.7) | 52 (56.5) | 41 (46.6) | Reference | 0.0102** |
| CT | 73 (40.6) | 29 (31.5) | 44 (50.0) | 1.92 (1.03-3.59) | ||
| TT | 14 (7.8) | 11 (12.0) | 3 (3.4) | 0.35 (0.09-1.32) | ||
| Missing | 4 (--) | 0 (--) | 4 (--) | |||
| rs206833 n (%) | GG | 121 (66.5) | 65 (71.4%) | 56 (61.5%) | Reference | 0.0054** |
| GA | 54 (29.7) | 26 (28.6%) | 28 (30.8%) | 1.25 (0.66-2.38) | ||
| AA | 7 (3.9) | 0 (0.0%) | 7 (7.7%) | --- | ||
| Missing | 2 (--) | 1 (--) | 1 (--) |
SNP: single nucleotide polymorphism; CDM: controlled type 2 diabetes mellitus; UCDM: uncontrolled type 2 diabetes mellitus; **P≤0.01.
Examining rs13129697, our analysis revealed There was no significant difference in the rs13129697 genotype frequency between the CDM and UCDM groups. The predominant genotype in both groups was heterozygous (TG), followed by (TT), then GG.
Interestingly, the SNPs (rs16890979 and rs206833) both showed a notably significant genotype association with T2DM control (P=0.0102 and 0.0054, respectively). With respect to rs16890979, the CC and TT genotypes were more prevalent in the CDM group than the UCDM group. Conversely, the heterozygous genotype (CT) was more frequent in the UCDM group than the CDM group (50% vs. 31.5%), increasing the risk of losing T2DM control by nearly 2-fold (OR = 1.92, CI = 1.03-3.59; Table 3 ).
In contrast, the rs206833 AA genotype was entirely absent in the CDM group but was expressed in 7.7% of the UCDM patients. The GG genotype was prevalent in 71.4% and 61.5% of the CDM and UCDM group patients, respectively. These findings illuminate distinct genetic variations that play a part in the intricate dynamics of T2DM control, providing valuable insight into the genetic basis of disease management.
SNP allele frequency and T2DM control
No statistically significant associations were detected with the allele frequencies of both SLC2A9 SNPs and T2DM control. Specifically, the minor allele (G) frequency of rs13129697 was 0.42 among all T2DM patients, and present in 45% of CDM patients and 40% of UCDM patients. Similarly, the minor allele (T) frequency of rs16890979 was 0.28 among the enrolled T2DM patients, occurring in 28% of CDM patients and 29% of UCDM patients ( Table 4 ).
Allele Frequencies of SLC2A9 and XDH SNPs in T2DM
| Gene | SNP ID | Allele | All subjects | CDM (n=92) | UCDM (n=92) | P-value |
|---|---|---|---|---|---|---|
| SCL2A9 n (%) | rs13129697 | T | 212 (0.58) | 102 (0.55) | 110 (0.6) | 0.3322 |
| G | 154 (0.42) | 82 (0.45) | 72 (0.4) | |||
| SCL2A9 n (%) | rs16890979 | C | 259 (0.72) | 133 (0.72) | 126 (0.72) | 0.8839 |
| T | 101 (0.28) | 51 (0.28) | 50 (0.29) | |||
| XDH n (%) | rs206833 | G | 296 (0.81) | 156 (0.86) | 140 (0.77) | 0.0314* |
| A | 68 (0.19) | 26 (0.14) | 42 (0.23) |
XDH: xanthine dehydrogenase; SNP: single nucleotide polymorphism; CDM: controlled type 2 diabetes mellitus; UCDM: uncontrolled type 2 diabetes mellitus; *P≤0.05.
However, in contrast, our analysis of the SNP, rs206833, had a significant association with T2DM control. The minor allele was notably more prevalent in UCDM patients compared to CDM patients (23% vs. 14%; Table 4 ). This significant disparity suggests an elevated risk of losing control over T2DM for individuals carrying the A allele for this SNP.
These findings provide a comprehensive view of the genetic landscape associated with T2DM control. While the alleles of some SNPs did not exhibit significant associations, the distinctive pattern observed with rs206833 highlights the potential relevance in understanding the complexities of T2DM management.
SNPs and SUA levels
Our analysis was extended to determine whether the previously mentioned SNPs had any correlation with the SUA levels among each group of T2DM patients. Predictably, our findings revealed that none of the examined SNPs exhibited a significant association with SUA levels in the CDM or UCDM groups (P>0.05; Table 5 ).
SUA Levels According to Genotype and the Control of T2DM
| SNP ID | Genotype | CDM (n=92) | UCDM (n=92) | ||
|---|---|---|---|---|---|
| SUA mean (SD) | P-value | SUA mean (SD) | P-value | ||
| rs13129697 | GG | 331.86 (121.38) | 0.6990 | 322.74 (124.75) | 0.2645 |
| TG | 367.95 (106.32) | 311.42 (75.80) | |||
| TT | 363.71 (56.38) | 350.12 (121.47) | |||
| rs16890979 | CC | 392.15 (81.38) | 0.1049 | 342.35 (116.70) | 0.2596 |
| CT | 322.68 (99.62) | 312.00 (70.45) | |||
| TT | 3570.0 (128.94) | 283.3 (36.37) | |||
| rs206833 | AA | ---- | 0.3781 | 378.94 (134.38) | 0.3391 |
| GA | 342.74 (43.50) | 315.39 (110.35) | |||
| GG | 371.14 (118.32) | 326.14 (92.58) | |||
SNP: single nucleotide polymorphism; SUA: serum uric acid; CDM: controlled type 2 diabetes mellitus; UCDM: uncontrolled type 2 diabetes mellitus.
This lack of association between the SNPs and SUA levels suggests that while these genetic variations might play a role in T2DM regulation, the genetic variations do not directly impact the SUA levels. This nuanced understanding further refines our insight into the intricate relationship between genetic factors, diabetes control, and UA metabolism, providing a more comprehensive perspective for future research and clinical interventions.
In conclusion, our findings underscore the critical role of genetic variations in the SLC2A9 and XDH genes in T2DM control. The presence of the CT genotype at rs16890979 variant in the SLC2A9 gene and the AA at rs206833 variant linked to the XDH gene has been definitively linked to less control over T2DM. The rs206833 variant is also linked to T2DM control allele frequency levels. The A allele appears to decrease control over T2DM. This insight not only expands our understanding of the genetic basis of T2DM but also highlights potential avenues for personalized treatments and targeted interventions. As we move forward, exploring these genetic markers in larger, more diverse populations could pave the way for more effective and tailored approaches in T2DM management.
Discussion
DM stands as a formidable chronic disease that poses a significant threat to human health. This multifaceted polygenic metabolic disorder, marked by heightened levels of blood glucose, is influenced by a complex interplay of genetic and environmental factors [29]. Various studies have underscored the role of high SUA as a risk factor for T2DM [5,12]. For example, the prospective data gleaned from two successive generations of the Framingham Heart Study provided evidence that individuals who have elevated levels of SUA, even among younger adults, face a substantially elevated risk of developing T2DM independent of established risk factors [30].
In the current study we determined the SUA levels in T2DM patients and the association with HbA1c control. Surprisingly, no correlation existed between SUA levels and T2DM control. This finding is in agreement with the findings of a study conducted in North Sumatera, Indonesia [31], which also showed no significant correlation between hyperuricemia and T2DM control. However, conflicting evidence emerged from a study in Turkey, where SUA levels were notably deteriorated among patients with UCDM compared to patients with CDM [32].
The study delved deeper into the genetic factors at play, focusing on three SNPs (rs13129697, rs16890979, and rs206833) within the SLC2A9 and upstream of XDH genes. The rs13129697 SNP has been linked to hyperuricemia in Korean populations [33] but the rs13129697 SNP had no effect on SUA levels or T2DM control in the current study. Intriguingly, the rs13129697 SNP was shown to be correlated with multiple health parameters. Specifically, the rs13129697 SNP has correlations with triglyceride levels and gout [34]. Furthermore, the rs13129697 SNP is associated with a reduced risk of hyperuricemia in Chinese hypertensive patients [35] and is linked to impaired glucose tolerance or impaired fasting glucose complicated by hyperuricemia in Han Chinese males [23]. In the current study the minor allele frequency (MAF) of this SNP among the enrolled T2DM patients was 0.42, closely aligning with frequencies (0.42-0.49) reported in another Chinese study involving hypertensive subjects [35] and the frequency (0.478) reported on the genome-wide association studies (GWASs) catalog website (https://www.ebi.ac.uk/gwas/variants/rs13129697).
The rs16890979 SNP, which is located in exon 8 of the SLC2A9 gene, results in replacement of the amino acid, valine, with isoleucine at position 253 [36]. While GWASs revealed an association between rs16890979 with SUA levels [37,38] and increasing the risk of gout [37], the current study focused on T2DM and revealed a significant association with the T2DM control but no significant association with SUA levels. This discrepancy might stem from our exclusive focus on diabetic patients or the genetic background of Jordanians. The MAF for rs16890979 in the T2DM patients (0.28) closely matched the frequency reported (0.2638) by the GWAS catalog website (https://www.ebi.ac.uk/gwas/variants/rs16890979).
The rs206833 SNP, reported as an XDH-related variant with a MAF (A allele) of 0.17 in unrelated European ancestry participants, proved to be particularly fascinating [28]. In the current study the rs206833 SNP was associated with T2DM control. The minor allele (A) was shown to be much more common in UCDM patients (0.23) than CDM patients (0.14). Notably, the AA genotype was absent in CDM patients but constituted 7.7% of the UCDM patient population.
These findings underscore the complexity and diversity of genetic influences on T2DM and associated conditions. The unique genetic landscape of different populations adds layers of intricacy to these associations, emphasizing the need for tailored, population-specific research. These discoveries not only deepen our understanding of genetic factors in diabetes but also pave the way for more targeted, individualized approaches in diabetes management and treatment.
Although this study had several merits as described above, it is important to acknowledge a few shortcomings. Initially, the current investigation focused solely on examining the association between HbA1c control in T2DM patients with the three specified SNPs. The study was conducted exclusively in a hospital located in northern Jordan. A comprehensive study that encompasses many hospitals and covers a wider geographic area in Jordan is warranted. Although conducting such a study may incur significant expenses, it is of utmost importance. Further, the current study did not collect information regarding the medications for each participant. Moreover, studying XDH and SLC2A9 gene expression and the association with three specified SNPs might give an indication about the overall control of T2DM. Finally, the specific pathogenic processes of the investigated SNPs in the progression and complications of T2DM are not fully understood.